. 2024 Jun 21;15(1):5306.
doi: 10.1038/s41467-024-49596-0.

Adult microglial TGFβ1 is required for microglia homeostasis via an autocrine mechanism to maintain cognitive function in mice

Affiliations

Adult microglial TGFβ1 is required for microglia homeostasis via an autocrine mechanism to maintain cognitive function in mice

Alicia Bedolla et al. Nat Commun. .

Abstract

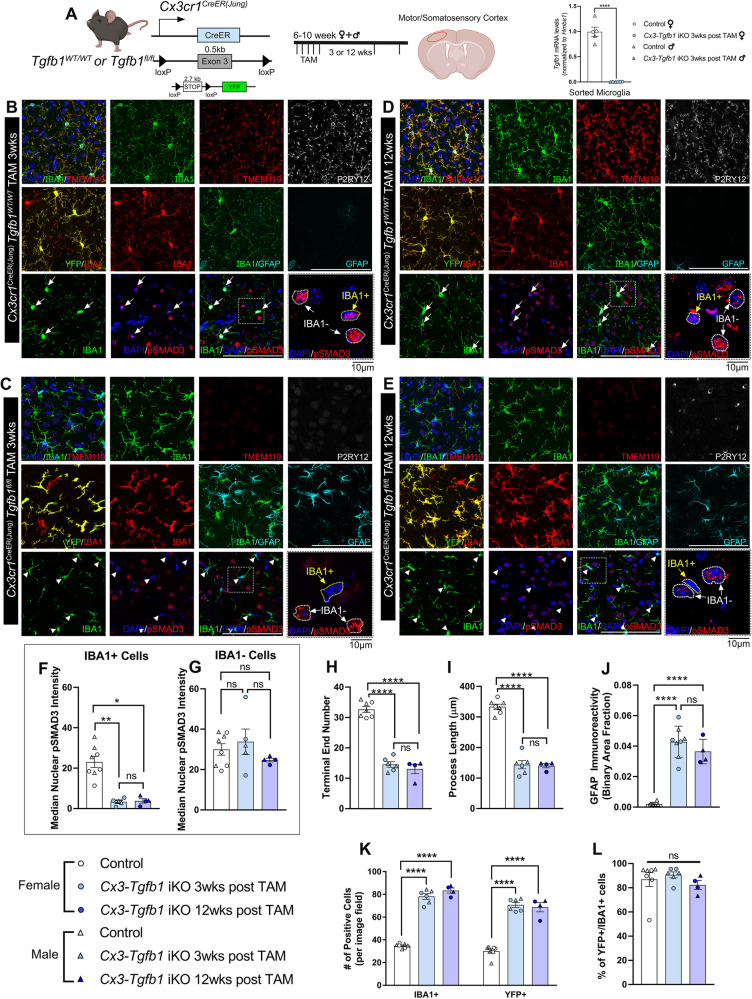
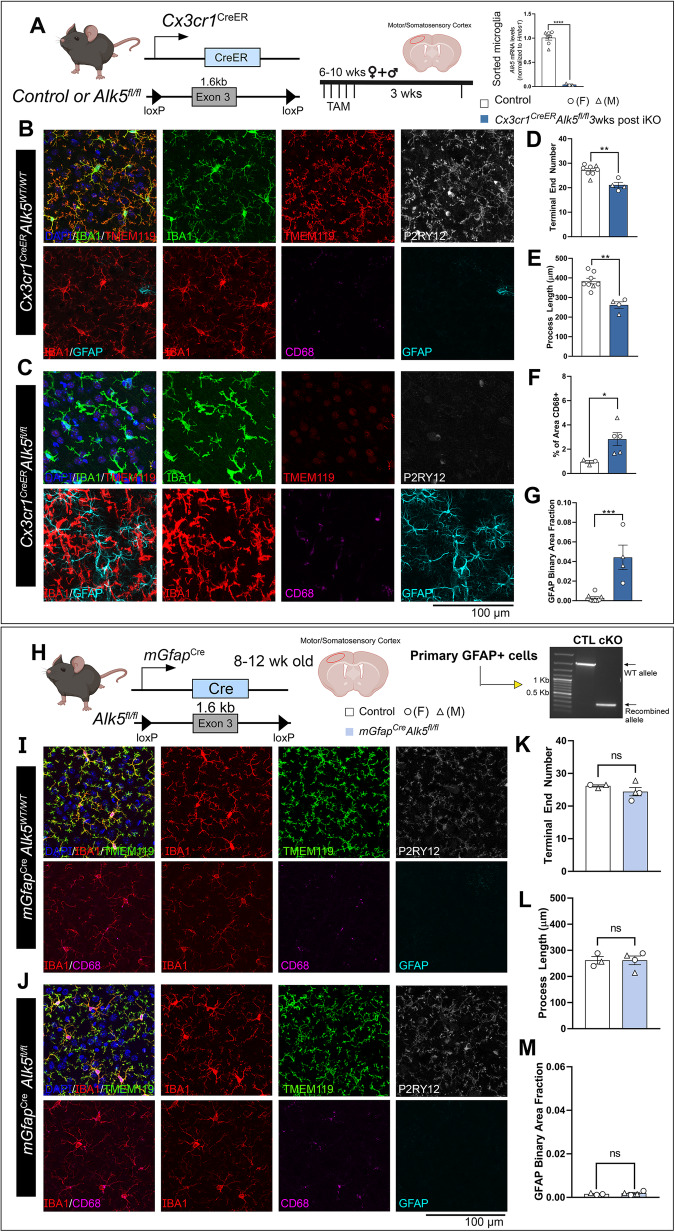
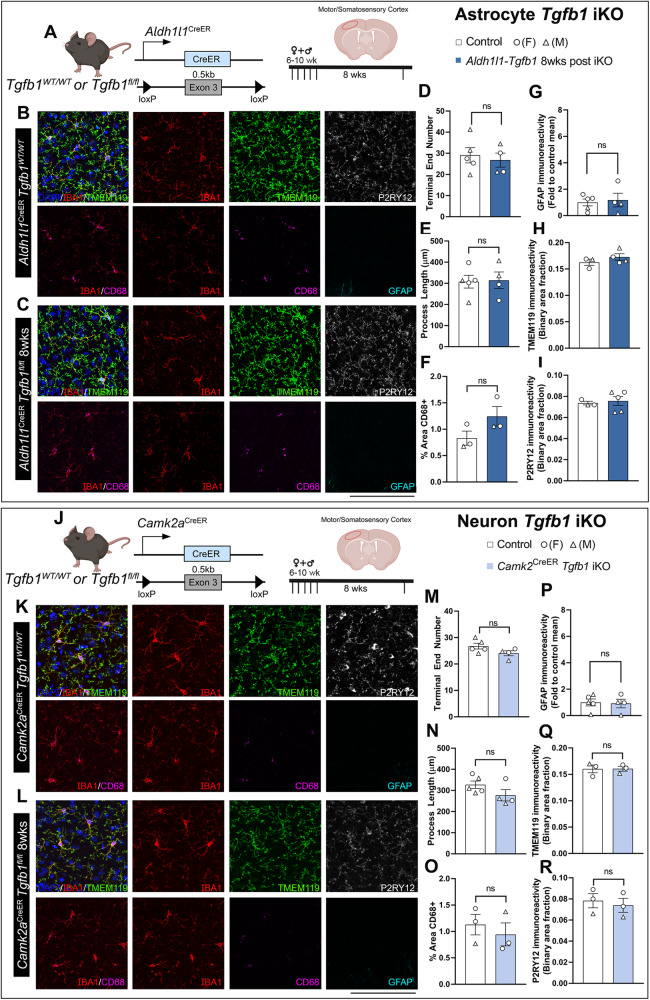
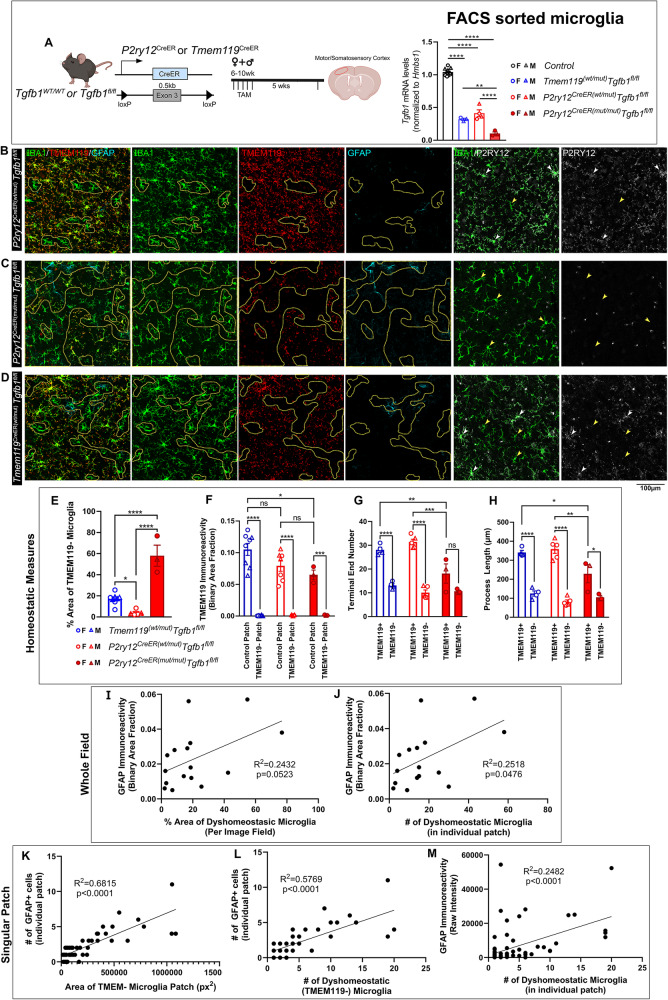
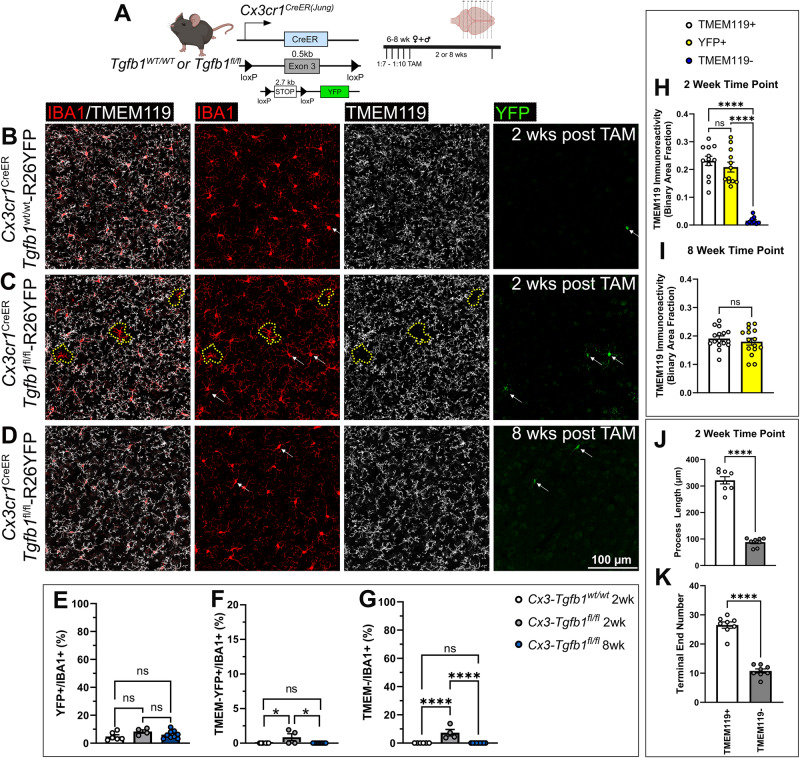
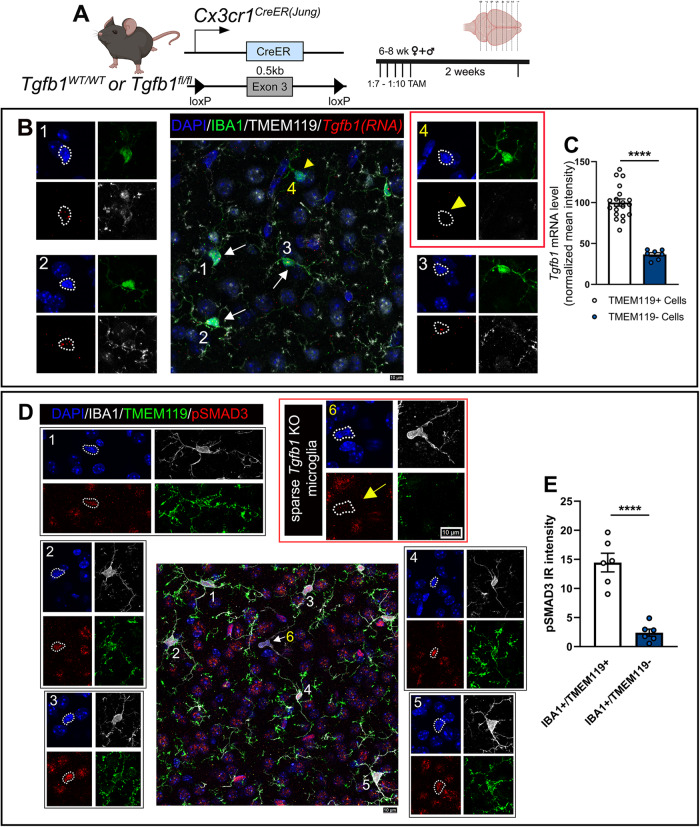
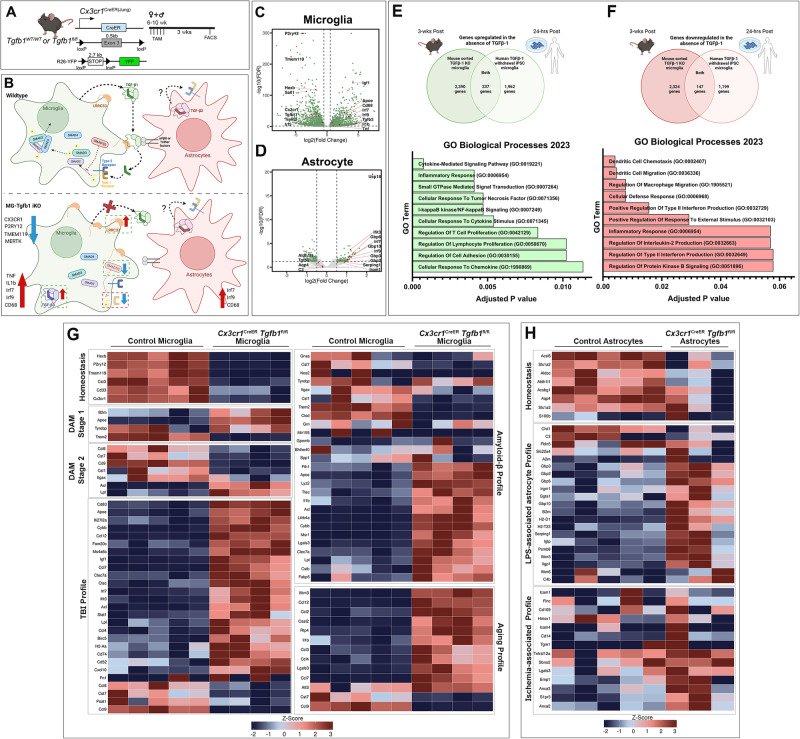
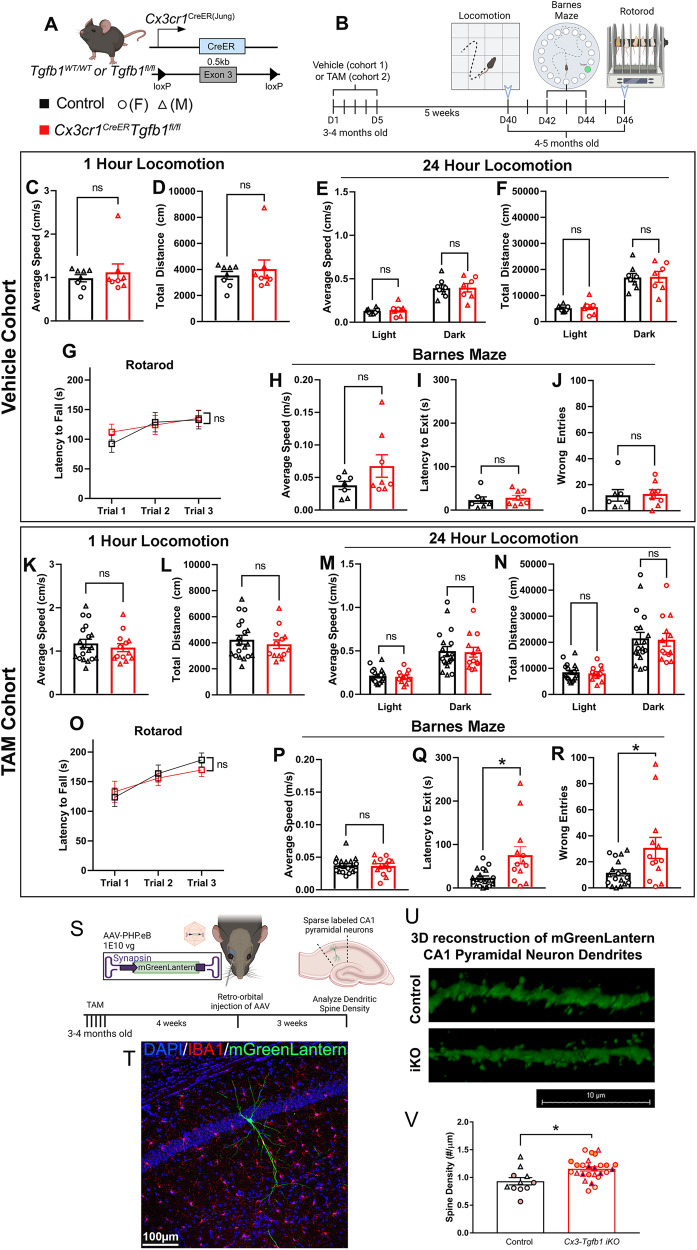
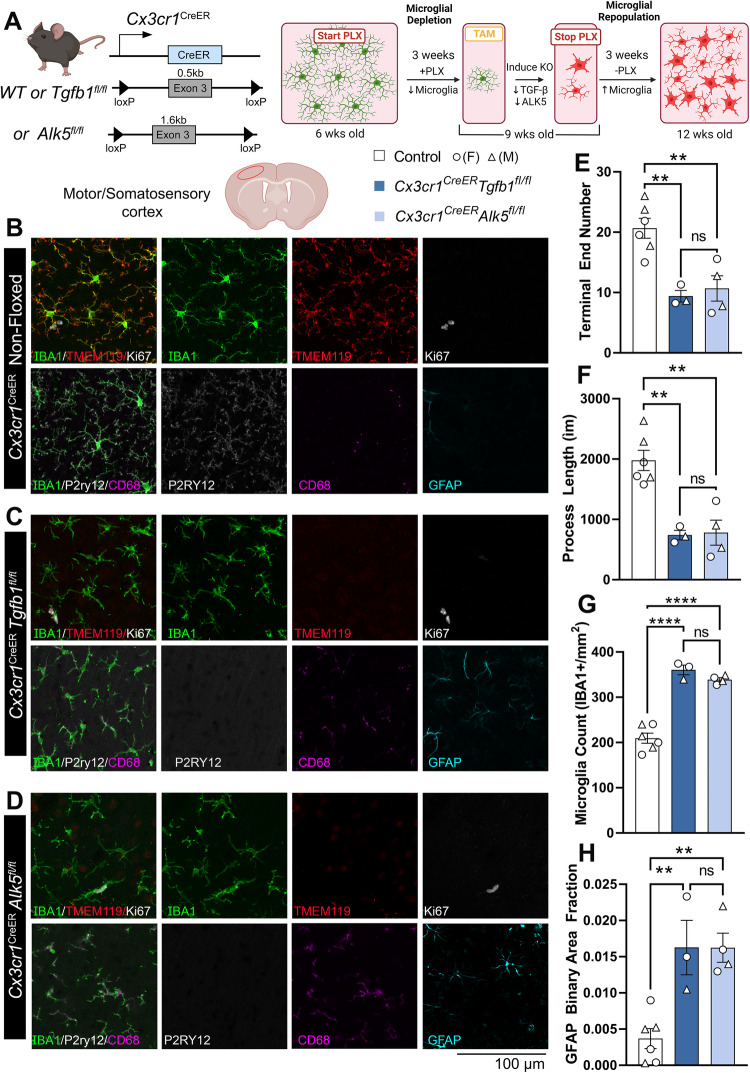
While TGF-β signaling is essential for microglial function, the cellular source of TGF-β1 ligand and its spatial regulation remains unclear in the adult CNS. Our data supports that microglia but not astrocytes or neurons are the primary producers of TGF-β1 ligands needed for microglial homeostasis. Microglia-Tgfb1 KO leads to the activation of microglia featuring a dyshomeostatic transcriptome that resembles disease-associated, injury-associated, and aged microglia, suggesting microglial self-produced TGF-β1 ligands are important in the adult CNS. Astrocytes in MG-Tgfb1 inducible (i)KO mice show a transcriptome profile that is closely aligned with an LPS-associated astrocyte profile. Additionally, using sparse mosaic single-cell microglia KO of TGF-β1 ligand we established an autocrine mechanism for signaling. Here we show that MG-Tgfb1 iKO mice present cognitive deficits, supporting that precise spatial regulation of TGF-β1 ligand derived from microglia is required for the maintenance of brain homeostasis and normal cognitive function in the adult brain.


Conflict of interest statement

The authors declare no competing interests.

Figures

Fig. 1
Fig. 1. Microglia-specific Tgfb1 gene deletion in a Cx3cr1CreER(Jung) driver line results in a loss of homeostasis of microglia and an increase in reactive astrocytes in the cortex of the adult mouse brain.
A (left) Mouse model for targeting microglial Tgfb1 and experimental timeline and (right) indicates the gene deletion efficiency in FACS-isolated microglia. BE Representative images for immunohistochemistry stained for IBA1, TMEM119, P2RY12, YFP, GFAP, and pSMAD3 in B control Cx3cr1CreER(Jung)Tgfb1wt/wt + TAM animals, C Cx3cr1CreER(Jung)Tgfb1fl/fl mice + TAM at 3 weeks after TAM administration, D control Cx3cr1CreER(Jung)Tgfb1wt/wt + TAM animals, and E Cx3cr1CreER(Jung)Tgfb1fl/fl mice + TAM at 12 weeks after TAM administration. F, G Quantification for pSMAD3 fluorescent intensity from F IBA1+ and G IBA1− cells. H, I Microglial morphological quantification of the H terminal end number, and I the summation of process lengths. J GFAP immunoreactivity quantified by binary area fraction. K total IBA1+ or YFP+ cells and L percentage of YFP+ cells among total IBA1+ cells showing no change in % of YFP+ cell even 12 weeks after induction of Tgfb1 KO. A Right (n = 5 for control and n = 6 for KO, p = 0.0004, Welch’s t-test, two-sided); F, G (n = 8 for control, n = 5 for KO 3 week and n = 4 for KO 12 week, **p = 0.006 and *p = 0.029, Kruskal–Wallis test, Dunn’s multiple comparisons test); H, I, K, L (n = 7 for control, n = 6 for KO 3 week and n = 4 for KO 12 week) and J (n = 6 for control, n = 8 for KO 3 week and n = 4 for KO 12 week). Each data point represents the average of a single animal, and the sex of each animal is indicated in the figure legend. Mean ± SE, Scale bar = 100 µm unless otherwise noted. HL One-way ANOVA, Tukey’s multiple comparisons test. *p < 0.05, **p < 0.01, ****p < 0.0001. A Left, was created with BioRender.com released under a Creative Commons Attribution-NonCommercial-NoDerivs 4.0 International license. Source data are provided as a source data file.
Fig. 2
Fig. 2. ALK5-dependent TGF-β signaling is required for the maintenance of microglial homeostasis but not for astrocytic homeostasis.
A (left) Mouse model for targeting microglial TGF-β type 1 receptor Alk5 and experimental timeline. (Right) indicates the gene deletion efficiency in FACS-isolated microglia (n = 7 control, n = 3 iKO, p < 0.0001). B, C Representative immunohistochemistry images of IBA1, TMEM119, P2RY12, CD68, and GFAP in the cortex of B control animals and C Cx3cr1CreER(Jung)Alk5fl/fl knockouts 3 weeks after TAM administration. Quantification of D microglial process terminal end numbers, E total microglial process length, (D, E n = 8 control, n = 4 iKO, p = 0.001 for (D) and p = 0.0004 for (E)), F % of CD68 immunoreactive positive area (n = 3 control, n = 5 iKO, p = 0.0396), and G GFAP immunoreactive positive area fraction (n = 8 control, n = 4 iKO, p = 0.002, Mann Whitney test, two-sided). H (left) Mouse model for targeting astrocytic Alk5 and experimental timeline. (right) Indicates the gene recombination efficiency in cultured GFAP+ primary cells isolated from control or cKO mice using a PCR primer set that flanks the entire loxP-Alk5-loxP cassette. Cells from three different cKO mice show similar results. I, J Representative immunohistochemistry images of IBA1, TMEM119, P2RY12, CD68, and GFAP in the cortex of I control animals, J mGfapCreTgfb1fl/fl constitutive knockouts at 12-weeks-old. Quantification of K microglial process terminal end numbers, L total microglial process length, and M GFAP immunoreactive positive area fraction (KM n = 3 control, n = 4 cKO). *p < 0.05, **p < 0.01, ***p < 0.001, ns = not significant. Mean ± SE, All panels are analyzed by two-sided Student’s t-test, except panel (G). (>40 Microglia were quantified for each animal and the average from one mouse was plotted as a single data point in the figure panel and treated as n = 1 for statistical analysis). Scale bar = 100 µm. A, H, Left, were created with BioRender.com and released under a creative commons attribution-noncommercial-noderivs 4.0 International license. Source data are provided as a source data file.
Fig. 3
Fig. 3. Astrocyte-specific or forebrain neuronal specific Tgfb1 gene deletion in the Aldh1l1CreER or Camk2aCreER drivers does not affect the homeostasis of microglia or GFAP expression in astrocytes in adult mouse brain (cortex).
A Astrocyte iKO mouse model and experimental timeline. B, C Representative immunohistochemistry images of cortex from TAM treated (8 weeks post) control B Aldh1l1CreERTgfb1wt/wt and C iKO Aldh1l1CreER Tgfb1fl/fl tissue showing IBA1, TMEM119, P2RY12, CD68, and GFAP immunostaining. Quantification of microglia ramification via D process terminal end numbers, E total process length, and F % of CD68+ immunoreactive area. G Quantification of astrocyte reactivity using GFAP immunoreactive positive area fraction, quantification of H TMEM119, and I P2RY12 immunoreactivity. (D, E, G, n = 5 control, n = 4 iKO) and (F, H, I, n = 3 control and n = 3, 4, and 5 for iKO). J Neuronal iKO mouse model and experimental timeline. K, L Representative images of TAM treated (8 weeks post) control Camk2aCreERTgfb1wt/wt (K) and iKO Camk2CreER Tgfb1fl/fl (L) tissue showing IBA1, TMEM119, P2RY12, CD68, and GFAP immunoreactivity. Quantification of microglia ramification via M process terminal end number, N total process length, and O CD68+ immunoreactive % area. P Quantification of astrocyte reactivity using GFAP+ immunoreactive area fraction, and quantification of Q TMEM119 and R P2RY12 immunoreactivity (M, N, P, n = 5 control and n = 4 iKO) and (O, Q, R, n = 3 for both control and iKO). Mean ± SE (>40 microglia were quantified for each animal and the average from one mouse was plotted as a single data point in the figure panel and treated as n = 1 for statistical analysis). ns = not significant. Two-sided Student’s t-test, scale bar = 100 µm. A, J Created with BioRender.com and released under a Creative Commons Attribution-NonCommercial-NoDerivs 4.0 International license. Source data are provided as a source data file.
Fig. 4
Fig. 4. Mosaic deletion of the Tgfb1 gene in subsets of parenchymal microglia in the P2ry12creERTgfb1fl/fl or the Tmem119CreERTgfb1fl/fl iKO mice leads to distinct patches of dyshomeostatic microglia in the adult mouse brain.
A (left) P2ry12CreER or Tmem119CreER mouse driver to induce Tgfb1 KO in P2RY12+ or TMEM119+ microglia and experimental timeline. A (right) Indicates the gene deletion efficiency in FACS-isolated microglia in all the different mouse lines (n = 10, 3, 4, 3 for each group presented, ****<0.0001 and **p = 0.0038). TAM treated, B P2ry12CreER(wt/mut)Tgfb1fl/fl, C P2ry12CreER(mut/mut)Tgfb1fl/fl, and D Tmem119CreER(wt/mut)Tgfb1fl/fl iKO representative images showing immunohistochemistry for IBA1, TMEM119, P2RY12, and GFAP. Yellow dotted outlines indicate microglia regions with downregulated TMEM119 expression. White arrows depict homeostatic IBA1+ cells that still express P2RY12 expression. Yellow arrowheads show IBA1+ cells that are no longer expressing P2RY12. E Quantification of % area of TMEM− regions across all three lines in the whole image field (n = 8, 5, 3 for each group presented, ****<0.0001 and *p = 0.0312, panel A, right and E are analyzed by one way ANOVA, two-sided, Tukey’s multiple comparisons). F Quantification of TMEM119 expression in P2ry12CreER(wt/mut)Tgfb1fl/fl, P2ry12CreER(mut/mut)Tgfb1fl/fl, and Tmem119CreERTgfb1fl/fl (n = 8, 7, 3 for each group presented, *p = 0.0162, ***p = 0.0008, and ****<0.0001). G, H Quantification of microglia morphology across the three different mouse lines for G terminal number and H process length (n = 4, 5, 3 for each group, *p = 0.0306 and 0.0237, **p = 0.0078 and 0.0016, ***p = 0.0002 and ****p < 0.0001. FH Analyzed by two-way ANOVA, two-sided, Tukey’s multiple comparison). I, J Correlation of total GFAP immunoreactivity vs % area or a number of dyshomeostatic microglia based on TMEM− the area from representative images across all 3 mouse lines. KM Correlations of different parameters within an individual dyshomeostatic patch comparing K number of GFAP+ cells vs % area of TMEM− microglia, L number of GFAP+ cells vs number of TMEM− dyshomeostatic microglia, and M GFAP immunoreactivity vs a number of dyshomeostatic TMEM− microglia. Mean ± SE, for correlations, a simple linear regression was used for analysis. Scale bar = 100 µm. A Left, was created with BioRender.com released under a Creative Commons Attribution-NonCommercial-NoDerivs 4.0 International license. Source data are provided as a source data file.
Fig. 5
Fig. 5. Sparse-induced knockout of the Tgfb1 gene in individual adult microglia supports an autocrine mechanism of microglial TGF-β ligand production and signaling regulation.
A Mouse model was used to induce Tgfb1 KO in mosaic sparse individual microglia and an experimental timeline depicting a titrated dose of TAM. BD Representative images showing IBA1, TMEM119, and YFP expression and co-localization in B control tissue at 2 weeks post TAM, C sparse iKO tissue at 2 weeks showing loss of TMEM119 expression in sparse individual microglia, and D absence of TMEM119−/IBA1+ parenchyma microglia in the sparse Tgfb1 iKO brain at 8 weeks post TAM. The yellow dotted outline in C highlights singular microglia showing loss of homeostatic TMEM119 expression. White arrows highlight YFP+ cells showing no loss of homeostatic TMEM119 expression. Note that at this low dosage of TAM, the recombination of individual floxed alleles (R26-YFP reporter or the floxed Tgfb1 gene) occurs independently of each other, therefore YFP+ cells could not track a sparse Tgfb1 KO microglia, consistent with our recent study. E, F Quantification of percentages of cell populations for E YFP+, F TMEM− YFP+, and G TMEM− cells out of total IBA1+ cells at 2 and 8 weeks post sparse TAM administration (for EG, n = 6, 4, and 9 for each group presented, *p = 0.0195 and 0.0123 for (F) and ****p < 0.0001, EG analyzed by one way ANOVA, two-sided, Tukey’s multiple comparison). H, I Quantification of TMEM119 expression at H 2 weeks post (n = 12, 12, and 9 for each group, ****p < 0.0001, one-way ANOVA, two-sided, Tukey’s multiple comparisons) and I 8 weeks post (n = 16 and 15 for each group, not significant) low dose TAM administration from individual TMEM+ cells, TMEM− cells, and YFP+ cells. JK Detailed morphological analysis of individual microglia in sparse iKO mice at 2 weeks post TAM characterizing J the total process length and K the total terminal end number of individual TMEM119+ or TMEM119− microglia (n = 8 for each group for J and K, ****p < 0.0001, IK analyzed by Student’s t-test, two-sided). Animals pooled from different cohorts of TAM treatment. Mean ± SE. Scale bar = 100 µm. A Created with BioRender.com and released under a Creative Commons Attribution-NonCommercial-NoDerivs 4.0 International license. Source data are provided as a source data file.
Fig. 6
Fig. 6. In situ RNA-scope and IHC double labeling confirm loss of Tgfb1 mRNA and downregulation of TGF-β downstream signaling (pSMAD3) in dyshomeostatic individual microglia in the sparse Tgfb1 iKO model.
A Mouse model was used to examine sparse iKO in microglia and the experimental timeline with TAM dosage. B Representative image showing combined immunohistochemistry staining (for IBA1, TMEM119, and DAPI) and Tgfb1 RNA-scope hybridization. (B1–3) Surrounding normal microglia showing TMEM119 expression and Tgfb1 mRNA presence. (B4) A single microglia cell with loss of TMEM119 expression and loss of Tgfb1 mRNA. White arrows were used to mark normal cells in the central panel. Yellow arrowhead is used to mark individual iKO microglia. Note that tissue treatment for RNAscope analysis makes the IHC condition less ideal for morphology evaluation than regular IHC staining, however, IBA1 and TMEM119 expression are still distinguishable for individual WT or iKO microglia. C Quantification of RNAscope signal intensity for Tgfb1 probe in TMEM119+ and TMEM119− cells (n = 20 and 7 for control and TMEM119- group, ****p < 0.0001, Welch’s t-test, two-sided). D Representative image showing co-immunohistochemical staining with DAPI, IBA1, TMEM119, and pSMAD3. (D1–5) Surrounding normal microglia showing TMEM119 expression and pSMAD3 immunostaining. (D6) A single microglia cell with loss of TMEM119 expression and loss of pSMAD3 labeling. The yellow arrow (microglia #6) marks the individual iKO microglia. E Quantification of pSMAD3 immunoreactive intensity in TMEM119+ and TMEM119− cells (n = 6 mice for each group, ****p < 0.0001, Student’s t-test, two-sided). Scale bar = 10 µm. Mean ± SE. For additional representative images see Supplementary Fig. 12. A Created with BioRender.com and released under a Creative Commons Attribution-NonCommercial-NoDerivs 4.0 International license. Source data are provided as a source data file.
Fig. 7
Fig. 7. Transcriptomic analysis of microglia and astrocyte cells sorted from Cx3cr1CreER(Jung)Tgfb1 iKO mice.
A Mouse model was used to induce Tgfb1 KO and YFP reporter in microglia. B Schematic model showing the summary of transcriptomic changes in microglia or astrocytes pertaining to both inflammatory responses and critical TGF-β signaling component genes, for individual gene list see supplemental information. C, D Volcano plot showing expression log fold changes in microglia or astrocytes comparing iKO vs Control mice. E, F Upregulated and downregulated genes common to this bulk RNA-seq data set and the sequencing results from Abud et al. (human microglia-like cells derived from iPSCs subjected to TGF-β withdrawal for 24 h) and gene ontology (GO) term analysis of overlapping genes from the two data sets. GO analysis was performed using the Enrichr online database. p Values were calculated using Fisher’s exact test, and adjustments for multiple comparisons were made using the Benjamini–Hochberg method. G Microglial differential gene expression observed across various gene sets including, homeostatic microglia genes, stage 1 and 2 disease-associated microglia (DAM) genes, injury exposed microglial (TBI), amyloid beta exposed microglia,,, and aged microglia,. H Astrocytic differential gene expression was observed across different gene sets including, homeostatic astrocyte genes, LPS-associated, and ischemia-associated astrocytic genes. Z-scores were calculated and plotted to display differential gene expression. The astrocyte sample that had an RIN < 8 was excluded from this analysis. A, B, E, and F Created with BioRender.com and released under a Creative Commons Attribution-NonCommercial-NoDerivs 4.0 International license. Source data are provided as a source data file.
Fig. 8
Fig. 8. Behavioral assessment shows normal general motor function and motor learning but defective spatial learning and memory in young adult Cx3cr1CreERTgfb1fl/fl iKO mice and increased dendritic spine density in hippocampal CA1 neurons.
A Mouse model was used to induce Tgfb1 KO in microglia. B Experimental timeline, showing the order of behavioral measurements. CJ Behavioral measurements in vehicle-treated Cx3cr1CreERTgfb1wt/wt or Cx3cr1CreERTgfb1fl/fl mice showing open field test (OFT) of the first hour in locomotion chamber C average speed and D total distance traveled. E, F Average speed and total distance during the light and dark cycles in a 23-h period. G Accelerated rotarod learning test. HJ Barnes maze test showing H average speed during testing, I latency to locating the target hole, and J number of error trails before locating the target hole (n = 8 for each group, Student’s t-test, two-sided). KR Behavioral measurements from TAM-treated control and iKO mice showing open field test (OFT) of the first hour in locomotion chamber K average speed and L total distance traveled. M, N Average speed and total distance during the light and dark cycles in a 23-h period. O Accelerated rotarod learning test. PR Barnes maze test showing P average speed during testing, Q latency to locating the target hole, and R number of error trails before locating the target hole. (control n = 19, iKO n = 13) (ns = not significant, *p = 0.0210 for panel Q, and *p = 0.0398 for panel R, Unpaired t-test with Welch’s correction, two-sided). S Experimental design and timeline for systemic AAV for neuronal labeling in MG-Tgfb1 iKO mice. T Representative image of a sparse CA1 hippocampal neuron labeled with the AAV-PHP.eB syanpsin-mGreenLantern virus. U 3D reconstruction of mGreenLantern CA1 pyramidal basal neuron dendrites from control and iKO mice. V Quantification of spine density (n = 11 control and n = 26 individual dendritic segments pooled from n = 3 control mice and n = 4 iKO mice (dendritic segments from the same animal is color coated, circle indicates female, and triangle indicates male. Statistical analysis was carried out using the average from individual mice as a single n, *p = 0.0316, Student’s t-test, two-sided). Mean ± SE. Scale bars: 10 µm or 100 µm as indicated. A, B, and S Created with BioRender.com and released under a Creative Commons Attribution-NonCommercial-NoDerivs 4.0 International license. Source data are provided as a source data file.
Fig. 9
Fig. 9. TGF-β signaling via microglia-derived TGF-β1 ligand or ALK5-dependent signaling is required for the repopulation of homeostatic microglia after PLX5622 ablation.
A Mouse model for Tgfb1 and Alk5 iKO in microglia and experimental design. B, C Representative images of B control, C Cx3cr1CreERTgfb1fl/fl, and D Cx3cr1CreERAlk5fl/fl mice showing immunostaining of IBA1, TMEM119, Ki67, P2RY12, CD68, and GFAP. Quantification of microglial morphology by E terminal end number (**p = 0.0044 and p = 0.0053) and F and process length (**p = 0.0022 and p = 0.0014). G Total microglia count (****p < 0.0001). H Quantification of astrocyte reactivity using GFAP immunoreactivity (**p = 0.0057 and p = 0.0032). EH, n = 6, 3, 4 for each group, one-way ANOVA, two-sided, Tukey’s multiple comparisons). Mean ± SE, each data point represents the average of a single animal. Scale bar = 100 µm. A Created with BioRender.com and released under a Creative Commons Attribution-NonCommercial-NoDerivs 4.0 International license. Source data are provided as a source data file.

Update of

References

    1. Paolicelli RC, et al. Synaptic pruning by microglia is necessary for normal brain development. Science. 2011;333:1456–1458. doi: 10.1126/science.1202529. - DOI - PubMed
    1. Carroll JA, Race B, Williams K, Striebel JF, Chesebro B. Innate immune responses after stimulation with toll-like receptor agonists in ex vivo microglial cultures and an in vivo model using mice with reduced microglia. J. Neuroinflammation. 2021;18:194. doi: 10.1186/s12974-021-02240-w. - DOI - PMC - PubMed
    1. Sierra A, et al. Microglia shape adult hippocampal neurogenesis through apoptosis-coupled phagocytosis. Cell Stem Cell. 2010;7:483–495. doi: 10.1016/j.stem.2010.08.014. - DOI - PMC - PubMed
    1. Nimmerjahn A, Kirchhoff F, Helmchen F. Resting microglial cells are highly dynamic surveillants of brain parenchyma in vivo. Science. 2005;308:1314–1318. doi: 10.1126/science.1110647. - DOI - PubMed
    1. Hu X, et al. Microglia/macrophage polarization dynamics reveal novel mechanism of injury expansion after focal cerebral ischemia. Stroke. 2012;43:3063–3070. doi: 10.1161/STROKEAHA.112.659656. - DOI - PubMed

Substances