. 2024 Aug;9(8):2185-2200.
doi: 10.1038/s41564-024-01751-5. Epub 2024 Jun 21.

A multi-kingdom collection of 33,804 reference genomes for the human vaginal microbiome

Affiliations

A multi-kingdom collection of 33,804 reference genomes for the human vaginal microbiome

Liansha Huang et al. Nat Microbiol. 2024 Aug.

Abstract

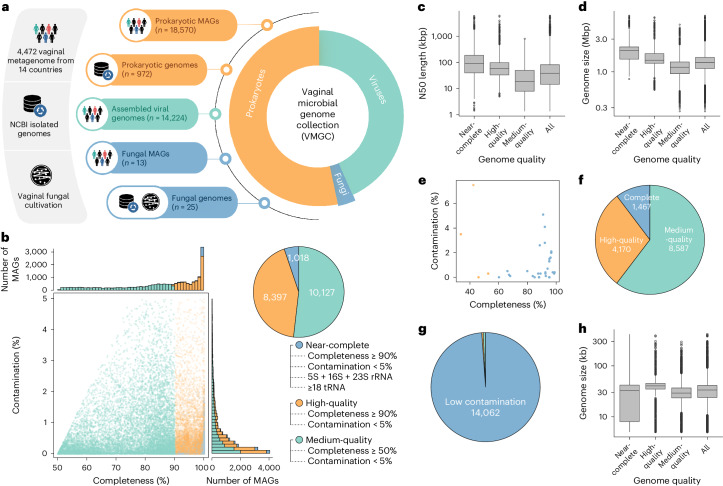
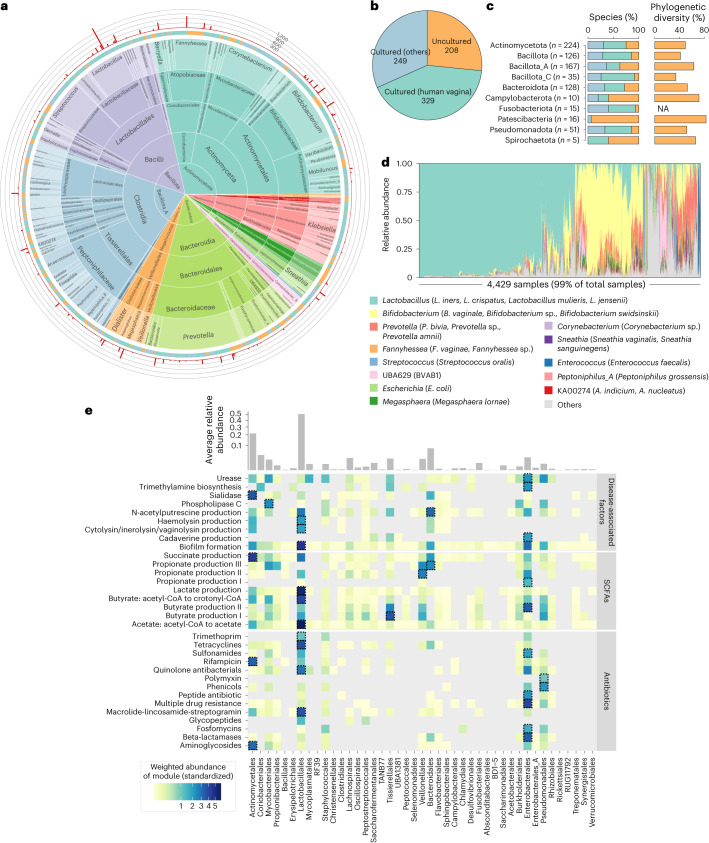
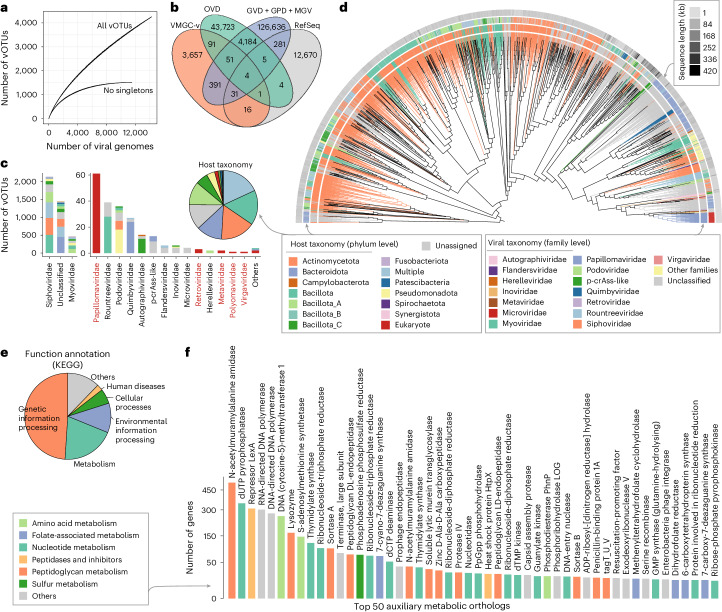
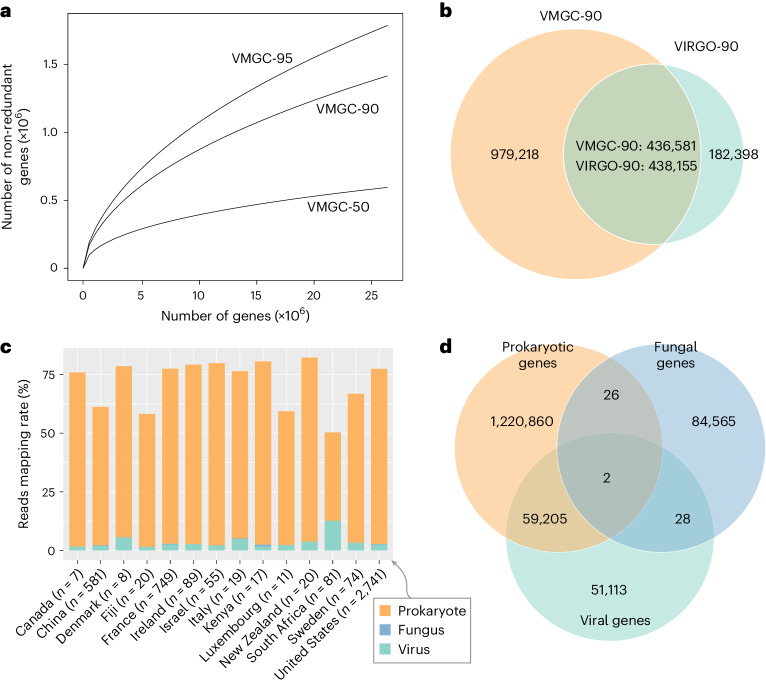
The human vagina harbours diverse microorganisms-bacteria, viruses and fungi-with profound implications for women's health. Genome-level analysis of the vaginal microbiome across multiple kingdoms remains limited. Here we utilize metagenomic sequencing data and fungal cultivation to establish the Vaginal Microbial Genome Collection (VMGC), comprising 33,804 microbial genomes spanning 786 prokaryotic species, 11 fungal species and 4,263 viral operational taxonomic units. Notably, over 25% of prokaryotic species and 85% of viral operational taxonomic units remain uncultured. This collection significantly enriches genomic diversity, especially for prevalent vaginal pathogens such as BVAB1 (an uncultured bacterial vaginosis-associated bacterium) and Amygdalobacter spp. (BVAB2 and related species). Leveraging VMGC, we characterize functional traits of prokaryotes, notably Saccharofermentanales (an underexplored yet prevalent order), along with prokaryotic and eukaryotic viruses, offering insights into their niche adaptation and potential roles in the vagina. VMGC serves as a valuable resource for studying vaginal microbiota and its impact on vaginal health.


Conflict of interest statement

The authors declare no competing interests.

Figures

Fig. 1
Fig. 1. The construction and quality assessment of the VMGC.
a, The construction flowchart of VMGC. The leftmost panels represent the sources of the genomes included in the VMGC. The middle image shows the number of prokaryotic, fungal and viral genomes. The rightmost pie chart indicates the proportions of prokaryotic, fungal and viral genomes within the VMGC. b, The CheckM2-estimated completeness and contamination of 19,542 prokaryotic genomes. The genome quality classification refers to the MAGs; we referred to the revised MIMAG standard. c,d, The distribution of the N50 length (c) and genome size (d) of 19,542 prokaryotic genomes, including 1,017 near-complete, 8,397 high-quality and 10,127 medium-quality genomes. In the boxplot, the centre line represents the median, the box limits show the upper and lower quartiles, the whiskers extend to 1.5 times the IQR, and points outside the whiskers are considered outliers. e, The BUSCO-estimated completeness and contamination of 38 fungal (blue dots) and 4 parasitic (orange dots) genomes. f,g, The CheckV-estimated completeness (f) and contamination (g) of 14,224 viral genomes. Genomes with >50% completeness are categorized as medium-quality, >90% completeness as high-quality and 100% completeness as complete. Genomes with <10% contamination are considered low-contamination. h, The distribution of the genome size for viral genomes. In the boxplot, the centre line represents the median, the box limits show the upper and lower quartiles, the whiskers extend to 1.5 times the IQR and points outside the whiskers are considered outliers. Source data
Fig. 2
Fig. 2. The 786 prokaryotic species in the VMGC.
a, Taxonomic classification of prokaryotic species. The innermost sunburst plot shows the taxonomic hierarchy of the species, with the size of the sector representing the number of species assigned to the corresponding taxon. The middle ring indicates whether the species are cultured or uncultured, along with their respective isolation sources (see Supplementary Table 6 for more details). A species is considered a cultured species if any genome clustered into the species shares >95% ANI with at least one isolate in the NCBI. The outermost bar plot shows the number of genomes clustered into each species. b, The number of uncultured species, species cultured from the vagina and species cultured from non-vaginal sites. c, The proportions of uncultured species, species cultured from the vagina and species cultured from non-vaginal sites within different phyla, as well as the proportion of phylogenetic diversity occupied by uncultured species. d, The dominated genera across 4,429 vaginal metagenomes. The species in brackets represent the dominant members of each genus. e, The weighted abundances of different functional modules for each order in vaginal samples. The upper bar plot shows the average relative abundance of each order across vaginal samples. The weighted abundances in the heat map are standardized as row Z-scores. The order with the highest weighted abundance of each functional module is indicated by a dotted box. SCFAs, short-chain fatty acids. Source data
Fig. 3
Fig. 3. Genomic characteristics of Saccharofermentanales members in the VMGC.
a, A phylogenetic tree for all species from the class Clostridia in the VMGC. The tree branches are coloured to represent different orders. The numbers on the branches represent bootstrap values, and the size of the point on the tip of each branch is positively correlated with the number of genomes clustered into the respective species. b, Completeness scores and genome sizes of genomes from three dominant members of Saccharofermentanales based on the CheckM2 algorithm. The arrows represent a single no-gapped genome available in the NCBI RefSeq database. c, Presence of USCO genes in Saccharofermentanales members. The five enzymes involved in de novo purine biosynthesis are coloured yellow. d, The prevalence of genes related to the Lsr-type autoinducer-2 (AI-2) transport system among all SGBs in the VMGC. e, Schematic diagram of the Lsr-type AI-2 transport system present in vaginal bacteria. It is noteworthy that the genes associated with LuxS and lsrG are absent in SGB009 (BVAB2) and SGB080. Source data
Fig. 4
Fig. 4. Characteristics of viral populations in the VMGC.
a, The accumulation curve of vOTUs as the number of viral genomes increases. b, The overlap of viral species among several large-scale viral genome catalogues. c, Distribution of host phyla for 4,263 vOTUs. The bar plot shows the distribution of host phyla for different viral families, with the eukaryotic viral families coloured in red, while the pie plot displays the distribution of host phyla across all vOTUs. d, Proteomic tree showing the relationships among 4,263 vOTUs. e, The functional distribution of KEGG-annotated genes for 4,263 vOTUs. f, The number of genes from the top 50 auxiliary metabolic orthologs for 4,263 vOTUs. An auxiliary metabolic ortholog was defined as a KEGG functional ortholog associated with the KEGG metabolism pathway. Source data
Fig. 5
Fig. 5. Characteristics of Papillomaviridae members in the VMGC.
a, The number of genome and HPV typing for 61 vOTUs annotated with Papillomaviridae. b, Phylogenetic tree based on the L1 proteins of all Papillomaviridae genomes in the VMGC and NCBI RefSeq database. c, Phylogenetic trees based on the genomes from HPV52 and HPV58 in the VMGC. Source data
Fig. 6
Fig. 6. Characteristics of the microbial genes in the VMGC.
a, The accumulation curve of non-redundant proteins as the number of sampled proteins increases. The VMGC-50, VMGC-90 and VMGC-95 represent catalogues with non-redundant proteins clustered at 50%, 90% and 95% amino acid similarity, respectively. b, The overlap of proteins between the VMGC-90 and VIRGO-90. The VIRGO-90 contains the non-redundant proteins that were clustered at 90% amino acid similarity from the proteins catalogue corresponding to the public human vaginal non-redundant gene catalogue (VIRGO). c, The performance of the gene catalogue corresponding to the VMGC-90 in the recruiting clean reads across vaginal samples. d, The overlap of prokaryotic, fungal and viral proteins in the VMGC-90. Source data
Extended Data Fig. 1
Extended Data Fig. 1. Supplemental figure for the construction of the VMGC.
(a) Data sources and processing workflow for the construction of the VMGC. MAG, metagenome-assembled genome. QS, quality score. CSS, clade separation score. (b) Host:virus gene ratio analysis of the viral sequences in VMGC. For each viral sequence, the ‘viral genes’ and ‘microbial host genes’ were classified by CheckV based on a database created using known virus and prokaryotic genes, and the ‘host:viral gene ratio’ was calculated to estimate the potential microbial host gene contamination for the viral sequences in VMGC. Left panel, estimated for all viruses of VMGC and compared with other existing viral databases; right panel, estimated for the proviruses and non-proviruses of VMGC. The ‘host:viral gene ratio’ for all VMGC viruses was 1:16.0 (1:33.9 for proviruses and 1:10.5 for non-proviruses), suggesting minimal potential for microbial host gene contamination within our viral collection. Source data
Extended Data Fig. 2
Extended Data Fig. 2. Summary of prokaryotic species in the VMGC.
(a) Rarefaction curves of the number of species detected as a function of the number of nonredundant genomes analyzed. Curves are depicted both for all the prokaryotic species and after excluding singleton species (represented by only one genome). (b) Phylogenetic tree for 786 prokaryotic species. The inner and outer layers depict the phylum-level taxonomic and cultivation information of the species, respectively. (c) The top 100 species with the highest number of genomes in VMGC. Upper panel, heatmap showing the geographic distribution of MAGs of the prokaryotic species. Middle panel, the number of MAGs and isolated genomes of the prokaryotic species. Bottom panel, the average relative abundance of the prokaryotic species. Source data
Extended Data Fig. 3
Extended Data Fig. 3. Summary of prokaryotic functions in the VMGC.
(a) Proportions of annotated proteins in all putative proteins from 786 prokaryotic species using different functional annotation databases. The left bar plot shows the proportion of unannotated proteins (white block), while the right bar plot displays the proportion of proteins annotated into different functional modules. (b-e) The mean weighted abundance of disease-associated functional modules in different prokaryotic species across the vaginal samples. Each bar plot presents the top 15 species with the highest abundance. The species are colored according to their order-level taxonomic classification. The results of functional modules are grouped into 4 categories: (b) biofilm formation (mainly to protect harmful bacteria), (c) sialidase (disruption of the vaginal mucosal barrier, (d) toxins (cytolysin, hemolysin) and enzymes (urease, phospholipase C) (disruption of the epithelial barrier and induction of inflammation), (e) biogenic amines (cadaverine, N-acetylputrescine, and trimethylamine) (mainly to produce unpleasant odor, elevating pH to promote the growth of harmful bacteria). Source data
Extended Data Fig. 4
Extended Data Fig. 4. Completeness of three dominated species of Saccharofermentanales.
(a) Boxplot showing the completeness of three species, estimated by BUSCO, CheckM, and CheckM2. In the boxplot, the center line represents the median, the box limits show the upper and lower quartiles, the whiskers extend to 1.5 times the interquartile range, and points outside the whiskers are considered outliers. (b) The missing proportions of 124 universal single-copy orthologs (USCOs) across the genomes of 3 species of Saccharofermentanales. Each point in the figure represents a specific USCO and is sorted based on the corresponding missing proportion. The total number of genomes within each species is shown in the bracket located in the upper right corner of the figure. (c) Phylogenetic tree of all Saccharofermentanales genomes in the VMGC and the GTDB-tk database. The inner and outer layers depict the sources and genome sizes of the species, respectively. Source data
Extended Data Fig. 5
Extended Data Fig. 5. Functional comparison among SGB009, SGB034, and SGB080 based on the KEGG annotation.
(a) The overlap of KEGG functional orthologs (KOs) among SGB009, SGB034, and SGB080. (b) The overview of KEGG metabolism pathways in SGB009, SGB034, and SGB080. The figure is generated by Interactive Pathways Explorer (iPath) v3 (https://pathways.embl.de/). The line color is consistent with the color of the numbers in Figure (a). Source data
Extended Data Fig. 6
Extended Data Fig. 6. Characteristics of fungal populations in the VMGC.
(a) Phylogenetic tree illustrating the relationship between 38 fungal genomes based on their single-copy protein markers. The orange point represents the genome derived from the metagenomic binning algorithm, the green point represents the genome recorded in the NCBI genome database, and the blue point represents the genome cultivated by this study. (b) Mapping rates of reads and prevalence rates for 11 fungal species in the vaginal mycobiome. Source data
Extended Data Fig. 7
Extended Data Fig. 7. Distribution of carbohydrate-active enzymes (CAZymes) encoded by the vOTUs.
CBM, carbohydrate-binding module; CE, carbohydrate esterase; GH, glycoside hydrolase; GT, glycosyltransferase; PL, polysaccharide lyase. Source data
Extended Data Fig. 8
Extended Data Fig. 8. Phylogenetic and compositional analysis of Papillomaviridae.
(a) Phylogenetic tree constructed based on the L1 proteins of the Papillomaviridae genomes present in the VMGC and the NCBI RefSeq database. The outer ring shows the species-level classification of Papillomaviridae genomes. The numbers located at the ends of the branches correspond to the HPV types. Genomes obtained from the NCBI RefSeq database are depicted as grey points at the tips of the branches, while genomes from the VMGC that failed to classify into a specific HPV type are represented by red triangles. (b) Viral compositional analysis of vaginal metagenomes based on VMGC. Vaginal metagenomes were downloaded from the Liu et al.’s study [1], and the compositional profiles of metagenomes were generated based on VMGC viral genomes. The comparison of HPV abundances is shown between health controls and cervical lesion patients. Boxplot showing the relative abundances of different groups. In the boxplot, the center line represents the median, the box limits show the upper and lower quartiles, the whiskers extend to 1.5 times the interquartile range, and points outside the whiskers are considered outliers. HC, health controls; HR-HPV, high-risk HPV positive without cervical lesion group; CIN, precancerous lesions with high-risk HPV group; CC, invasive cervical cancer group. Wilcoxon rank-sum test: *, q < 0.05; **, q < 0.01; ***, q < 0.001. Source data
Extended Data Fig. 9
Extended Data Fig. 9. Comparison of VMGC-90 and other vaginal gene catalogues.
(a) Source of the VIRGO-specific genes. (b) The overlap of proteins between the VMGC-90 and other vaginal microbial gene catalogues. Three non-redundant gene catalogues were constructed based on: 1) vaginal MAGs from the Pasolli et al.’s study [1] (left panel), and 2) a recently published Lactobacillus genomic catalogue that included 1,091 previously unreported isolate genomes, partial genomes, and metagenome-assembled genomes (MAGs) [2] (right panel). These gene catalogues were constructed using the same methodology and parameters as VMGC-90. (c) Mapping rate of the vaginal microbial gene catalogue across all investigated samples. (d) Boxplot showing the mapping rates of VIRGO and VMGC genes and genomes across all samples. Samples are grouped by their countries. In the boxplot, the center line represents the median, the box limits show the upper and lower quartiles, the whiskers extend to 1.5 times the interquartile range, and points outside the whiskers are considered outliers,. Source data
Extended Data Fig. 10
Extended Data Fig. 10. Comparison of VMGC-90 genes across multiple kingdoms.
(a-b) The overlap of prokaryotic and viral genes in the VMGC-90. Venn plot showing the comparisons of prokaryotic genes and genes from completeness (a) and incomplete viruses (b). Red numbers show the percentages of viral genes covered by prokaryotic genes for each comparison. (c) The KEGG annotation of all microbial genes in the VMGC. Upper panels, proportions of the annotated genes; bottle panels, pie plot showing the proportions of pathways of the annotated genes at the KEGG level B. Source data

References

    1. Martin, D. H. The microbiota of the vagina and its influence on women’s health and disease. Am. J. Med. Sci.343, 2–9 (2012). 10.1097/MAJ.0b013e31823ea228 - DOI - PMC - PubMed
    1. Anahtar, M. N., Gootenberg, D. B., Mitchell, C. M. & Kwon, D. S. Cervicovaginal microbiota and reproductive health: the virtue of simplicity. Cell Host Microbe23, 159–168 (2018). 10.1016/j.chom.2018.01.013 - DOI - PubMed
    1. Petrova, M. I., Lievens, E., Malik, S., Imholz, N. & Lebeer, S. Lactobacillus species as biomarkers and agents that can promote various aspects of vaginal health. Front. Physiol.6, 81 (2015). 10.3389/fphys.2015.00081 - DOI - PMC - PubMed
    1. Chee, W. J. Y., Chew, S. Y. & Than, L. T. L. Vaginal microbiota and the potential of Lactobacillus derivatives in maintaining vaginal health. Microb. Cell Fact.19, 203 (2020). 10.1186/s12934-020-01464-4 - DOI - PMC - PubMed
    1. Ling, Z. et al. Associations between vaginal pathogenic community and bacterial vaginosis in Chinese reproductive-age women. PLoS ONE8, e76589 (2013). 10.1371/journal.pone.0076589 - DOI - PMC - PubMed

LinkOut - more resources