. 2025 Feb;21(2):193-202.
doi: 10.1038/s41589-024-01614-4. Epub 2024 Jun 21.

Orpinolide disrupts a leukemic dependency on cholesterol transport by inhibiting OSBP

Affiliations

Orpinolide disrupts a leukemic dependency on cholesterol transport by inhibiting OSBP

Marko Cigler et al. Nat Chem Biol. 2025 Feb.

Abstract

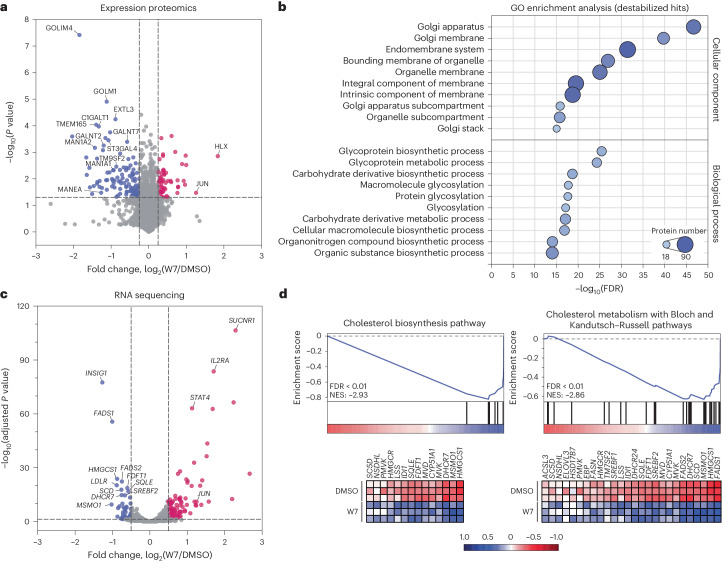
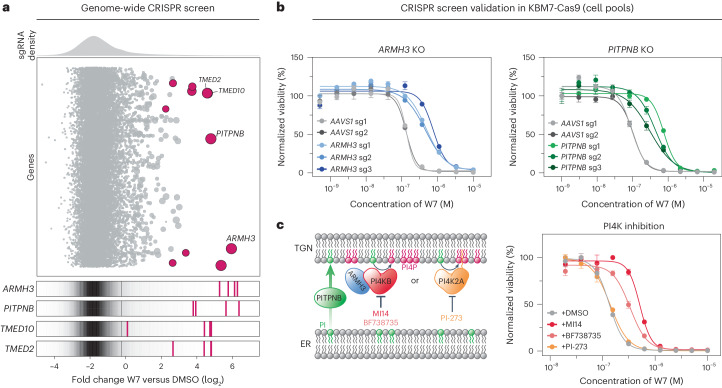
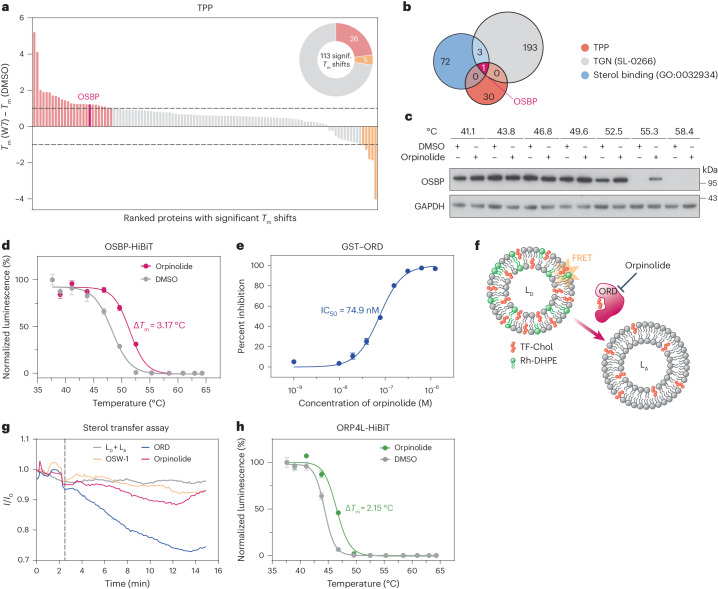
Metabolic alterations in cancer precipitate in associated dependencies that can be therapeutically exploited. To meet this goal, natural product-inspired small molecules can provide a resource of invaluable chemotypes. Here, we identify orpinolide, a synthetic withanolide analog with pronounced antileukemic properties, via orthogonal chemical screening. Through multiomics profiling and genome-scale CRISPR-Cas9 screens, we identify that orpinolide disrupts Golgi homeostasis via a mechanism that requires active phosphatidylinositol 4-phosphate signaling at the endoplasmic reticulum-Golgi membrane interface. Thermal proteome profiling and genetic validation studies reveal the oxysterol-binding protein OSBP as the direct and phenotypically relevant target of orpinolide. Collectively, these data reaffirm sterol transport as a therapeutically actionable dependency in leukemia and motivate ensuing translational investigation via the probe-like compound orpinolide.


Conflict of interest statement

Competing interests: G.E.W. and G.S.-F. are scientific founders and shareholders of Proxygen and Solgate. G.E.W. is on the Scientific Advisory Board of Nexo Therapeutics. The laboratories of G.E.W. and G.S.-F. received research funding from Pfizer. C.M.-R. is part of the Scientific Advisory Board of Nostrum Biodiscovery. The C.M.-R. lab receives research funding from Aelin Therapeutics and Almirall. The remaining authors declare no competing interests.

Figures

Fig. 1
Fig. 1. Orthogonal chemical profiling of a withanolide-inspired compound collection identifies W7.
a, Heat map depicting results of the luminescence-based cell viability screening of a 52-membered withanolide-inspired compound collection in a panel of leukemia cells treated for 72 h. Results are represented as relative area under the curve (AUC) calculated from eight-concentration-point dose–response curves. See also Supplementary Table 1. b, Chemical structures of seven derivatives (W5–W11) with pronounced cytotoxicity in most of the tested cell lines. c, Cell painting profiles of BFA and withanolides W5–W11 over 579 cellular features. Biosimilarity (Bio. sim.) values represent the similarity of phenotypic profiles, whereas induction (Ind.) values represent the fraction of significantly changed cellular features. d, UMAP analysis of the cell painting assay data highlighting the biological similarity of withanolides W5–W10 (3 μM) to BFA (3 μM) over other withanolides (3 or 10 μM). The bioactivity fingerprint of the cytotoxic analog W11 (10 μM) differs from BFA. e, Dose-resolved normalized viability of the indicated leukemia cell lines after 72 h of W7 treatment (EC50 (KBM7) = 79.7 nM; EC50 (MV4-11) = 265.3 nM; EC50 (Jurkat) = 30.7 nM; EC50 (LOUCY) = 158.5 nM; EC50 (MOLT4) = 119.5 nM). Data are mean ± s.e.m.; n = 3 independent treatments. f, Dose-resolved normalized viability after 48 h of treatment of blood-isolated PBMCs or KBM7 cells with W7 (EC50 (KBM7) = 182.7 nM). Data are mean ± s.e.m.; n = 3 independent treatments. Source data
Fig. 2
Fig. 2. W7 treatment destabilizes Golgi proteins and represses cholesterol biosynthesis.
a, Proteome-wide changes after 8 h of treatment of KBM7 cells with W7 (1 μM). The data are shown as log2-transformed fold change and −log10-transformed Benjamini–Hochberg-corrected one-way analysis of variance (ANOVA) P values compared to DMSO treatment; n = 2 biological replicates. See also Supplementary Table 2. b, Gene Ontology (GO) enrichment analysis of destabilized expression proteomic hits (highlighted in blue in a) for GO cellular components and GO biological processes. False discovery rates (FDRs; –log10-transformed) against the top ten enriched terms sorted by adjusted P value are shown. c, Changes in gene expression after 6 h of treatment of KBM7 cells with W7 (485 nM). The data are shown as log2-transformed fold change and −log10-transformed Benjamini–Hochberg-adjusted one-way ANOVA P values compared to DMSO treatment; n = 3 biological replicates. See also Supplementary Table 3. d, Gene set enrichment analysis (GSEA) of the top two WikiPathway gene sets from MSigDB significantly enriched in the differential gene expression profile of W7 against DMSO. Normalized enrichment scores (NES) and FDR are shown. Variance stabilizing transformation (VST)-normalized median-centered gene expression values of the leading edge subset of genes are depicted in the corresponding heat maps. Genes are ordered based on the metascore. Source data
Fig. 3
Fig. 3. W7 functionally depends on PI4P signaling.
a, Genome-wide CRISPR–Cas9 knockout screen in W7-treated KBM7 cells constitutively expressing Cas9 (KBM7-Cas9). The bubble plot displays median sgRNA enrichment after W7 treatment over DMSO, and the bubble size represents significance. Only genes with FDR P values of ≤0.05 are highlighted. Enrichment of sgRNAs targeting selected hits in comparison to the distribution of all sgRNAs is highlighted separately. See also Supplementary Table 4. b, Dose-resolved normalized viability after 72 h of treatment of KBM7-Cas9 cells expressing sgRNAs targeting ARMH3, PITPNB or AAVS1 with W7. Data are mean ± s.e.m.; n = 3 independent treatments; KO, knockout. c, Left, phosphatidylinositol 4-kinases PI4KB and PI4K2A contribute to the functional pool of PI4P in the Golgi. The image illustrates the CRISPR screen hits ARMH3 and PITPNB, along with small-molecule inhibitors of respective phosphatidylinositol 4-kinases. Right, dose-resolved normalized viability of KBM7 cells with W7 in the absence or presence of PI4KB inhibitors MI14 and BF738735 (both 1 μM) or PI4K2A inhibitor PI-273 (1 μM). The cells were cotreated for 72 h. Data are mean ± s.e.m.; n = 3 independent treatments. Source data
Fig. 4
Fig. 4. Orpinolide (W7) directly targets OSBP and inhibits its sterol transport function.
a, TPP. Among 113 significantly altered melting profiles, 31 hits show a ΔTm exceeding 1 °C (highlighted). See also Supplementary Table 5. b, Overlay of TPP hits with TGN-localized (UniProtKB SL-0266) and sterol-binding (GO:0032934) proteins reveals OSBP as the putative target of orpinolide. c, Orpinolide (5 μM, 2 h) stabilizes endogenous OSBP in intact KBM7 cells. Representative images of n = 3 independent measurements are shown. d, Orpinolide (1 μM, 4 h) stabilizes HiBiT-tagged OSBP in intact KBM7 cells. Data are mean ± s.e.m.; n = 3 independent experiments; n = 3 technical replicates. e, Fluorescence polarization competition assay. Orpinolide displaces 22-NDB-cholesterol from purified GST-ORD. Data are mean ± s.e.m.; n = 3 independent experiments; n = 3 technical replicates; IC50, half-maximal inhibitory concentration. f, FRET-based in vitro cholesterol transfer assay. g, Orpinolide (500 nM) disrupts the transfer of TF-Chol from the donor (LD; 16 μM) to the acceptor (LA; 16 µM) vesicles mediated by ORD (500 nM). The OSBP inhibitor OSW-1 (500 nM) was used as a positive control. Data are representative of n = 2 independent experiments. h, Orpinolide-induced (1 μM, 4 h) thermal stabilization of HiBiT-tagged ORP4L in intact KBM7 cells. Data are mean ± s.e.m.; n = 2 independent experiments; n = 3 technical replicates. Source data
Fig. 5
Fig. 5. Cellular efficacy of orpinolide arises from functional OSBP inhibition.
a, Scanning confocal microscopy analysis of the effects of orpinolide treatment (1 μM) on PC2 trafficking in RCS cells. PC2 secretion was synchronized for 4 h at 40 °C before being released by incubation at 32 °C for the indicated duration. Representative images show PC2 localization (488, green), the Golgi area (giantin, 568, purple) and the nuclei (Hoechst, blue); scale bar, 10 μm. b, Quantification of PC2 localization to the Golgi normalized to total PC2 per cell. The graph shows one point per cell from three independent experiments, with between 42 and 58 cells per condition. The data are log10-transformed and were analyzed by two-way ANOVA, with Pinteraction < 0.0001 and Ptreatment factor < 0.01. A Šídák multiple comparison test compared DMSO against orpinolide at each time point; ****P < 0.0001; NS, not significant (P = 0.4783, 30 min; P = 0.9126, 45 min). c, Top, expression levels of endogenous OSBP and V5-2HA-tagged OSBP variants (wild-type or M446W mutant) in both wild-type KBM7 cells and KBM7 cells overexpressing these fusions. Bottom, dose-resolved normalized viability after 72 h of treatment of wild-type KBM7 cells and KBM7 cells overexpressing V5-2HA-tagged OSBP variants (wild-type or M446W mutant) with orpinolide. Data are mean ± s.e.m.; n = 3 independent treatments; WT, wild type. d, CRISPR-based dropout experiment in doxycycline-inducible Cas9 KBM7 (KBM7 iCas9) cells transduced with a BFP-based dual-knockout reporter. The reporter plasmid carries a combination of sgRNAs targeting OSBP, OSBP2 or AAVS1 to yield single or dual OSBP/OSBP2 knockout. The bar plots depict relative BFP+ cells over 12 days of doxycycline treatment normalized to day 2 for each individual reporter system. Source data
Extended Data Fig. 1
Extended Data Fig. 1. Withanolide-inspired compound collection.
Structural overview of the 52-membered compound library based on the type A withanolide scaffold. The cytotoxic vinylogous uretanes W5-W11, their putative hydrolysis product W23 and the ring-fragmented product W52 are highlighted as well. SMILES representations of the compound collection are available in the Supplementary Table 1.
Extended Data Fig. 2
Extended Data Fig. 2. Phenotypic profiling of the withanolide-inspired compound collection in leukemia cells.
(a-g) Representative dose response curves for seven cytotoxic vinylogous urethans (W5-W11) as well as their (h) putative hydrolysis product (W23) and (i) the ring-fragmented product (W52). Mean ± s.e.m.; n = 3 independent treatments. Source data
Extended Data Fig. 3
Extended Data Fig. 3. Cell viability profiling of W7 in additional non-malignant and non-leukemic cell lines.
(a) Overview of the luminescence-based cell viability screening results for W7 across a panel of 30 different cell lines. The results are represented as area under the curve (A.U.C.), calculated from 10-concentration-point dose-response curves. The cells were exposed to the drug for 72 hours, with the exception of PBMCs, which had a 48-hour treatment period. (b-i) Dose-resolved, normalized viability of non-malignant (b), blood cancer (c), bone cancer (d), cervical/prostate adenocarcinoma (e), colorectal adenocarcinoma (f), pancreatic adenocarcinoma (g), lung cancer (h) and other cancer cells (i) after 72 h of W7 treatment. Mean ± s.e.m.; n = 3 independent treatments. Source data
Extended Data Fig. 4
Extended Data Fig. 4. W7 induces global destabilization of Golgi-related proteins.
(a) Subcellular localization distribution of protein hits with significantly altered abundances. Proteins were categorized based on the information from The Human Protein Atlas and UniProtKB. (b) Distribution of direct PPIs reported in the BioGRID database among the 172 regulated proteins reported in the BioGRID database. (c) Protein-protein interaction (PPI) network of proteins whose abundances were significantly altered upon W7 treatment. The physical interactions were derived from the BioGRID interaction database. See Supplementary Methods for further information. (d) Time-dependent GOLIM4 destabilization induced by W7 treatment (1 μM) in KBM7 cells. Representative images of n = 2 independent measurements. Source data
Extended Data Fig. 5
Extended Data Fig. 5. Genome-wide CRISPR/Cas9 resistance screen.
(a) Accumulated cell growth curve of KBM7-Cas9 treated with DMSO or W7 over 20 days. (b) Dose-resolved, normalized viability after 72 h treatment of KBM7-Cas9 cells expressing sgRNAs targeting ARMH3 (blue), PITPNB (green) or AAVS1 locus (grey) with 25-OHC. Mean ± s.e.m.; n = 3 independent treatments. (c) PITPNB protein levels in KBM7 pools expressing three different sgRNAs against the gene. Representative images of n = 2 independent measurements. Source data
Extended Data Fig. 6
Extended Data Fig. 6. Thermal proteome profiling.
(a) Overview of the experimental setup. Drug/vehicle treatment and 8-temperature destabilization were performed in biological duplicates. Significant shifts in drug-induced melting profiles were identified with NPARC. (b) Distribution of TPP data after scaling each protein to the abundance signal in the lowest temperature condition (37 °C), shown for individual W7/DMSO-treated replicates (n = 2, biological replicates). The solid line in the box plots represents the median, box limits show the interquartile range (IQR) and its whiskers 1.5 x IQR. Outliers are represented as block dots. (c) Overview of TPP results represented as fraction of proteins in respect to individual analysis steps. (d) Melting profiles for the W7 hit OSBP, detected by NPARC (adj. P-value = 0.00496; n = 2, biological replicates). Source data
Extended Data Fig. 7
Extended Data Fig. 7. Oxysterol-binding protein OSBP is a putative target of orpinolide (W7).
(a) Top: Dose-dependent stabilization of HiBiT-tagged OSBP at 52 °C in intact KBM7 cells (4 h treatment). n = 2 technical replicates; representative of n = 2 independent experiments. Bottom: Endogenous OSBP levels in KBM7 after dose-resolved orpinolide treatment and thermal destabilization at 52 °C. Representative image of n = 2 independent measurements. (b) Orpinolide (5 μM, 2 h) does not thermally stabilize HiBiT-tagged RAB33A (up) or TM9SF4 (down) in intact KBM7 cells. Mean ± s.e.m.; n = 3 technical replicates; representative of n = 3 independent experiments. (c) Orpinolide (5 μM, 2 h) does not thermally stabilize endogenous GALNT2 in intact KBM7 cells. Representative images of n = 3 independent measurements. (d) Fluorescence polarization competition assay measuring the displacement of 22-NDB-cholesterol from purified GST-OSBP(ORD), Aster-A/B/C and STARD1 upon orpinolide treatment (1 μM). n = 2 independent measurements. (e) Expression levels of HiBiT-tagged ORPs in KBM7 cells. Mean ± s.e.m.; n = 3 independent measurements. (f) Orpinolide (1 μM, 4 h) does not thermally stabilize HiBiT-tagged ORP1, ORP2, ORP9 or ORP11 in intact KBM7 cells. Mean ± s.e.m.; n = 3 technical replicates; representative of n = 2 independent experiments. (g) Effect of orpinolide treatment (1 μM) on OSBP protein levels in KBM7 cells. Representative image of n = 2 independent measurements. Source data
Extended Data Fig. 8
Extended Data Fig. 8. Orpinolide-induced OSBP inhibition triggers alterations in the morphology and functionality of the Golgi apparatus.
(a, b) Scanning confocal microscopy analysis of the effects of orpinolide treatment on OSBP localization and trans-Golgi morphology in HeLa cells. Cells were treated with orpinolide (100 nM or 1 μM) or DMSO for 4 h (a) or 8 h (b) and immunostained with antibodies against OSBP (488, green) and TGN46 (568, purple) while the nuclei were labelled with Hoechst (blue). The scale bar is 10 μm. Dotted line indicates cell outline. (c, d) Quantification of OSBP localization to the Golgi as identified by TGN46 (left) and trans-Golgi fragmentation measured by number of TGN46 spots per cell (right) after 4 h (c) and 8 h (d) orpinolide treatment. OSBP fluorescence intensity was measured in TGN46 region of interest (ROI) and normalized to total cellular OSBP. The graphs show one point per cell from at least 2 independent experiments for a total of 44 (DMSO; n = 3), 31 (100 nM orpinolide; n = 2) and 48 cells (1 μM orpinolide; n = 3) (c); 47 (DMSO; n = 3), 33 (100 nM orpinolide; n = 2) and 46 cells (1 μM orpinolide; n = 3) (d). Line indicates mean. One-way ANOVA was performed on log10 transformed data (see Supplementary Fig. 2a); P < 0.0001 with Dunnett’s multiple comparisons test; n.s. P = 0.8432 (c); n.s. P = 0.7773 (d). Source data
Extended Data Fig. 9
Extended Data Fig. 9. Genetic dependencies of cancers on OSBP and OSBP2.
(a) Dose-resolved, normalized viability after 72 h treatment of wild type KBM7 cells and KBM7 cells overexpressing V5-2HA-tagged OSBP variants (wild type or M446W mutant) with OSW-1 (top) or paclitaxel (bottom). Mean ± s.e.m.; n = 3 independent treatments. (b) Comparison of the sensitivity of various cancer cell lines to orpinolide with the expression levels of OSBP and OSBP2 (DepMap 23Q2). The compound sensitivity is represented as area under the curve (A.U.C.) calculated from 10-concentration-point dose-response curves after 72 h drug treatment (see Extended Data Fig. 3). (c) Top: Distribution of OSBP and ORP4 (OSBP2) deletion effects across 1078 cancer cell lines from the DepMap 22Q4 CRISPR data. Bottom: Distribution of OSBP and ORP4 (OSBP2) deletion effects across myeloid and lymphoid cancer cell lines from the DepMap 22Q4 CRISPR data. Wilcoxon matched-pairs signed ranked test was performed on the data. Source data
Extended Data Fig. 10
Extended Data Fig. 10. Functional inhibition of OSBP underlies the cellular efficacy of orpinolide.
(a) CRISPR-based dropout screen in Jurkat cells constitutively expressing Cas9, transduced with a BFP-based dual knockout reporter. The reporter plasmid carries a combination of sgRNAs targeting OSBP, OSBP2 or AAVS1 locus to yield single or dual OSBP/ORP4 knockout. The bar plots depict relative BFP+ cells over 18 days, normalized to day 3 post transduction for each individual reporter system. (b) Top: Effect of orpinolide treatment (5 μM) on p-Akt and Akt protein levels in Jurkat and LOUCY cells. Phosphoinositide 3-kinase (PI3K) inhibitor taselisib (0.5 μM, 8 h treatment) was used as a positive control. Representative image of n = 3 independent experiments. Bottom: Quantification of the relative p-Akt/Akt protein levels normalized to the DMSO controls. Mean ± SD; n = 3 independent experiments. (c) Left: Effect of orpinolide treatment (5 μM) on p-Akt and Akt protein levels in Jurkat cells at different time points. Representative image of n = 3 independent experiments. Right: Quantification of the relative p-Akt/Akt protein levels normalized to the DMSO controls. Mean ± SD; n = 3 independent experiments. Source data

References

    1. Hanahan, D. & Weinberg, R. A. Hallmarks of cancer: the next generation. Cell144, 646–674 (2011). - PubMed
    1. Pavlova, N. N. & Thompson, C. B. The emerging hallmarks of cancer metabolism. Cell Metab.23, 27–47 (2016). - PMC - PubMed
    1. Wang, Y. et al. Rapid diagnosis and prognosis of de novo acute myeloid leukemia by serum metabonomic analysis. J. Proteome Res.12, 4393–4401 (2013). - PubMed
    1. Musharraf, S. G., Siddiqui, A. J., Shamsi, T., Choudhary, M. I. & Rahman, A. U. Serum metabonomics of acute leukemia using nuclear magnetic resonance spectroscopy. Sci. Rep.6, 30693 (2016). - PMC - PubMed
    1. Newman, D. J. & Cragg, G. M. Natural products as sources of new drugs over the nearly four decades from 01/1981 to 09/2019. J. Nat. Prod.83, 770–803 (2020). - PubMed

Publication types

MeSH terms