

Anakinra in Sanfilippo syndrome: a phase 1/2 trial
- PMID: 38907160
- PMCID: PMC11405265
- DOI: 10.1038/s41591-024-03079-3
Anakinra in Sanfilippo syndrome: a phase 1/2 trial
Erratum in
-
Author Correction: Anakinra in Sanfilippo syndrome: a phase 1/2 trial.Nat Med. 2024 Sep;30(9):2693. doi: 10.1038/s41591-024-03207-z. Nat Med. 2024. PMID: 39075282 Free PMC article. No abstract available.
Abstract
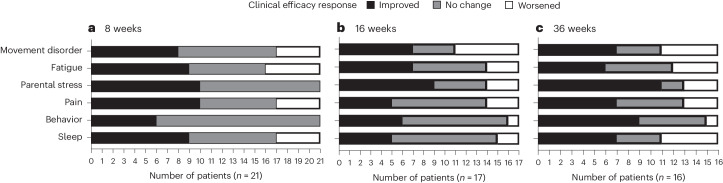
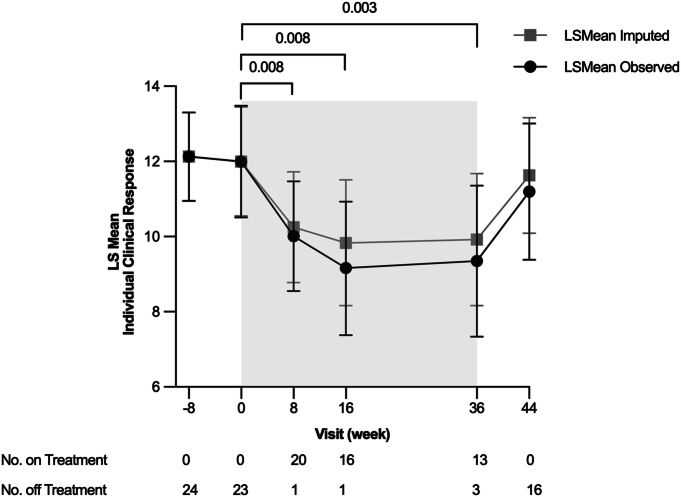
Sanfilippo syndrome is a fatal childhood neurodegenerative disorder involving neuroinflammation among multiple pathologies. We hypothesized that anakinra, a recombinant interleukin-1 receptor antagonist, could improve neurobehavioral and functional symptoms owing to its capacity to treat neuroinflammation. This phase 1/2 trial aimed to test the safety, tolerability and effects of anakinra on neurobehavioral, functional and quality-of-life outcomes in patients and their caregivers. The primary outcome was the percent of participants requiring a dose increase at week 8 or week 16. Secondary efficacy outcomes included a multi-domain responder index (MDRI). Twenty-three participants (6-26 years of age) were enrolled. Twenty continued treatment to week 8, and 15 (75%) required an increased dose at week 8 or week 16. There was an improvement in at least one domain in the MDRI in 18 of 21 (86%) at week 8 and in 15 of 16 (94%) at week 36. Seven participants withdrew (intolerability of daily injections and lost to follow-up) before week 36. Adverse events occurred in 22 of 23 (96%) participants, most commonly mild injection site reactions. No serious adverse events were related to anakinra. In conclusion, anakinra was safe and associated with improved neurobehavioral and functional outcomes, supporting continued investigation of anakinra in Sanfilippo syndrome and other mucopolysaccharidoses. ClinicalTrials.gov identifier: NCT04018755 .
© 2024. The Author(s).
Conflict of interest statement
L.E.P. has research grants/contracts with BioMarin and Takeda; is a consultant for BioMarin, Lysogene and Denali Therapeutics; participated on a data safety monitoring board or advisory board for RegenxBio and Sangamo; and has received honoraria from BioMarin. A.H.C. has a research grant/contract with Takeda. J.A. and G.B. have research grants/contracts from the Cure Sanfilippo Foundation. C.O. is an employee of the Cure Sanfilippo Foundation, a non-profit organization; has served as a consultant for Denali Therapeutics, JCR Pharmaceuticals and Lysogene; and participated on a data safety monitoring board or advisory board for BioMarin, Lysogene and Ultragenyx. J.B.E. has research grants/contracts with Orchard Therapeutics, Prevail and Lysogene; received consulting fees from Denali Therapeutics, JCR Pharmaceuticals, Novel Pharma, Orchard Therapeutics, Regenxbio, Sanofi Genzyme, Sumitomo Pharma Co., Ltd. and Takeda; and received honoraria from Takeda. The remaining authors declare no competing interests.
Figures


Similar articles
-
Safety and Efficacy of Anakinra in Severe Hidradenitis Suppurativa: A Randomized Clinical Trial.JAMA Dermatol. 2016 Jan;152(1):52-59. doi: 10.1001/jamadermatol.2015.3903. JAMA Dermatol. 2016. PMID: 26579854 Clinical Trial.
-
Treatment of severely ill COVID-19 patients with anti-interleukin drugs (COV-AID): A structured summary of a study protocol for a randomised controlled trial.Trials. 2020 Jun 3;21(1):468. doi: 10.1186/s13063-020-04453-5. Trials. 2020. PMID: 32493441 Free PMC article.
-
Long-term safety and maintenance of clinical improvement following treatment with anakinra (recombinant human interleukin-1 receptor antagonist) in patients with rheumatoid arthritis: extension phase of a randomized, double-blind, placebo-controlled trial.Arthritis Rheum. 2002 Nov;46(11):2838-46. doi: 10.1002/art.10578. Arthritis Rheum. 2002. PMID: 12428223 Clinical Trial.
-
Interventions for reducing inflammation in familial Mediterranean fever.Cochrane Database Syst Rev. 2018 Oct 19;10(10):CD010893. doi: 10.1002/14651858.CD010893.pub3. Cochrane Database Syst Rev. 2018. Update in: Cochrane Database Syst Rev. 2022 Mar 29;3:CD010893. doi: 10.1002/14651858.CD010893.pub4. PMID: 30338514 Free PMC article. Updated.
-
Towards a Treatment for Neuroinflammation in Epilepsy: Interleukin-1 Receptor Antagonist, Anakinra, as a Potential Treatment in Intractable Epilepsy.Int J Mol Sci. 2021 Jun 11;22(12):6282. doi: 10.3390/ijms22126282. Int J Mol Sci. 2021. PMID: 34208064 Free PMC article. Review.
Cited by
-
Anti-amyloid treatment is broadly effective in neuronopathic mucopolysaccharidoses and synergizes with gene therapy in MPS-IIIA.Mol Ther. 2024 Nov 6;32(11):4108-4121. doi: 10.1016/j.ymthe.2024.09.030. Epub 2024 Sep 28. Mol Ther. 2024. PMID: 39342429 Free PMC article.
-
Development of a novel tool for individual treatment trials in mucopolysaccharidosis.J Inherit Metab Dis. 2025 Jan;48(1):e12816. doi: 10.1002/jimd.12816. Epub 2024 Nov 21. J Inherit Metab Dis. 2025. PMID: 39572375 Free PMC article.
References
-
- Neufeld, E. & Muenzer, J. The mucopolysaccharidoses. In The Metabolic and Molecular Basis of Inherited Disease (eds Scriver, C. R., Beaudet, A. L., Sly, W. S. & Valle, D.) 3421–3452 (McGraw-Hill, 2001).
