. 2024 Jun 21;21(10):916-933.
doi: 10.20892/j.issn.2095-3941.2024.0112.

Amplifying colorectal cancer progression: impact of a PDIA4/SP1 positive feedback loop by circPDIA4 sponging miR-9-5p

Affiliations

Amplifying colorectal cancer progression: impact of a PDIA4/SP1 positive feedback loop by circPDIA4 sponging miR-9-5p

Yan Zhuang et al. Cancer Biol Med. .

Abstract

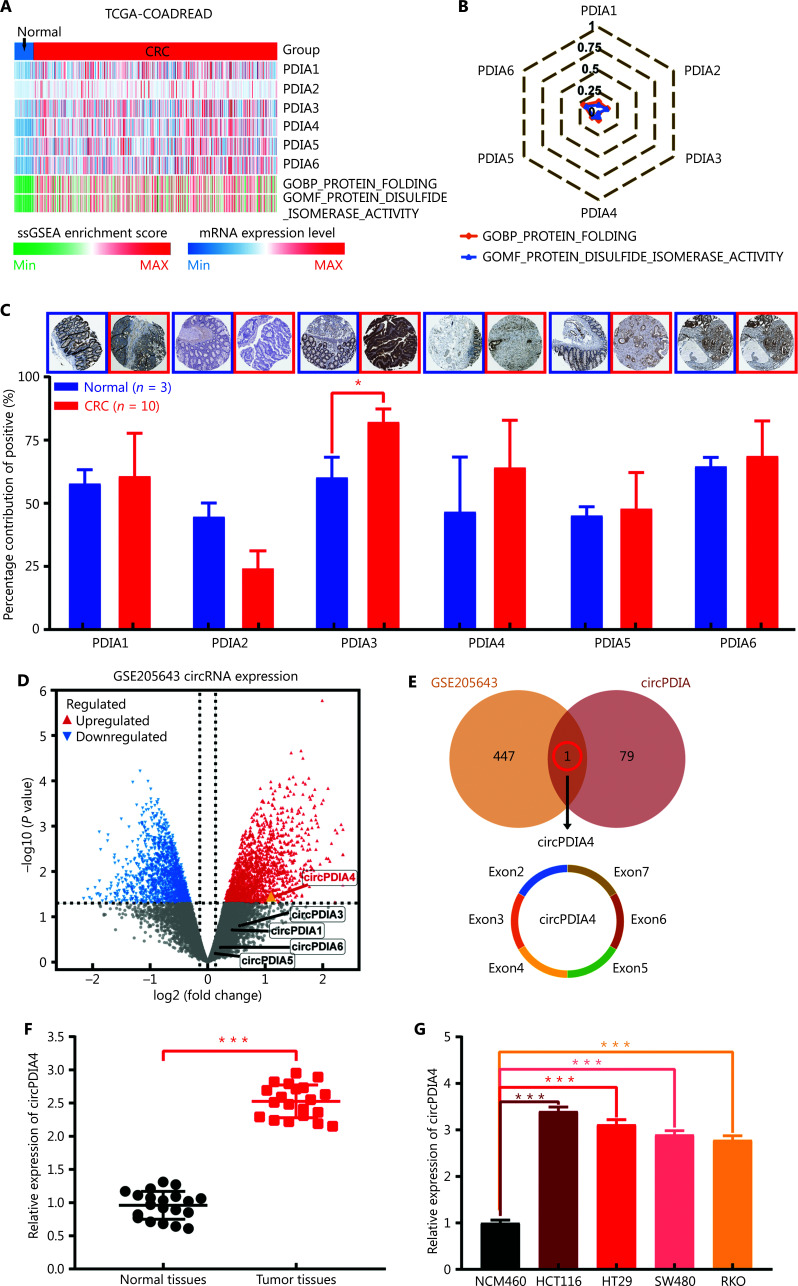
Objective: Colorectal cancer (CRC) is a prevalent malignant tumor with a high fatality rate. CircPDIA4 has been shown to have a vital role in cancer development by acting as a facilitator. Nevertheless, the impact of the circPDIA4/miR-9-5p/SP1 axis on development of CRC has not been studied.

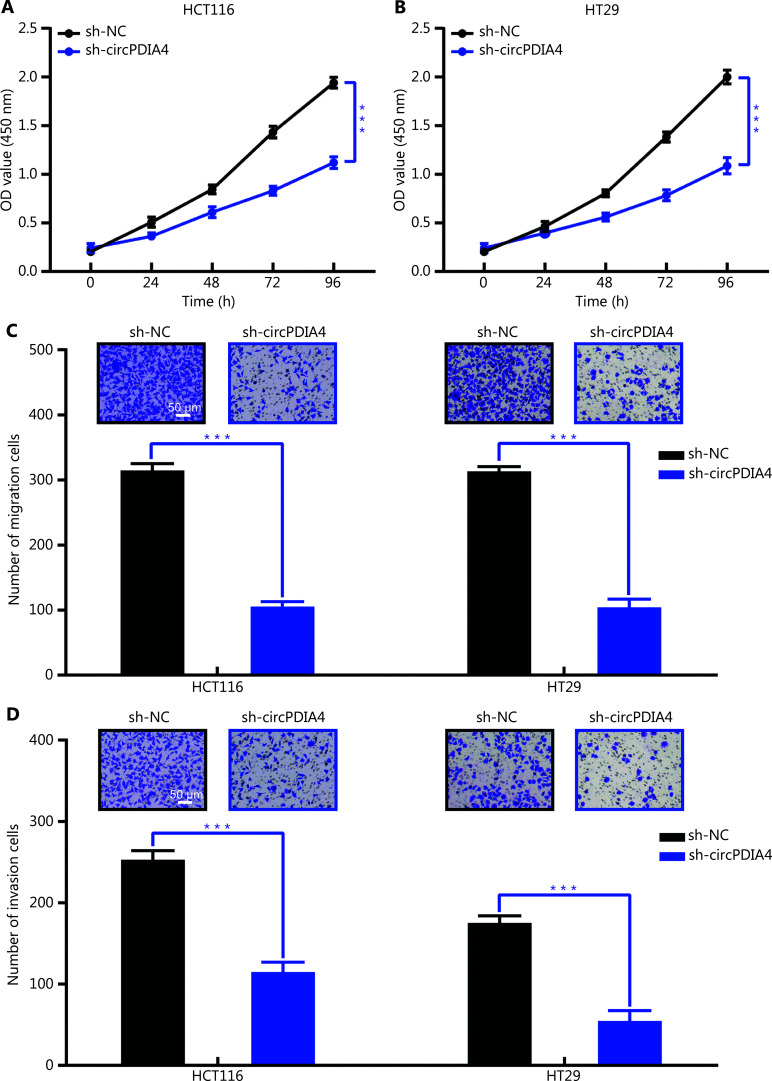
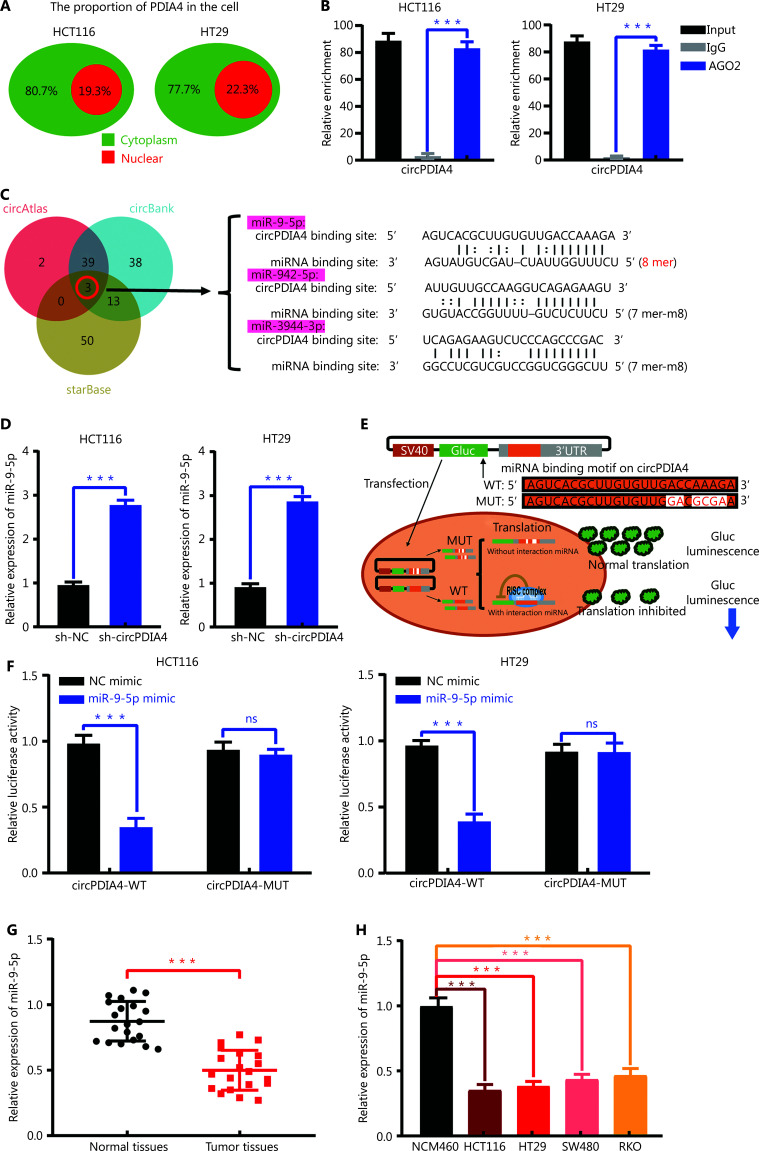
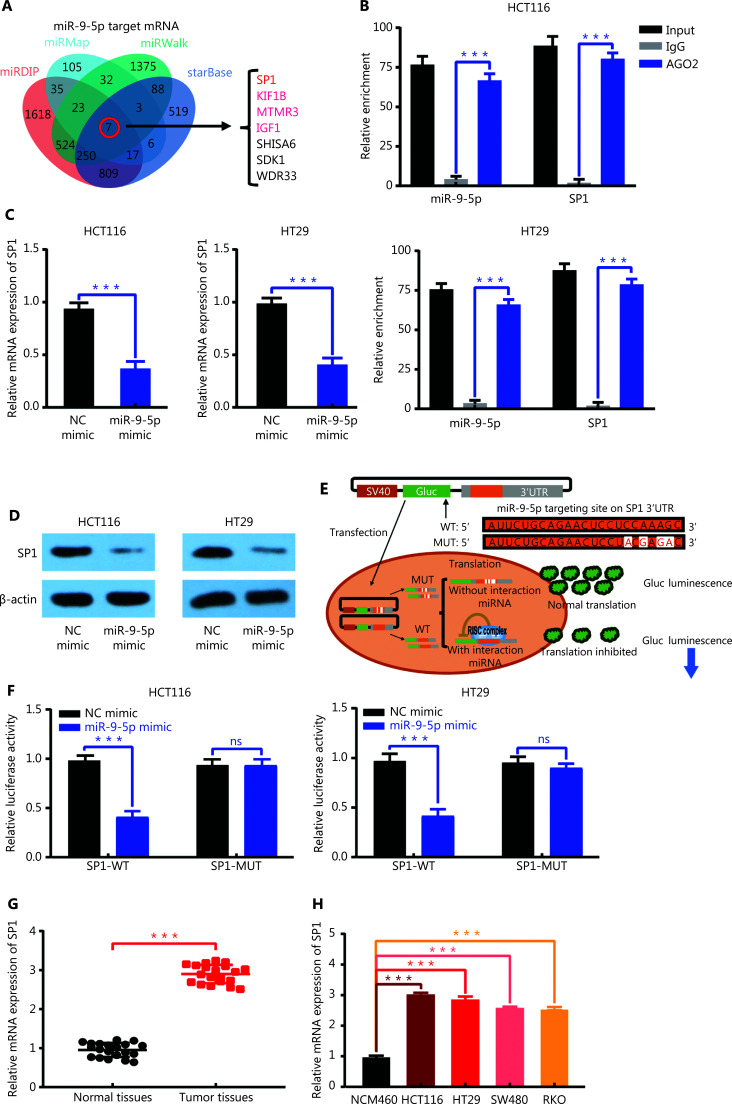
Methods: Western blot, immunohistochemistry, and reverse transcription-quantitative polymerase chain reaction assays were used to analyze gene expression. The CCK-8 assay was used to assess cell growth. The Transwell assay was used to detect invasion and migration of cells. The luciferase reporter and RNA immunoprecipitation tests were used to determine if miR-9-5p and circPDIA4 (or SP1) bind to one another. An in vivo assay was used to measure tumor growth.

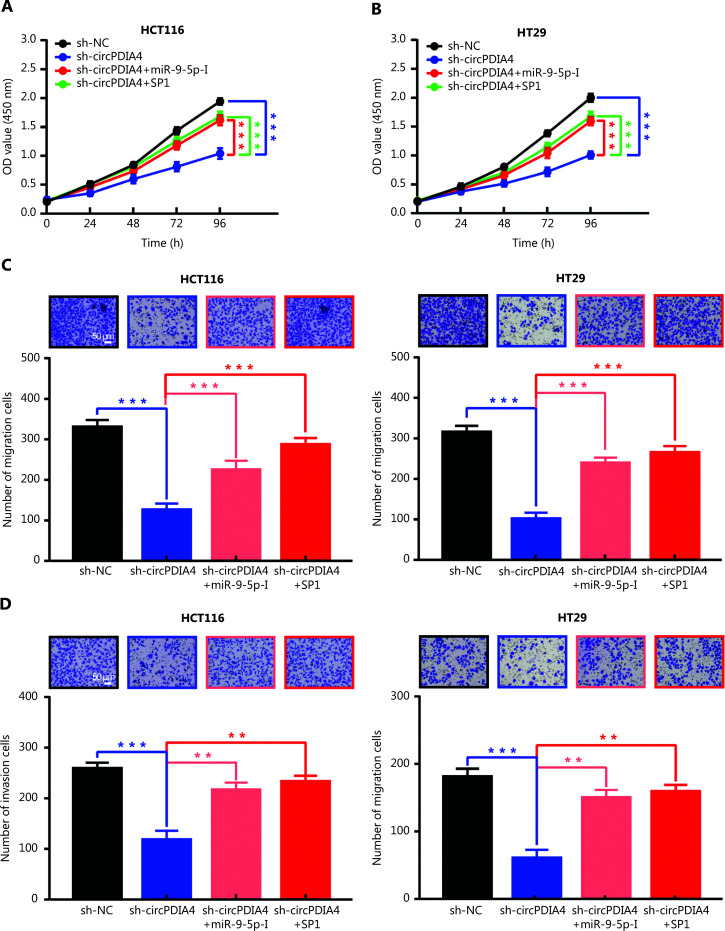
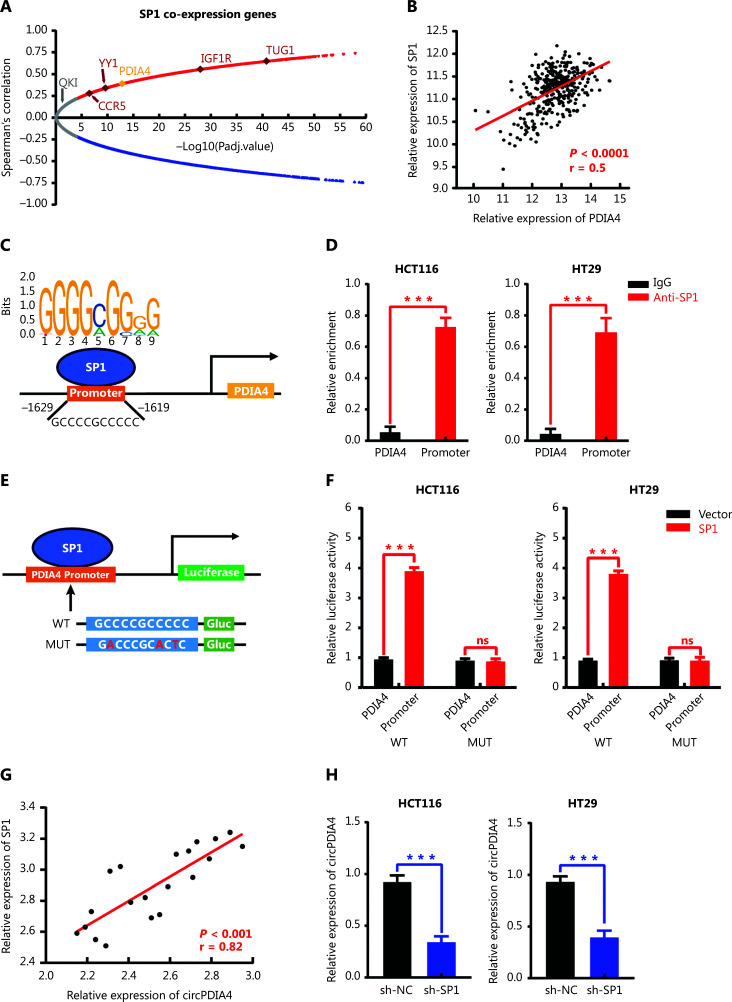
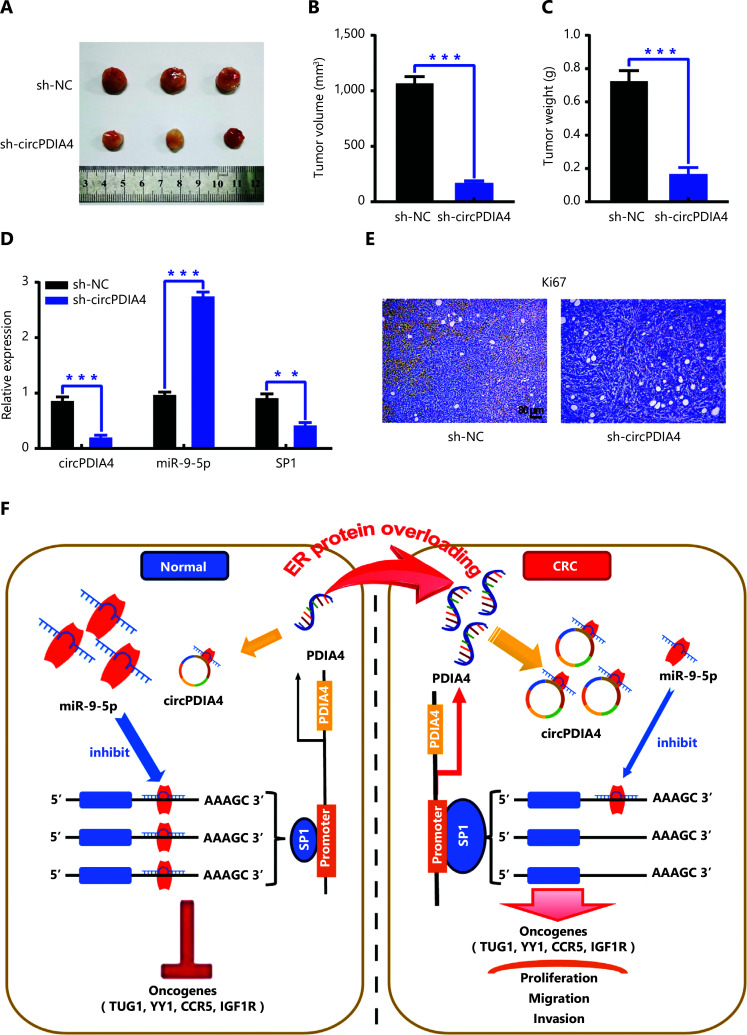
Results: It was shown that circPDIA4 expression was greater in CRC cell lines and tissues than healthy cell lines and tissues. CircPDIA4 knockdown prevented the invasion, migration, and proliferation of cells in CRC. Additionally, the combination of circPDIA4 and miR-9-5p was confirmed, as well as miR-9-5p binding to SP1. Rescue experiments also showed that the circPDIA4/miR-9-5p/SP1 axis accelerated the development of CRC. In addition, SP1 combined with the promoter region of circPDIA4 and induced circPDIA4 transcription. CircPDIA4 was shown to facilitate tumor growth in an in vivo assay.

Conclusions: The circPDIA4/miR-9-5p/SP1 feedback loop was shown to aggravate CRC progression. This finding suggests that the ceRNA axis may be a promising biomarker for CRC patient treatment.

Keywords: CircRNA; PDIA4; SP1; colorectal cancer; positive feedback loop.


Conflict of interest statement

No potential conflicts of interest are disclosed.

Figures

Figure 1
Figure 1
PDIA mRNA and circPDIA4 expression patterns in CRC tissues and cells. (A) Heatmap illustrating PDIA1-6 mRNA expression and enrichment of protein folding-related signatures (GOBP_PROTEIN_FOLDING and GOMF_PROTEIN_DISULFIDE_ISOMERASE_ACTIVITY, https://www.gsea-msigdb.org) detected through single-sample GSEA in the TCGA-COADREAD dataset (https://portal.gdc.cancer.gov/). (B) Radar chart depicting the correlation values between PDIA1-6 mRNA expression and the enrichment score of protein folding-related signatures in the TCGA-COADREAD dataset. (C) Level of PDIA1-6 protein expression in normal (n = 3) and CRC tissues (n = 10). The foundational tissue microarray data and representative IHC images were obtained from the Human Protein Atlas database (https://www.proteinatlas.org/). Quantification of the bottom graph was performed using Image J software. Data are presented as the mean ± SD. *P < 0.05. (D) Volcano plot showing the differentially expressed circRNAs in CRC tissues compared to matched adjacent tissues in the GSE205643 dataset. (Red: upregulated genes in CRC; blue: downregulated genes in CRC; yellow: circPDIA4). (E) Venn diagram illustrating the overlap between differentially expressed circRNAs in the GSE205643 dataset and circRNAs derived from PDIA1-6 transcripts (http://www.circbase.org/). CircPDIA4 is back-spliced by PDIA4 exons 2, 3, 4, 5, 6, and 7. (F) CircPDIA4 expression levels were detected by rt-qPCR in freshly collected CRC tissues (n = 20) and matched normal tissues (n = 20). Data are presented as the mean ± SD. ***P < 0.001. (G) CircPDIA4 expression was detected in NCM460, HCT116, HT29, SW480, and RKO cells through rt-qPCR. Data are presented as the mean ± SD. ***P < 0.001.
Figure 2
Figure 2
Cellular functions of circPDIA4 in CRC cells. The impact of circPDIA4 depletion on the cell growth of HCT116 (A) and HT29 (B) cells was assessed using the CCK-8 method. The influence of circPDIA4 depletion on CRC cell migration (C) and invasion (D) was evaluated through Transwell assays without or with Matrigel coating. The cells were photographed and counted in five random distinct fields. Data are presented as the mean ± SD. Scale bar = 50 μm; ***P < 0.001.
Figure 3
Figure 3
Identification of circPDIA4-targeting miRNAs. (A) Schematic illustrating the intracellular distribution of circPDIA4 in CRC cells (HCT116 and HT29). Green, cytoplasm; red, nucleus. (B) The RNA bound to the AGO2 protein, obtained through RIP, was used as a template for specific circPDIA4 rt-qPCR to verify its interaction with the AGO2 protein. (C) A Venn diagram depicts the common targets of circPDIA4 identified across circBank, starBase, and circAtlas databases. Additionally, the predicted binding sequence of circPDIA4 with miRNA, as per the starBase database, is provided. (D) The level of miR-9-5p expression in circPDIA4-depleted and control CRC cells was evaluated using rt-qPCR. (E) Schematic illustrating a luciferase reporter system containing either wild-type (WT) or mutated (MUT) miR-9-5p binding sites on circPDIA4. (F) The luciferase reporter experiment assessed the binding interaction between miR-9-5p and circPDIA4 in CRC cells by calculating the relative fluorescence intensity. (G) Level of miR-9-5p expression was detected by rt-qPCR in freshly collected CRC tissues (n = 20) and matched normal tissues (n = 20). (H) miR-9-5p expression was measured in NCM460, HCT116, HT29, SW480, and RKO cells through rt-qPCR. Data are presented as the mean ± SD. ***P < 0.001.
Figure 4
Figure 4
Identification of miR-9-5p-targeting mRNAs. (A) Venn diagram illustrating the shared targets of miR-9-5p identified across the miRDIP, miRMap, miRWalk, and starBase databases. (B) The RNA bound to the AGO2 protein, obtained through RIP, was used as a template for specific rt-qPCR targeting miR-9-5p and SP1 mRNA to verify their interaction with the AGO2 protein. (C) The depletion of SP1 mRNA expression by miR-9-5p in CRC cells was evaluated using rt-qPCR. Cellular mRNA treated with the miR-9-5p mimic or a non-specific control (NC) mimic served as the template. (D) The downregulation of SP1 protein by miR-9-5p in CRC cells was assessed using western blot. (E) Schematic illustrating a luciferase reporter system containing the wild-type (WT) or mutant (MUT) miR-9-5p targeting site within the SP1 3′UTR. (F) The luciferase reporter experiment assessed the binding interaction between miR-9-5p and SP1 3′UTR in CRC cells by calculating the relative fluorescence intensity. (G) SP mRNA expression was detected by rt-qPCR in freshly collected CRC tissues (n = 20) and matched normal tissues (n = 20). (H) SP mRNA expression was measured in NCM460, HCT116, HT29, SW480, and RKO cells through rt-qPCR. Data are presented as the mean ± SD. ***P < 0.001.
Figure 5
Figure 5
Validation of cellular functions of circPDIA4/miR-9-5p/SP1 axis in CRC cells. We investigated the effects of the circPDIA4/miR-9-5p/SP1 regulatory axis on the growth of colorectal cancer (CRC) cell lines, including HCT116 (A) and HT29 (B). Using the CCK-8 assay, we measured cell growth under several conditions: in control cells; in cells depleted of circPDIA4; in circPDIA4-depleted cells treated with a miR-9-5p antagonist (referred to as miR-9-5p-I); and in circPDIA4-depleted cells with SP1 overexpression. Additionally, we evaluated the role of the circPDIA4/miR-9-5p/SP1 axis in CRC cell migration using Transwell assays (C), and in cell invasion using Matrigel-coated Transwell assays (D). The cells were photographed and counted in five random distinct fields. Data are presented as the mean ± SD. Scale bar = 50 μm; ***P < 0.001.
Figure 6
Figure 6
Elucidation of positive feedback regulation of PDIA/cirPDIA4 by SP1. (A) Ranking graph displaying mRNAs co-expressed with SP1 mRNA in the CRC database (Reference: Sidra-LUMC AC-ICAM). (B) Dot plot illustrating the correlation between SP1 and PDIA4 mRNA expression in the CRC database (Sidra-LUMC AC-ICAM). (C) The predicted SP1 binding site on the PDIA4 promoter, as identified by the JASPAR database, was shown. (D) The binding capability of the SP1 protein to the promoter region of PDIA4 was validated by ChIP-PCR. (E) Schematic illustrating a luciferase reporter system containing either wild-type (WT) or mutated (MUT) SP1 binding sites on the PDIA4 promoter. (F) The luciferase reporter assay was conducted to evaluate the impact of SP1 on the transcriptional activity of the PDIA4 promoter in CRC cells by calculating the relative fluorescence intensity. (G) Dot plot illustrating the correlation between SP1 mRNA and circPDIA4 expression in the CRC by rt-qPCR. (H) RT-qPCR was used to assess the expression of circPDIA4 following SP1 depletion in CRC cells. Data are presented as the mean ± SD. ***P < 0.001.
Figure 7
Figure 7
Depletion of circPDIA4 in CRC cells repressed the in vivo tumorigenicity by increasing miR-9-5p expression and suppressing SP1 expression. (A-C) Representative images (A) of tumors were obtained 1 month post-injection of HCT116 cells—either circPDIA4-depleted or control—into the subcutaneous tissue of nude mice. Subsequently, tumor volumes (B) and weights (C) were quantified. Tumor volume calculation formula: V = π/6 × L × W2. (D) RT-qPCR was used to assess the levels of circPDIA4, miR-9-5p, and SP1 expression in tumor tissues. (E) Immunohistochemistry (IHC) was performed to detect proliferating cells (Ki67-positive) in tumor tissues. Scale bar = 80 μm. (F) Schematic diagram illustrating the PDIA4/SP1 positive feedback loop involving circPDIA4/miR-9-5p in CRC. Data are presented as the mean ± SD. ***P < 0.001; **P < 0.01.

Similar articles

References

    1. Keum N, Giovannucci E. Global burden of colorectal cancer: emerging trends, risk factors and prevention strategies. Nat Rev Gastroenterol Hepatol. 2019;16:713–32. - PubMed
    1. Dekker E, Tanis PJ, Vleugels JLA, Kasi PM, Wallace MB. Colorectal cancer. Lancet (London, England) 2019;394:1467–80. - PubMed
    1. Jiang Y, Yuan H, Li Z, Ji X, Shen Q, Tuo J, et al. Global pattern and trends of colorectal cancer survival: a systematic review of population-based registration data. Cancer Biol Med. 2021;19:175–86. - PMC - PubMed
    1. Biller LH, Schrag D. Diagnosis and treatment of metastatic colorectal cancer: a review. JAMA. 2021;325:669–85. - PubMed
    1. Li N, Lu B, Luo C, Cai J, Lu M, Zhang Y, et al. Incidence, mortality, survival, risk factor and screening of colorectal cancer: a comparison among China, Europe, and northern America. Cancer Lett. 2021;522:255–68. - PubMed

MeSH terms

LinkOut - more resources