. 2024 Jun 22;147(1):106.
doi: 10.1007/s00401-024-02758-2.

Ferroptosis inhibitor improves outcome after early and delayed treatment in mild spinal cord injury

Affiliations

Ferroptosis inhibitor improves outcome after early and delayed treatment in mild spinal cord injury

Fari Ryan et al. Acta Neuropathol. .

Abstract

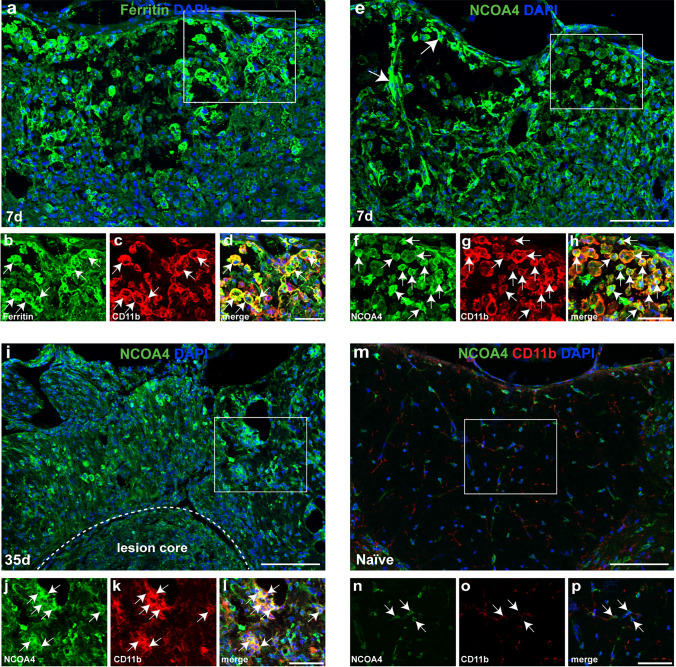
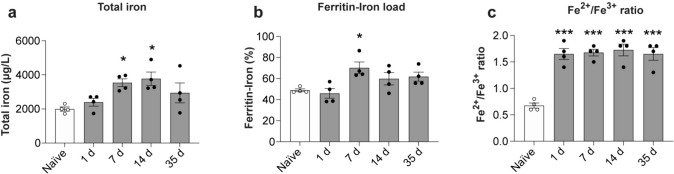
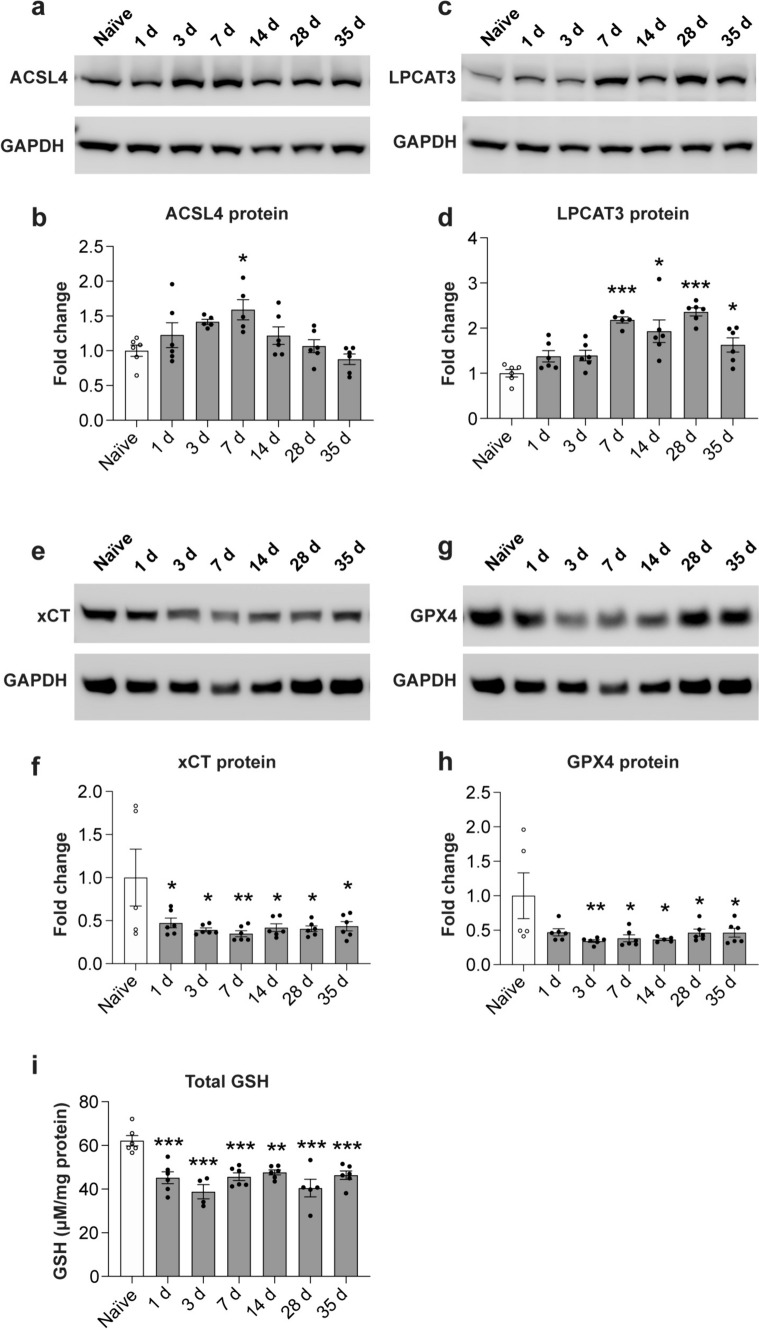
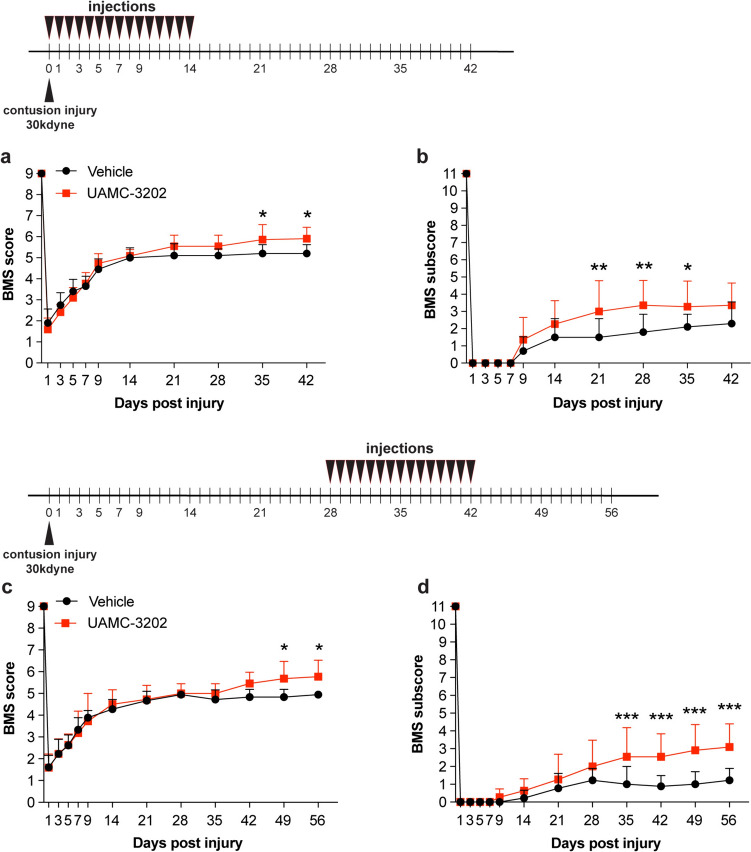
We show that redox active iron can induce a regulated form of non-apoptotic cell death and tissue damage called ferroptosis that can contribute to secondary damage and functional loss in the acute and chronic periods after spinal cord injury (SCI) in young, adult, female mice. Phagocytosis of red blood cells at sites of hemorrhage is the main source of iron derived from hemoglobin after SCI. Expression of hemeoxygenase-1 that induces release of iron from heme, is increased in spinal cord macrophages 7 days after injury. While iron is stored safely in ferritin in the injured spinal cord, it can, however, be released by NCOA4-mediated shuttling of ferritin to autophagosomes for degradation (ferritinophagy). This leads to the release of redox active iron that can cause free radical damage. Expression of NCOA4 is increased after SCI, mainly in macrophages. Increase in the ratio of redox active ferrous (Fe2+) to ferric iron (Fe3+) is also detected after SCI by capillary electrophoresis inductively coupled mass spectrometry. These changes are accompanied by other hallmarks of ferroptosis, i.e., deficiency in various elements of the antioxidant glutathione (GSH) pathway. We also detect increases in enzymes that repair membrane lipids (ACSL4 and LPCAT3) and thus promote on-going ferroptosis. These changes are associated with increased levels of 4-hydroxynonenal (4-HNE), a toxic lipid peroxidation product. Mice with mild SCI (30 kdyne force) treated with the ferroptosis inhibitor (UAMC-3203-HCL) either early or delayed times after injury showed improvement in locomotor recovery and secondary damage. Cerebrospinal fluid and serum samples from human SCI cases show evidence of increased iron storage (ferritin), and other iron related molecules, and reduction in GSH. Collectively, these data suggest that ferroptosis contributes to secondary damage after SCI and highlights the possible use of ferroptosis inhibitors to treat SCI.

Keywords: Antioxidants; Ferritin; Iron toxicity; Lipid peroxidation; NCOA4; Spinal cord injury.


Conflict of interest statement

None.

Figures

Fig. 1
Fig. 1
Changes in protein expression of molecules involved in increasing intracellular iron, and iron storage and release from ferritin in mouse SCI tissue. a, b Western blot data showing changes in expression of HO-1; (Naive vs 7 days: p < 0.0001; F(6, 33) = 7.3, p < 0.0001, n = 5–6 mice per group). c, d Expression levels of DMT1 (Naive vs 1 day and 3 days: p < 0.0001 and 0.011 respectively; F(6, 33) = 32.32, p < 0.0001, n = 5–6 mice per group) and TfR1 (e, f; Naive vs 7 days: p = 0.04; F(6, 28) = 3.8, p = 0.006, n = 5 mice per group) as compared to uninjured (naïve) mice. g, h Expression of ferritin is significantly increased over a longer period (Naive vs 3 days: p = 0.03; Naive vs 7 days: p = 0.003; Naive vs 14 days: p = 0.01; Naïve vs 28 days: p = 0.006; Naïve vs 35 days: p = 0.016; F(6, 34) = 5.8, p = 0.0003, n = 5–6 mice per group). i, j Likewise with increase in expression of NCOA4 (Naive vs 7d days p = 0.0005; Naive vs 14 days: p = 0.0009; Naïve vs 28 days: p < 0.0001; Naïve vs 35 days: p = 0.02; F(6, 66) = 8.98, p < 0.0001, n = 9–11 mice per group). k Quantification of NCOA4 immunostained cells in the dorsal region of the spinal cord (shown in Fig. 2). (Naive vs 7 days: p < 0.0001; Naive vs 35 days: p = 0.02; F(2, 14) = 59.80, p < 0.0001, n = 5–6 mice per group). l Quantification shows that NCOA4 expressed in 37.71 ± 2.75% and 30.31 ± 2.35% of CD11b+ cells at 7 days and 35 days after SCI, respectively. (Naive vs 7 days and 35 days: p < 0.0001; F(2, 13) = 51.52, p < 0.0001, n = 5–6 mice per group). One-way ANOVA with post-hoc Tukey multiple comparison test. *p ≤ 0.05; **p ≤ 0.01 and ***p ≤ 0.001 compared to naïve (uninjured) level. All graphs show Mean ± SEM
Fig. 2
Fig. 2
Immunofluorescence labeling for ferritin and NCOA4 after SCI. a Shows ferritin labeling (green) and DAPI labeling of nuclei (blue) in a cross-section through the dorsal column of the spinal cord near the lesion epicenter, 7 days after SCI. Double immunofluorescence labeling of the area outlined in the white square in panel a is shown in b (ferritin), c (CD11b) and d merged stained images. Note that ferritin is expressed in CD11b + macrophages (arrows in bd). e Shows NCOA4 labeling (green) and DAPI labeling of nuclei (blue) of an area similar to that in a at 7 days post-SCI. Double immunofluorescence labeling of the area outlined in the white square in panel e is shown in f (NCOA4), g (CD11b) and h merged images. Note NCOA4 is expressed in CD11b+ macrophages (arrows in f–h). Panel i shows NCOA4 and DAPI staining of cross-section of the spinal cord 35 days post-SCI. Cross-section near the lesion epicenter. Note the lesion demarcated by dashed white line. Split channels of the area outlined in the white square in panel i are shown in j (NCOA4), k (CD11b) and l (merged) images. Note CD11b+ macrophages continue to express NCOA4 (arrows) at 35 days post-SCI. The uninjured (naïve) spinal cord shows very weak NCOA4 labeling (m). Also shown are the split channels of NCOA4 (n), CD11b (o) and merged (p) labeling. Scale bars = 100 µm; inset = 50 µm
Fig. 3
Fig. 3
Changes in total iron, iron loading in ferritin and Fe2+/Fe3+ ratio assessed by CE-ICP-DRC-MS. This analysis shows a changes in total iron (Naive vs 7 days and 14 days: p = 0.04 and 0.018 respectively; F(4, 15) = 4.6, p = 0.012, n = 4 mice per group), and b amount of iron loaded into ferritin. (Naive vs 7 days: p = 0.03; F(4, 15) = 4.66, p = 0.012; n = 4 mice per group). c Shows the rapid and sustained increase in the ratio of Fe2+/Fe3+ iron in the injured spinal cord (Naive vs 1 day, 7 days, 14 days and 35 days: p < 0.0001, F(4, 15) = 23.07, p < 0.0001; n = 4 mice per group). One-way ANOVA with post-hoc Tukey multiple comparison test. *p ≤ 0.05; **p ≤ 0.01 and ***p ≤ 0.001 compared to naïve (uninjured) level
Fig. 4
Fig. 4
Changes in expression of ferroptosis markers related to lipid repair and GSH metabolism. Western blot analysis of ACSL4 (a, b) and LPCAT3 (c, d) show increased expression of ACSL4 at 7 days (b), and LPCAT3 at 7–35 days post-SCI (d); (b ACSL4 Naive vs 7 days: p = 0.018; F(6, 33) = 4.3, p = 0.002, n = 5–6 mice per group; d Naive vs 7 days: p < 0.0001; Naive vs 14 days: p = 0.0008; Naïve vs 28 days: p < 0.0001; Naïve vs 35 days: p = 0.04; F(6, 34) = 11.4, p < 0.0001, n = 5–6 mice per group). Western blotting also shows that system xC (xCT) (e, f) and GPX4 (g, h) are significantly reduced in the injured spinal cord from 1–35 d post-SCI as compared to uninjured (naive) spinal cord. (f Naive vs 1 day: p = 0.04; Naive vs 3 days: p = 0.013; Naive vs 7 days: p = 0.006; Naive vs 14 days: p = 0.019; Naïve vs 28 days: p = 0.015; Naïve vs 35 days: p = 0.02; F(6, 34) = 3.5, p = 0.008, n = 5–6 mice per group; h Naive vs 3 days: p = 0.007; Naive vs 7 days: p = 0.014; Naive vs 14 days: p = 0.016; Naïve vs 28 days: p = 0.04; Naïve vs 35 days: p = 0.04; F(6, 33) = 3.3, p = 0.0105, n = 5–6 mice per group) (i) GSH levels are reduced at all time points examined after SCI as compared to uninjured naïve levels.(Naïve vs 1 day: p = 0.0003; Naive vs 3 days: p < 0.0001; Naive vs 7 days: p = 0.0005; Naive vs 14 days: p = 0.002; Naïve vs 28 days: p < 0.0001; Naïve vs 35 days: p = 0.0009; F(6, 32) = 9.3, p < 0.0001, n = 4–6 mice per group). One-way ANOVA with post-hoc Tukey multiple comparison test. *p ≤ 0.05; **p ≤ 0.01 and ***p ≤ 0.001 compared to naïve (uninjured) level. All graphs show mean ± SEM
Fig. 5
Fig. 5
Changes in levels of 4-HNE in the injured mouse spinal cord. a Western blot analysis shows that the level of 4-HNE increases after SCI. b Significantly increased levels are seen at 1 and 3 days post-SCI (Naive vs 1 day and 3 days: p < 0.0001 and 0.02 respectively; F(6, 35) = 21.3, p < 0.0001, n = 6 mice per group, One-way ANOVA with post-hoc Tukey multiple comparison test. *p ≤ 0.05; **p ≤ 0.01 and ***p ≤ 0.001). Graph presents Mean ± SEM. However, immunofluorescence shows there is detectable increase at later time points as compared to uninjured (naïve) controls. Immunofluorescence labeling of 4-HNE in the naïve uninjured spinal cord (c) and at 7 days after SCI (d). Double immunofluorescence labeling of the dorsal horn region labeled for 4HNE/CD11b (e) and 4HNE/NeuN (f). Note the double labeled CD11b + macrophages and NeuN + neurons in the insets in e and f, respectively; nuclei in the insets stained with DAPI. g Double immunofluorescence labeling of 4HNE/CD11b at 35 days post-SCI. Note the strong 4HNE labeling in CD11b+ macrophages in the white matter and in the lesion core. Regions outlined within the white squares in panel g are shown at higher magnification in panels h (white matter), and i (lesion core). The double labeled cells appear yellow. The large-rounded cells within the lesion core are macrophages as indicated by the single labeling channel for CD11b (red; inset in panel i). The strong 4-HNE labeling in and around the core of the lesion provides evidence of widespread lipid peroxidation that can contribute to oxidative damage even at later time periods (5 weeks) after SCI. Scale bars = 100 µm; inset = 25 µm
Fig. 6
Fig. 6
Ferroptosis inhibitor does not improve locomotor recovery after 40 kdyne injury. Locomotor recovery after 40 kdyne injury assessed by BMS analysis a shows no improvement after UAMC-3203 inhibitor treatment as compared to control (vehicle) group; (F(9, 180) = 1.22, p = 0.28, n = 12 (UAMC-3203) and n = 10 (vehicle)). b BMS sub-scores which evaluate finer aspects of locomotor control, also do not show improvement; (F(9, 180) = 0.89, p = 0.53, n = 12 (UAMC-3203) and n = 10 (vehicle)). Treatment with UAMC-3203 was administered daily for the first 14 days as indicated at the top of panel a. All graphs show mean ± SD
Fig. 7
Fig. 7
Ferroptosis inhibitor (UAMC-3203) treatment after 30 kdyne injury improves locomotor recovery. Locomotor recovery in the early treatment group assessed by BMS analysis a shows improvement by 35 and 42 days; (p(35d) = 0.02; p(42d) = 0.0106; F(10, 190) = 4.07, p < 0.0001, n = 11 (UAMC-3203) and n = 10 (vehicle)). b BMS sub-scores, which evaluate finer aspects of locomotor control, show significant improvement starting from 21 days post-SCI; (p(21d) = 0.003; p(28d) = 0.0018; p(35d) = 0.04; F(10, 190) = 2.7, p = 0.003, n = 11 (UAMC-3203) and n = 10 (vehicle)). In the early treatment group UAMC-3203 was administered daily for the first 14 days as indicated at the top of panel a. In the delayed treatment group (c, d), in which treatment was given daily from 28–42 days post-SCI, BMS analysis shows locomotor recovery by days 49 and 56 (c); (p(49d) = 0.02; p(56d) = 0.02; F(12, 216) = 2.8, p = 0.0012, n = 11 (UAMC-3203) and n = 9 (vehicle)). d Analysis of BMS sub-scores show significant improvement in UAMC-3203 group starting from day 35 onwards (p(35d) = 0.0006; p(42d) = 0.0002; p(49d) < 0.0001; p(56d) < 0.0001; F(12, 216) = 5.8, p < 0.0001, n = 11 (UAMC-3203) and n = 9 (vehicle)). Two-way RM-ANOVA; time x group effect with post-hoc Bonferroni multiple comparison test. *p ≤ 0.05; **p ≤ 0.01 and ***p ≤ 0.001. All graphs show mean ± SD
Fig. 8
Fig. 8
Comparison of the expression of three key markers of ferroptosis after 30 and 40 kdyne force injuries. Expression of ferritin (ac), NCOA4 (eg), and 4-HNE (ik) are increased in the injured spinal cord after both 30 kdyne and 40 kdyne injuries at 7 days after SCI. Quantification shows statistically significant increases after both injuries compared to uninjured controls: d Naive vs 7 days 30 kdyne and 40 kdyne: p < 0.0001; 7 days 30 kdyne vs 40 kdyne: p = 0.003; F(2, 14) = 357.4, p < 0.0001, n = 5–6 mice per group). h Naive vs 7 days 30 kdyne and 40 kdyne: p < 0.0001; 7 days 30 kdyne vs 40 kdyne: p = ns; F(2, 14) = 43.8, p < 0.0001, n = 5–6 mice per group). l Naive vs 7 days 30 kdyne and 40 kdyne: p < 0.0001; 7 days 30 kdyne vs 40 kdyne: p = 0.04; F(2, 14) = 37.32, p < 0.0001, n = 5–6 mice per group). One way ANOVA with post hoc Tukey multiple comparison test. *** p ≤ 0.001 compared to naïve (uninjured) level. #p ≤ 0.05; ##p ≤ 0.01 comparing the two force injuries. All graphs show mean ± SEM. Scale bar = 100 μm
Fig. 9
Fig. 9
Delayed treatment with ferroptosis inhibitor (UAMC-3203) reduces secondary damage after SCI. All analyses were done on tissue samples from animals used for BMS analysis (30 kdyne) and were obtained on day 56. ac Lesion size determined by estimating the area of loss of GFAP staining. Note the larger lesion in the vehicle treated group (a) as compared to the UAMC-3203 treated mice (b). c Quantification shows that the lesion is significantly smaller at the lesion epicenter in the UAMC-3203 treated group as compared to the vehicle treated group. (p(epicenter) = 0.0001; F(1, 8) = 4.9, p = 0.05, n = 5 mice per group, Two-way RM-ANOVA; group effect with post-hoc Bonferroni multiple comparison test. *p ≤ 0.05; **p ≤ 0.01 and ***p ≤ 0.001). d, e Micrographs of LFB staining at the lesion epicenter in vehicle treated SCI mice (d) and UAMC-3203 treated SCI mice (e). f Quantification of LFB staining shows greater myelin at the lesion from epicenter to 600 µm caudally in UAMC-3203 treated group compared to the vehicle group. (p(epicenter) = 0.02, p(+200) = 0.003, p(+400) = 0.015, p(+600) = 0.04; F(1, 7) = 5.8, p = 0.04, n = 4–5 mice per group. Two-way RM-ANOVA; group effect with post-hoc Bonferroni multiple comparison test. *p ≤ 0.05; **p ≤ 0.01 and ***p ≤ 0.001). g, h 5-HT immunoreactivity in the ventral horn region 1 mm caudal to the lesion epicenter shows increased sprouting in UAMC-3203 treated mice (h) compared to vehicle treated mice (g). i Quantification shows significant increase in 5-HT labeling in the UAMC-3203 group compared to vehicle group (vehicle vs UAMC-3203: p = 0.007; n = 5 mice per group, Two-tailed Mann Whitney U-test; **p ≤ 0.01. All graphs show Mean ± SEM. Scale bars = 100 µm
Fig. 10
Fig. 10
Iron metabolism and ferroptosis and markers in human CSF and serum of SCI and control patients. Dot plots of raw data of ferroptosis markers in control and spinal cord injury groups. Dot plot longitudinal data from spinal cord injury group patients is connected by lines for a better overview. Data is provided for a ferritin in CSF, b ferritin in serum, c glutathione in CSF, d hemoglobin α in CSF, e hemopexin CSF, f hemopexin in serum, g hepcidin in CSF, h hepcidin in serum, i haptoglobin in CSF, j haptoglobin in serum, k sTfR in CSF, i sTfR in serum. Indicated p-values are derived from Mann–Whitney-U-Test results of a comparison of control and 14-days SCI group data. Control group data for haptoglobin and sTfR is available for three patients only, preventing reasonable statistical testing, therefore p-values for these groups should be taken with caution. AIS ASIA impairment scale, CSF cerebrospinal fluid, SCI spinal cord injury, sTfR soluble Transferrin Receptor

References

    1. Arosio P, Elia L, Poli M. Ferritin, cellular iron storage and regulation. IUBMB Life. 2017;69:414–422. doi: 10.1002/iub.1621. - DOI - PubMed
    1. Basso DM, Fisher LC, Anderson AJ, Jakeman LB, McTigue DM, Popovich PG. Basso Mouse Scale for locomotion detects differences in recovery after spinal cord injury in five common mouse strains. J Neurotrauma. 2006;23:635–659. doi: 10.1089/neu.2006.23.635. - DOI - PubMed
    1. Bastani NE, Kostovski E, Sakhi AK, Karlsen A, Carlsen MH, Hjeltnes N, Blomhoff R, Iversen PO. Reduced antioxidant defense and increased oxidative stress in spinal cord injured patients. Arch Phys Med Rehabil. 2012;93(2223–2228):e2222. doi: 10.1016/j.apmr.2012.06.021. - DOI - PubMed
    1. Bradbury EJ, Burnside ER. Moving beyond the glial scar for spinal cord repair. Nat Commun. 2019;10:3879. doi: 10.1038/s41467-019-11707-7. - DOI - PMC - PubMed
    1. Chio JCT, Xu KJ, Popovich P, David S, Fehlings MG. Neuroimmunological therapies for treating spinal cord injury: evidence and future perspectives. Exp Neurol. 2021;341:113704. doi: 10.1016/j.expneurol.2021.113704. - DOI - PubMed

Publication types