. 2024 Jul:105:105209.
doi: 10.1016/j.ebiom.2024.105209. Epub 2024 Jun 21.

Mapping the gut microecological multi-omics signatures to serum metabolome and their impact on cardiometabolic health in elderly adults

Affiliations

Mapping the gut microecological multi-omics signatures to serum metabolome and their impact on cardiometabolic health in elderly adults

Chu-Wen Ling et al. EBioMedicine. 2024 Jul.

Abstract

Background: Mapping gut microecological features to serum metabolites (SMs) will help identify functional links between gut microbiome and cardiometabolic health.

Methods: This study encompassed 836-1021 adults over 9.7 year in a cohort, assessing metabolic syndrome (MS), carotid atherosclerotic plaque (CAP), and other metadata triennially. We analyzed mid-term microbial metagenomics, targeted fecal and serum metabolomics, host genetics, and serum proteomics.

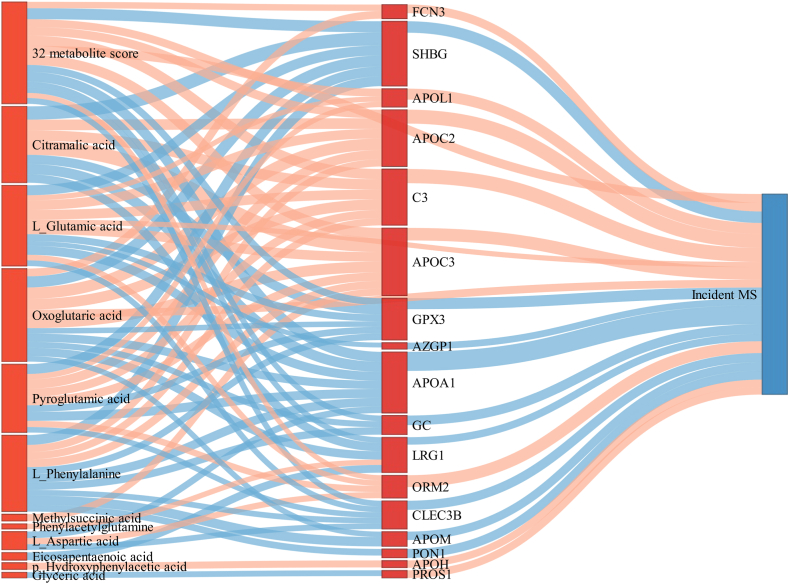
Findings: Gut microbiota and metabolites (GMM) accounted for 15.1% overall variance in 168 SMs, with individual GMM factors explaining 5.65%-10.1%, host genetics 3.23%, and sociodemographic factors 5.95%. Specifically, GMM elucidated 5.5%-49.6% variance in the top 32 GMM-explained SMs. Each 20% increase in the 32 metabolite score (derived from the 32 SMs) correlated with 73% (95% confidence interval [CI]: 53%-95%) and 19% (95% CI: 11%-27%) increases in MS and CAP incidences, respectively. Among the 32 GMM-explained SMs, sebacic acid, indoleacetic acid, and eicosapentaenoic acid were linked to MS or CAP incidence. Serum proteomics revealed certain proteins, particularly the apolipoprotein family, mediated the relationship between GMM-SMs and cardiometabolic risks.

Interpretation: This study reveals the significant influence of GMM on SM profiles and illustrates the intricate connections between GMM-explained SMs, serum proteins, and the incidence of MS and CAP, providing insights into the roles of gut dysbiosis in cardiometabolic health via regulating blood metabolites.

Funding: This study was jointly supported by the National Natural Science Foundation of China, Key Research and Development Program of Guangzhou, 5010 Program for Clinical Research of Sun Yat-sen University, and the 'Pioneer' and 'Leading goose' R&D Program of Zhejiang.

Keywords: Cardiometabolic health; Gut microbiota; Metabolomics; Multi-omics; Proteomics.


Conflict of interest statement

Declaration of interests The authors declare that they have no competing interests.

Figures

Fig. 1
Fig. 1
Study design and main findings. Abbreviations: CAP: carotid atherosclerotic plaque; CVD: cardiovascular diseases; GMM: gut microbiota and metabolites; GNHS: Guangzhou Nutrition and Health Study; SMs: serum metabolites; MS: metabolic syndrome; SHBG: sex hormone binding globulin.
Fig. 2
Fig. 2
Contribution of host and gut microbial factors to the variances of serum metabolome. (A) The contribution of host and gut microecological features on serum metabolite profile. This result came from permutational multivariate analysis of variance (PERMANOVA) of overall serum metabolite levels based on separate models for each feature group and combined models. The bars for each group represent the cumulative explained variance of each group of features. (B–D) The variance in serum metabolite profile explained by the top 12 species (B), 15 MetaCyc pathways (C), and 15 fecal metabolites (D). (E) A polar bar plot illustrates the extent of variance explained by gut microecological features for each serum metabolite. The figure includes only those metabolites with an explained variance greater than 1%. Abbreviations: 3S-GLCA: sulfated glycosylcholic acid; EPA: eicosapentaenoic acid; HPHPA: 3-(3-Hydroxyphenyl)-3- hydroxypropanoic acid.
Fig. 3
Fig. 3
Associations of GMM-explained serum metabolites with serum proteins, CVD risk factors, and MS and CAP incidences. (A) The heatmap shows the standardized beta coefficients between serum metabolites and proteins using linear regression and correlation coefficients between serum metabolites and CVD risk factors using Spearman correlation, alongside their corresponding P values. The forest plot presents the adjusted hazard ratios (HRs) and 95% confidential intervals (95% CI) of incident MS and CAP by each quintile increase in the top 32 GMM-explained serum metabolites and the 32-metabolite score (32-SMS), as analyzed by the Cox regression model. Significance levels are indicated as ∗ P < 0.05, ∗∗P < 0.01, ∗∗∗P < 0.001. (B, C) Relative risks (RRs) and their 95% CIs of incident MS (B) and CAP (C) in relation to the 32-SMS. We analyzed using a linear model and restricted cubic spline method of Cox regression. The reference value is set at the median of the first quintile in the 32-SMS with nodes at the 20th, 40th, 60th, and 80th percentiles. The 32-SMS was developed using the β coefficients between the top 32 GMM-explained serum metabolites and MS incidence. Covariates adjusted: age, sex, education, household income, marital status, smokers, tea drinkers, alcohol drinkers, physical activity, multivitamin use, and daily energy intake. Abbreviations: APOA1: apolipoprotein A1; APOC2: apolipoprotein C2; APOC3: apolipoprotein C3; APOH: apolipoprotein H; APOL1: apolipoprotein L1; APOM: apolipoprotein M; AZGP1: alpha-2-glycoprotein 1, zinc-binding; BMI: body mass index; C3: complement protein 3; CAP: carotid atherosclerotic plaque; cIMT-BIF: carotid intima-media thickness at the bifurcation; CLEC3B: c-type lectin domain family 3 member B; CVD: cardiovascular disease; FCN3: Ficolin 3; GC: GC vitamin D binding protein; GLCA-3S: sulfated glycosylcholic acid; GMM: gut microbiota and metabolites; GPX3: glutathione peroxidase 3; HDL-c, high-density lipoprotein cholesterol; HOMA-IR, homeostasis model assessment-insulin resistance; hs-CRP: high sensitivity C-Reactive Protein; IL-6: interleukin-6; LRG1: leucine-rich alpha-2 glycoprrotein 1; MS: metabolic syndrome; ORM2: orosomucoid 2; PON1: paraoxonase and arylesterase 1; PROS1: protein S; RR: relative risk; SBP: systolic blood pressure; SHBG: sex hormone binding globulin; TC, total cholesterol; TG: triglycerides.
Fig. 4
Fig. 4
Associations of top GMM-explained serum metabolites and incident MS and CAP. A-C, the adjusted relative risks (RRs) and 95% confidential intervals (95% CI) of incident metabolic syndrome (MS) associated with serum citramalic acid (A), oxoglutaric acid (B), and indoleacetic acid (C). D-I, Adjusted RRs and 95% CI of incident carotid atherosclerotic plaque (CAP) associated with serum sebacic acid (D), indoleacetic acid (E), suberic acid (F), chenodeoxycholic acid (G), eicosapentaenoic acid (H), and glycoursodeoxycholic acid (I), respectively. The restricted cubic spline method of Cox regression was used for the analysis. The reference point was set at the median of the first quintile in the serum metabolites with values above zero, with nodes positioned at the 20th, 40th, 60th, and 80th percentiles. Covariates adjusted in these analyses: age, sex, education, household income, marital status, smokers, tea drinkers, alcohol drinkers, physical activity, multivitamin use, daily energy intake, and other significant serum metabolites identified through step-wise variable selection. A forward selection process in the Cox model was utilized to determine the most predictive variables (P < 0.05) from the potential candidates. The Cox proportional-hazards model was employed to develop the model and estimate the coefficients for each predictor, indicating the RR per quintile. GMM: gut microbiota and metabolites.
Fig. 5
Fig. 5
Interrelationships among GMM-explained serum metabolite indices, CVD-related proteins, and incident MS based on regression coefficients. This illustrates the standardized β coefficients from linear regression associations between GMM-explained serum metabolites and serum proteins, as well as β coefficients between serum proteins (per quintile) and incident metabolic syndrome (MS) by Cox regression. We adjusted the P-values by using the Benjamini-Hochberg false discovery rate (FDR) method. Light pink and blue connections indicate positive and inverse correlations (FDR<0.05). Rectangles represent GMM-explained serum metabolite indices (left), serum proteins (middle), and incident MS (right). Abbreviations: APOA1: apolipoprotein A1; APOC2: apolipoprotein C2; APOC3: apolipoprotein C3; APOH: apolipoprotein H; APOL1: apolipoprotein L1; APOM: apolipoprotein M; AZGP1: alpha-2-glycoprotein 1, zinc-binding; C3: complement protein 3; CAP: carotid atherosclerotic plaque; CLEC3B: c-type lectin domain family 3 member B; CVD: cardiovascular disease; FCN3: Ficolin 3; GC: GC vitamin D binding protein; GMM: gut microbiota and metabolites; GPX3: glutathione peroxidase 3; LRG1: leucine-rich alpha-2 glycoprotein 1; MS: metabolic syndrome; ORM2: orosomucoid 2; PON1: paraoxonase and arylesterase 1; PROS1: protein S; SHBG: sex hormone binding globulin.
Fig. 6
Fig. 6
Network illustrating relationships between gut microecological signatures, serum metabolites and cardiometabolic traits. The network diagram visualizes the relationships between gut microecological signatures, serum metabolites, and cardiometabolic traits, constructed based on Spearman coefficients exceeding 0.12 (all P < 0.00015). Each dot represents a distinct feature, with the size indicating the number of connections. The color of the lines, blue for inverse and red for positive correlations, along with their thickness, represents the strength of the associations. Key elements are color-coded for easy identification: green round rectangles for species, purple parallelograms for MetaCyc pathways, orange diamonds for fecal metabolites, red ellipses for blood metabolites, and blue triangles for cardiometabolic traits. Abbreviations: ANDROID_PFAT, fat mass percentage at the android region; BIF, carotid intima-media thickness of the bifurcation; CCA, carotid intima-media thickness of the common carotid artery; FPS, Framingham point score; GLU, fasting blood glucose; GYNOID_PFAT, fat mass percentage at the gynoid region; HbA1c, glycated hemoglobin; HDL-c, high-density lipoprotein cholesterol; HOMA-IR, homeostasis model assessment-insulin resistance; hs-CRP, high sensitivity C-Reactive Protein; IL-1β, interleukin-1β; IL-6, interleukin-6; LDL-c, low-density lipoprotein cholesterol; NorDCA, nordeoxycholic acid; TC, total cholesterol; TG, triglyceride; TNF-α, tumor necrosis factor-α; WB_PFAT, fat mass percentage at the whole body. s_: species; f_: fecal metabolites; b_: blood metabolites.

Similar articles

Cited by

References

    1. WHO. Cardiovascular diseases (CVDs) 2021. https://www.who.int/news-room/fact-sheets/detail/cardiovascular-diseases... Available from:
    1. Cannon C.P. Cardiovascular disease and modifiable cardiometabolic risk factors. Clin Cornerstone. 2007;8(3):11–28. - PubMed
    1. Hansen T.H., Gobel R.J., Hansen T., Pedersen O. The gut microbiome in cardio-metabolic health. Genome Med. 2015;7(1):33. - PMC - PubMed
    1. de Vos W.M., Tilg H., Van Hul M., Cani P.D. Gut microbiome and health: mechanistic insights. Gut. 2022;71(5):1020–1032. - PMC - PubMed
    1. Wang Z., Zhao Y. Gut microbiota derived metabolites in cardiovascular health and disease. Protein Cell. 2018;9(5):416–431. - PMC - PubMed