. 2024 Jul 25;187(15):4030-4042.e13.
doi: 10.1016/j.cell.2024.05.048. Epub 2024 Jun 21.

TERT activation targets DNA methylation and multiple aging hallmarks

Affiliations

TERT activation targets DNA methylation and multiple aging hallmarks

Hong Seok Shim et al. Cell. .

Abstract

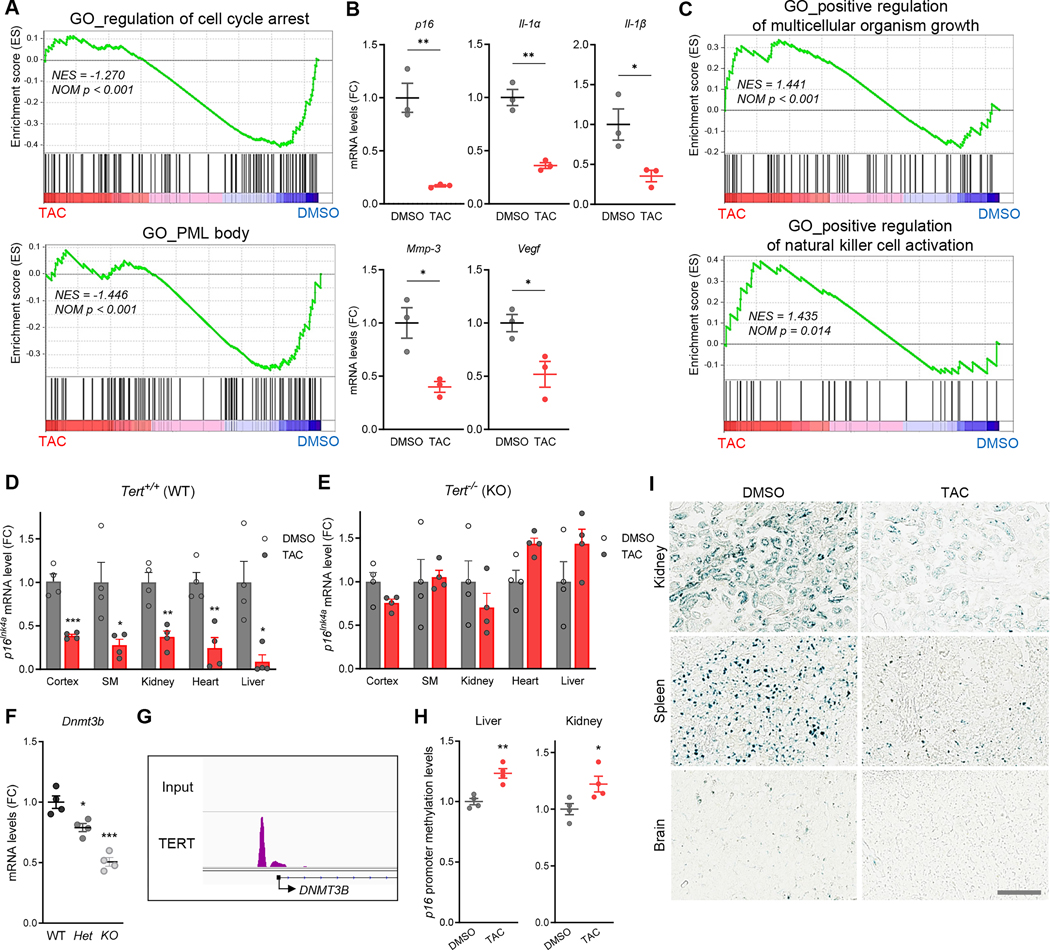
Insufficient telomerase activity, stemming from low telomerase reverse transcriptase (TERT) gene transcription, contributes to telomere dysfunction and aging pathologies. Besides its traditional function in telomere synthesis, TERT acts as a transcriptional co-regulator of genes pivotal in aging and age-associated diseases. Here, we report the identification of a TERT activator compound (TAC) that upregulates TERT transcription via the MEK/ERK/AP-1 cascade. In primary human cells and naturally aged mice, TAC-induced elevation of TERT levels promotes telomere synthesis, blunts tissue aging hallmarks with reduced cellular senescence and inflammatory cytokines, and silences p16INK4a expression via upregulation of DNMT3B-mediated promoter hypermethylation. In the brain, TAC alleviates neuroinflammation, increases neurotrophic factors, stimulates adult neurogenesis, and preserves cognitive function without evident toxicity, including cancer risk. Together, these findings underscore TERT's critical role in aging processes and provide preclinical proof of concept for physiological TERT activation as a strategy to mitigate multiple aging hallmarks and associated pathologies.

Keywords: adult neurogenesis; cognition; epigenetics; inflammation; p16(INK4a); senescence; telomerase; telomere.


Conflict of interest statement

Declaration of interests R.A.D. is a founder, advisor, and/or director of Tvardi Therapeutics, Inc.; Nirogy Therapeutics, Inc.; Stellanova Therapeutics, Inc.; Sporos Bioventures, LLC.; Bectas Therapeutics, Inc.; and Asylia Therapeutics, Inc., which are focused on therapies for cancer and fibrosis and bear no direct relevance to this study.

Figures

Figure 1.
Figure 1.. Identification of a small molecule activator of TERT.
(A) The workflow of high-throughput and confirmation screening strategy used to identify novel small molecule TERT activators. (B) Plate-based Z scores of hTERT-RLUC luminance measurements of all test compound screen in primary adult mouse fibroblasts of hTERT-Rluc transgenic mouse. (C) Molecular structure of TAC. (D) TERT mRNA levels in MRC-5 fibroblasts treated with the indicated concentration of TAC for 4 h. (E) The chromatin occupancy of active enhancer/promoter mark H3K27ac and repressive histone mark H3K9me3 in the TERT gene of vehicle- or TAC-treated MRC-5 fibroblasts. (F) hTERT promoter activity in the indicated tissues of hTERT-Rluc reporter transgenic mice at the indicated time points (hr) postinjection (i.p.) of 6 mg/kg TAC (n = 3~4 per group, two-way ANOVA with Tukey’s multiple comparisons test). (G) Immunoblots for the indicated endogenous proteins in vehicle- or TAC-treated primary WS fibroblasts. A tubulin was used as a loading control. (H) Relative telomere length of primary WS fibroblasts treated with vehicle or TAC. Relative telomere length was determined as the ratio of telomere repeat copy numbers to single copy gene 36B4 copy number measured by quantitative PCR (n = 4 per group, two-tailed unpaired t-test). (I) Left, representative FISH images for telomeres (red) in interphase nuclei of vehicle- or TAC-treated WS fibroblasts. Right, quantification of telomere FISH. Each value represents average intensity of each nuclei (n = 50 nuclei per group, two-tailed unpaired t-test) Scale bar, 10 μm. Data are mean ± s.e.m. *P < 0.05, **P < 0.01, ***P < 0.001, ****P < 0.0001. See also Figure S1.
Figure 2.
Figure 2.. TAC activates the MEK/ERK/AP-1 cascade to upregulate TERT transcription.
(A) Alteration of cellular signaling in TAC-treated MRC-5 cells. MRC-5 cells were treated with vehicle or TAC for 0.5 h and the cell lysates were subjected to the human phosphokinase array. (B) Quantification of p-ERK1/2 and p-S6K from the phosphokinase array in A (n = 2 per group, two-tailed unpaired t-test). (C) TERT and ERK levels in MRC-5 cells treated with TAC and/or trametinib, a selective MEK inhibitor. A tubulin was used as a loading control. (D) Venn diagrams showing overlaps of significantly upregulated genes upon TAC treatment in human fibroblasts and neurons (≥ 2-fold cutoff; P < 0.05). (E) Scatterplot comparing the statistical significance (p-values) of DEGs in human fibroblasts and neurons. Red dots indicate the genes significantly upregulated in both cells (n = 3 per group). (F) RNA-seq heatmap of genes up-regulated upon TAC treatment in human MRC-5 fibroblasts and human iPSC-derived neurons (n = 3). (G) Quantification of the expression of FOS genes in human MRC-5 fibroblasts and human iPSC-derived neurons treated with vehicle or TAC (n = 3 per group, two-tailed unpaired t-test). (H) Sequence comparison of a putative FOS binding site in human and mouse TERT 5’-UTR region. (I) Schematic representation and transcriptional activity of human -4 kb TERT promoter-Luc reporter constructs and deletion mutants in MRC-5 cells (n = 4 per group, two-way ANOVA with Tukey’s multiple comparisons test). Putative AP-1 binding sites are boxed. (J) c-FOS ChIP-qPCR enrichment at the endogenous promoter region of TERT in MRC-5 cells after TAC treatment (n = 4 per group, two-way ANOVA with Sidak’s multiple comparisons test). (K) TERT levels in MRC-5 cells treated with TAC and/or T-5224, a selective c-FOS/AP-1 inhibitor. Data are mean ± s.e.m. *P < 0.05, **P < 0.01, ***P < 0.001, ****P < 0.0001; ns, not significant. See also Figure S2.
Figure 3.
Figure 3.. TAC attenuates diverse aging hallmarks in vivo.
(A) GSEA plots showing downregulated GO pathways in the PBMC of TAC-treated C57BL/6 mice relative to vehicle-treated controls (n = 4 per group; 10~12-month-old). (B) mRNA levels of senescence-related genes downregulated in TAC-treated PBMCs compared to control (n = 3 per group, two-tailed unpaired t-test). (C) GSEA plots showing upregulated GO pathways in the PBMC of TAC-treated mice relative to vehicle-treated controls. (D, E) p16Ink4a mRNA levels in the multiple tissues of TAC-treated wildtype (Tert+/+) (D) or Tert-KO (Tert−/−, first-generation [G1]) (E) mice relative to each control group (n = 4 per group; 10~12-month-old, two-tailed unpaired t-test). (F) mRNA levels of Dnmt3b gene in wild-type (Tert+/+), Tert heterozygous (Tert+/−) and Tert homozygous knockout (Tert−/−, G1) mouse brains (n = 4 per group, two-way ANOVA with Tukey’s multiple comparisons test). (G) TERT occupancy in the DNMT3B gene of human iPSC-derived neurons. (H) p16Ink4a promoter methylation levels in the liver and kidney tissues of vehicle- or TAC-treated C57BL/6 mice (n = 4 mice per group; 10~12-month-old, two-tailed unpaired t-test). (I) Representative images of SA-β-gal staining in the tissues of vehicle- or TAC-treated aged C57BL/6 mice (n = 4, 26~27-month-old). Data are mean ± s.e.m. *P < 0.05, **P < 0.01, ***P < 0.001. See also Figure S3 and S4.
Figure 4.
Figure 4.. Chronic TAC administration ameliorates brain aging.
(A) A ranked list of genes in the observed transcriptional data from TAC-treated mouse hippocampi relative to control (n = 3 mice per group). (B) Pathways enriched (red) or depleted (blue) in TAC-treated hippocampi. Resource categories: #, Gene Ontology; ##, WikiPathways; ###, Reactome. (C, D) Representative images of DCX immunoreactivity by immunohistochemistry (C) or immunofluorescence (D) in the dentate gyrus of middle-aged (10~12-month-old) mice that were treated with vehicle and TAC for 1 month. Scale bars, 100 μm and 25 μm, respectively. (E) Quantifications of DCX+ and DCX+ PSA-NCAM+ cells in both groups (n = 4 per group, two-tailed unpaired t-test). (F) Representative images of IBA1 labelled microglia (left) and quantifications of microglial density (middle) and cell soma size (right) in the hippocampus of middle-aged (10~12-month-old) mice that were treated with vehicle and TAC for 1 month (n = 4 (IBA1+ cell numbers) and 80 (soma size), respectively, per group, two-tailed unpaired t-test). Scale bar, 100 μm. (G) mRNA levels of pro-inflammatory cytokines Il-1β, Il-6 and Tnf-α in the hippocampus of middle-aged mice (10~12month-old) treated with vehicle or TAC for 1 month (n = 4 per group, two-way ANOVA with Sidak’s multiple comparisons test). (H) Escape latency in Barnes maze trials over training days for aged (26~27-month-old) mice that were treated with vehicle or TAC for 6 months (n = 6 per group, two-way ANOVA with Sidak’s multiple comparisons test). (I) Discrimination index for vehicle- or TAC-treated aged (26~27-month-old) mice in the novel-location recognition test (n = 6 per group, two-way ANOVA with Tukey’s multiple comparisons test). Data are mean ± s.e.m. *P < 0.05, **P < 0.01, ***P < 0.001. See also Figure S5.
Figure 5.
Figure 5.. Schematic illustration of TAC/TERT-driven anti-aging effects.
The expression of TERT, a catalytic subunit of telomerase, is tightly suppressed in normal somatic cells. A novel small molecule TAC can trigger transcriptional activation of somatic TERT expression via activation of MEK/ERK/AP-1 signaling cascade. Somatic TERT induction not only reduces tissue senescence by silencing p16INK4a through promoter hypermethylation via DNMT3B and inflammation but also enhances adult neurogenesis and cognitive function by promoting hippocampal transcriptomic signatures.

References

    1. Lopez-Otin C, Blasco MA, Partridge L, Serrano M, and Kroemer G. (2013). The hallmarks of aging. Cell 153, 1194–1217. 10.1016/j.cell.2013.05.039. - DOI - PMC - PubMed
    1. Chakravarti D, LaBella KA, and DePinho RA (2021). Telomeres: history, health, and hallmarks of aging. Cell 184, 306–322. 10.1016/j.cell.2020.12.028. - DOI - PMC - PubMed
    1. Carmona JJ, and Michan S. (2016). Biology of Healthy Aging and Longevity. Rev Invest Clin 68, 7–16. - PubMed
    1. Frenk S, and Houseley J. (2018). Gene expression hallmarks of cellular ageing. Biogerontology 19, 547–566. 10.1007/s10522-018-9750-z. - DOI - PMC - PubMed
    1. Booth LN, and Brunet A. (2016). The Aging Epigenome. Mol Cell 62, 728–744. 10.1016/j.molcel.2016.05.013. - DOI - PMC - PubMed

MeSH terms