. 2024 Aug 1;31(8):1222-1238.e10.
doi: 10.1016/j.stem.2024.05.011. Epub 2024 Jun 21.

Primitive macrophages enable long-term vascularization of human heart-on-a-chip platforms

Affiliations

Primitive macrophages enable long-term vascularization of human heart-on-a-chip platforms

Shira Landau et al. Cell Stem Cell. .

Abstract

The intricate anatomical structure and high cellular density of the myocardium complicate the bioengineering of perfusable vascular networks within cardiac tissues. In vivo neonatal studies highlight the key role of resident cardiac macrophages in post-injury regeneration and angiogenesis. Here, we integrate human pluripotent stem-cell-derived primitive yolk-sac-like macrophages within vascularized heart-on-chip platforms. Macrophage incorporation profoundly impacted the functionality and perfusability of microvascularized cardiac tissues up to 2 weeks of culture. Macrophages mitigated tissue cytotoxicity and the release of cell-free mitochondrial DNA (mtDNA), while upregulating the secretion of pro-angiogenic, matrix remodeling, and cardioprotective cytokines. Bulk RNA sequencing (RNA-seq) revealed an upregulation of cardiac maturation and angiogenesis genes. Further, single-nuclei RNA sequencing (snRNA-seq) and secretome data suggest that macrophages may prime stromal cells for vascular development by inducing insulin like growth factor binding protein 7 (IGFBP7) and hepatocyte growth factor (HGF) expression. Our results underscore the vital role of primitive macrophages in the long-term vascularization of cardiac tissues, offering insights for therapy and advancing heart-on-a-chip technologies.

Keywords: blood vessels; cardiac tissue; cardiomyocyte; endothelial cells; myocardium; organ-on-a-chip; pluripotent stem cell; primitive macrophages; resident macrophage; vascularization.


Conflict of interest statement

Declaration of interests M.R. and Y.Z. are inventors on an issued patent that describes Biowire technology. This patent is licensed to Valo Health. M.R. and Y.Z. receive licensing revenue.

Figures

Figure 1:
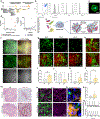
Figure 1:. Establishment of microvasculature by co-culture of endothelial and stromal cells.
a) Schematics of the culture conditions of the tissues presented in this figure, ECs (1) or ECs and DPSCs (2) were cultured within a 3D fibrin hydrogel, incorporating DPSCs to the cell culture enables vessel stabilization over two weeks of culture. b) Representative images of day 6,11 and 14 live imaging of GFP+ EC monoculture and EC/DPSC co-culture within the fibrin hydrogel (GFP+ ECs shown in green). Scale bar=50 μm. (c-e) Quantification of vessel properties presented in b: c) vessel elongation, quantified by the eccentricity parameter, d) average vessel length, e) number of junctions. (All data is presented as mean ± SD, n ≥ 3 tissues per experiment, two-way ANOVA using Tukey’s test, *P < 0.05, **P < 0.01, ***P < 0.001, ****P < 0.0001). (f-h) Representative images of immunostaining of day 14 EC vs. EC/DPSC fixed tissues of f) αSMA (red) and DAPI (blue). GFP+ ECs (green), g) Col4 (red) and DAPI (blue). Scale bar=50μm. and h) CD105 (green) and DAPI (blue), i) Principal component analysis (PCA) analysis of the genes analyzed in RNA sequencing from the two groups of tissues. j) Volcano plot of the upregulated and downregulated genes of the two groups. k) enriched pathways of the significant upregulated and l) downregulated genes. m) Heat map of the most upregulated and downregulated genes.
Figure 2:
Figure 2:. Incorporating CMs into the vascularized tissues results in cell-circuit homeostasis disruption.
a) Schematics of the culture conditions of the tissues presented in this figure, ECs and DPSCs were cultured within a 3D fibrin hydrogel, incorporating CMs (iPSC-BJ1D) to the tissues disrupts vessel formation. b) Representative imaging of day 2, 6, 8 and 10 live imaging of EC/DPSC in fibrin hydrogel with and without CMs. Scale bar=100 μm c) Representative images of immunostaining of day 10 EC/DPSC vs. EC/DPSC/CM fixed fibrin tissues of Cardiac troponin-T (red) and DAPI (blue). GFP+ ECs are presented in green. Scale bar=20 μm (d-f). Quantification of vessel properties presented in b: d) average vessel length, e) number of junctions, f) mean E lacunarity. (All data is presented as mean ± SD, n ≥ 3 tissues per experiment, two-way ANOVA using Tukey’s test, *P < 0.05, ***P < 0.001, ****P < 0.0001). g) PCA analysis of the RNA sequencing data from the two groups of tissues. h) Volcano plot of the upregulated and downregulated genes of the two groups. i) heat map of the top upregulated and downregulated genes. j) enriched pathways of the significant upregulated and downregulated genes.
Figure 3:
Figure 3:. Restoring cell-circuit homeostasis within vascularized cardiac tissues is achieved through the incorporation of primitive macrophages.
a) Schematic of human embryonic stem cells (hESC)-primitive MΦ differentiation process, b) CD45, CD14, and CCR2 FACS analysis of the C-MΦs on day 24 of differentiation. c) LYVE-1 (green) immunostaining of hESC-MΦs on day 24 of differentiation. Scale bar=10 μm. d) Left: Adjusted p-value (Padj) versus fold change of monocyte markers and cardiac-resident macrophage markers. Right: adjusted p-value (Padj) versus fold change of M1 and M2 markers, from bulk RNA sequencing of tissues incorporated with MΦs versus tissues without them. e) Schematic of the cell culture seeding procedure of the tissues presented in this figure, EC/DPSC/iPSC-BJ1D-CM were cultured within a 3D fibrin hydrogel, incorporating MΦs to the tissues, resulting in vessel stabilization. f) Low magnification live cell imaging of a fibrin 3D hydrogel seeded with EC/DPSC/CM with and without MΦs (GFP+ ECs are presented in green, RFP+ MΦs are presented in red, brightfield in gray), scale bar= 500 μm. g) Representative images of day 2, 6, 8, and 13 live-cell imaging of tissues in fibrin hydrogel with and without MΦs. (GFP+ ECs are presented in green and RFP+ MΦs are presented in red) Scale bar=100 μm. h) High magnification live cell imaging of a fibrin 3D hydrogel seeded with EC/DPSC/CM/ MΦs, white arrows demonstrate the various interactions of MΦs with the vessel network, such as bridging and wrapping. (GFP+ ECs are presented in green, and RFP+ MΦs are presented in red). Scale bar=25 μm (i-l) Quantification of vessel properties presented in g: i) average vessel length, j) mean E lacunarity, k) vessel density, and l) number of junctions. (All data are presented as mean ± SD, n ≥ 3 tissues per experiment, unpaired two-tailed t-test, *P < 0.05). m) Representative images of paraffin-embedded sections of H&E, CD31 (pink), CD68 (brown) staining of EC/DPSC/CM with and without MΦ tissues, fixed on day 10 of culture. Scale bar for H&E=50μm, Scale bar for CD31= 100μm n) Representative images of immunostaining of day 13 EC/DPSC/CM vs. EC/DPSC/CM/MΦ fixed fibrin tissues of TnT (magenta), (GFP+ ECs are presented in green) Scale bar=100 μm. o) Representative images of immunostaining of day 13 EC/DPSC/CM vs. EC/DPSC/CM/MΦ fixed fibrin tissues of TnT (yellow), MLC2V (red) and DAPI (blue), (GFP+ ECs are presented in green) Scale bar=10 μm. p) Quantification of TnT density staining; red pixels were counted and normalized to total image pixels. n≥5 tissues per group. q) Beating traces of the EC/DPSC/CM and EC/DPSC/CM/MΦs fibrin tissues.
Figure 4:
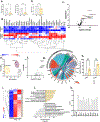
Figure 4:. Primitive macrophages improve functional properties of vascularized cardiac tissues.
a) Schematic of the cell combination simultaneously seeded in the biowire. b) Representative bright filed images of Biowire tissues seeded with EC/DPSC/CM with and without MΦ on day 14 of culture. Scale bar=500 μm. c) Representative images of paraffin-embedded tissue sections using H&E staining of Biowire tissues seeded with EC/DPSC/CM with and without MΦ, where tissues were fixed on day 14 of culture. Scale bar=100 μm. d) Representative images of paraffin-embedded sections CD31 staining (brown) of Biowire tissues seeded with EC/DPSC/CM with and without MΦ, where tissues were fixed on day 14 of culture. Scale bar=50 μm. e) Representative images of EC/DPSC/CM biowire tissues with and without MΦ at weeks 1 and 2 of culture. (GFP+ ECs shown in green and RFP+ MΦs shown in red), scale bar=100 μm. f) Representative images of CD68 (red), MLC2V (gray), and DAPI (blue) immunostaining of EC/DPSC/CM with and without MΦs tissues grown for 14 days, Scale bar=50 μm g) Right: Representative images of α-actinin (red) and DAPI (blue) immunostaining of EC/DPSC/CM with and without MΦs tissues grown for 14 days (GFP+ ECs shown in green) Scale bar=25μm, left: higher magnification of the image shown in panel d, Scale bar=5 μm. (h-k) Electrical and mechanical properties of EC/DPSC/CM with and without MΦs tissues measured on weeks 1 and 2 of culture, h) excitation threshold (ET), i) maximum capture rate (MCR), j) active force normalized to the input number of CMs, (All functional properties data are presented as mean ± SD, n >9 tissues, two-way ANOVA using Tukey’s test, *P < 0.05, **P < 0.01). k) Quantification of α-actinin density staining; red pixels were counted and normalized to total image pixels. n=3 tissues per group. All CMs in this figure are derived from iPSC-BJ1D.
Figure 5:
Figure 5:. Primitive macrophages enable the formation of perfusable patent vessels in vascularized cardiac tissues.
a) Schematic of the cell combination seeded in the iFlow plate. b) Representative BF (left) and BF and fluorescent image (right) of an entire well in the iFlow plate seeded with EC/DPSC/CM tissues with and without MΦ and cultured for 14 days. Scale bar= 500 μm for the large images and 100 μm for the inset images. (c-d) Representative images of EC/DPSC/CM tissues with and without MΦ seeded in the iFlow plate demonstrating perfusability with c) rhodamine-dextran (red) perfused on day 11 of culture and d) 405-polystrene beads (blue) on day 16 of culture. (GFP+ ECs are shown in green). e) Percentage of perfusable tissues. n = 4 tissues. f) Permeability measurement of Rhodamine-dextran perfusion through the tissues on day 16 of culture. g) Quantification of the percentage of vessels that were perfused with rhodamine-dextran. (All data in this figure are presented as mean ± SD, n = 4 tissues per experiment, unpaired two-tailed t-test, *P < 0.05, **P < 0.01). h) Representative images of TnT (red) and DAPI (blue) immunostaining of iFlow plate tissues fixed on day 16 of culture. (GFP+ ECs are shown in green). Scale bar=250 μm. i) Quantification of TnT staining, red pixels were counted and normalized to total image pixels. n=3 tissues per group. All CMs in this figure are derived from iPSC-BJ1D.
Figure 6:
Figure 6:. Primitive MΦs decrease cell damage markers, amplify pro-angiogenic cytokine secretome in vascularized cardiac tissues and enhance upregulation of pro-angiogenic and cardiac-associated genes demonstrated by bulk RNA sequencing.
a) ND1 and ND4 gene expressions were measured from day 14 conditioned media of EC/DPSC/CM and EC/DPSC/CM/MΦ fibrin tissues. Data are presented as mean ± SD, n = 4 tissues, unpaired two-tailed t-test, *P < 0.05, **P < 0.01. b) Measured secreted LDH from day 14 conditioned media of EC/DPSC/CM and EC/DPSC/CM/MΦ fibrin tissues. Data are presented as mean ± SD, n = 4 tissues, unpaired two-tailed t-test, **P < 0.01. c) Volcano plot of cytokines secreted from day 14 conditioned media of EC/DPSC/CM and EC/DPSC/CM/MΦ fibrin tissues. n = 4 tissues per group. d) heat map of significantly different cytokines between the two groups from plot c. e-m) RNA sequencing data was extracted from EC/DPSC, EC/DPSC/CM, and EC/DPSC/CM/MΦ fibrin tissues cultured for 10 days in vitro. n=4 tissues per group. All CMs in this figure are derived from iPSC-BJ1D. e) Principal component analysis of the two vascularized cardiac tissue groups (with and without MΦ) and a control consisting of EC/DPSC alone. f) Volcano plot of the upregulated and downregulated genes, g) Enriched pathways with the matching genes involved in the processes that are significantly upregulated in the EC/DPSC/CM/MΦ group. h) Gap junction gene expression within the two groups. Data is presented as mean ± SD, n =4 tissues per group, unpaired two-tailed t-test, **Padj< 0.01, ***Padj < 0.001. i) Heat map clustering of the three groups according to the genes that are significantly upregulated in the EC/DPSC/CM versus EC/DPSC group. j) Enriched pathways based on the significantly differentially expressed genes in i, yellow indicates upregulated pathways based on the upregulated genes, and gray represents the enriched pathways based on the downregulated genes. k) Upregulated and downregulated of statistically significant differential expression of cardiac tissue-related genes. Padj<0.05
Figure 7:
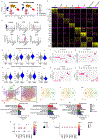
Figure 7:. snRNA sequencing indicates that primitive macrophages enhance the stability of vascularized cardiac tissues via ECM and integrin interactions, corroborating proteomic analyses.
a) UMAP plots of the two tissue conditions, EC/DPSC/CM, with and without MΦs. b) Heatmap of the DEG of each cluster. c) Selected canonical genes plotted against each cluster. d) Angiogenesis pathway score within EC, DPSC, FB, and CM. e) VEGF signaling pathway score within EC, DPSC, FB, and CM. (f-i) NicheNet analysis of the receptor ligand interactions based on the DEG analysis of the two groups where ligands are coming from MΦs and receptors from f) FB, g) DPSC, h) EC, and i) CM. (j-m) Venn diagrams of DEG from snRNA sequencing data and proteomics data considering the overlap in j) Proteomics and all cells, k) Proteomics and DPSC, l) Proteomics and FB, and m)Proteomics and EC, (n-p) Top upregulated pathways from the DEG that are present both in proteomics and snRNA sequencing data. n) Upregulated in DPSC, o) Upregulated in FB, and p) Upregulated in EC, q) Presentation of -log(Fold Change) using color gradients and -log(p-value) using dot sizes, indicating changes in selected genes from snRNA sequencing data. The data, presented in panels k-n, relate to angiogenesis, basement membrane, and VEGFR signaling, and identify the specific cells responsible for secreting each factor. r) Presentation of the -log(Fold Change) by the color gradient of dots and the -log(p-value) by the size of dots, showcasing changes in selected angiogenesis, basement membrane, and VEGFR signaling genes from the proteomics data in panels n-p.

References

    1. Montgomery M, Zhang B, and Radisic M (2014). Cardiac tissue vascularization: from angiogenesis to microfluidic blood vessels. Journal of cardiovascular pharmacology and therapeutics 19, 382–393. - PubMed
    1. Banerjee I, Yekkala K, Borg TK, and Baudino TA (2006). Dynamic Interactions between Myocytes, Fibroblasts, and Extracellular Matrix. Ann N Y Acad Sci 1080, 76–84. - PubMed
    1. Kuzuya M, and Kinsella JL (1994). Induction of endothelial cell differentiation in vitro by fibroblast-derived soluble factors. Exp Cell Res 215, 310–318. - PubMed
    1. Dick SA, Macklin JA, Nejat S, Momen A, Clemente-Casares X, Althagafi MG, Chen J, Kantores C, Hosseinzadeh S, Aronoff L, et al. (2019). Self-renewing resident cardiac macrophages limit adverse remodeling following myocardial infarction. Nature immunology 20, 29–39. 10.1038/s41590-018-0272-2. - DOI - PMC - PubMed
    1. Hulsmans M, Clauss S, Xiao L, Aguirre AD, King KR, Hanley A, Hucker WJ, Wulfers EM, Seemann G, Courties G, et al. (2017). Macrophages Facilitate Electrical Conduction in the Heart. Cell 169, 510–522 e520. 10.1016/j.cell.2017.03.050. - DOI - PMC - PubMed

Substances

LinkOut - more resources