. 2024 Jun 22;10(1):299.
doi: 10.1038/s41420-024-02032-0.

Interactomic exploration of LRRC8A in volume-regulated anion channels

Affiliations

Interactomic exploration of LRRC8A in volume-regulated anion channels

Veronica Carpanese et al. Cell Death Discov. .

Erratum in

Abstract

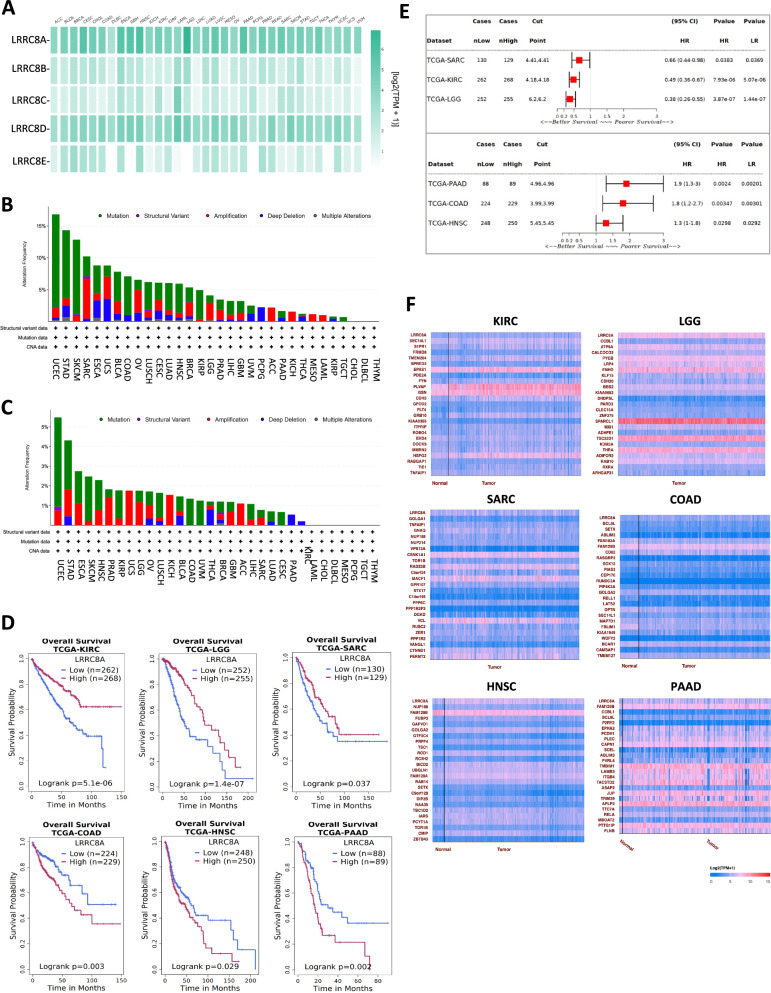
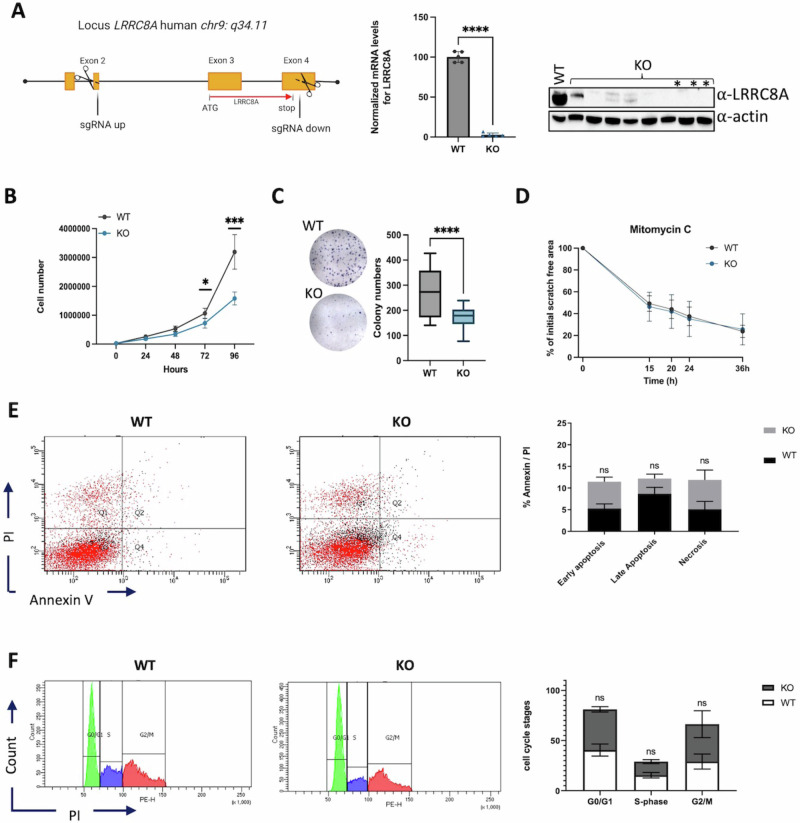
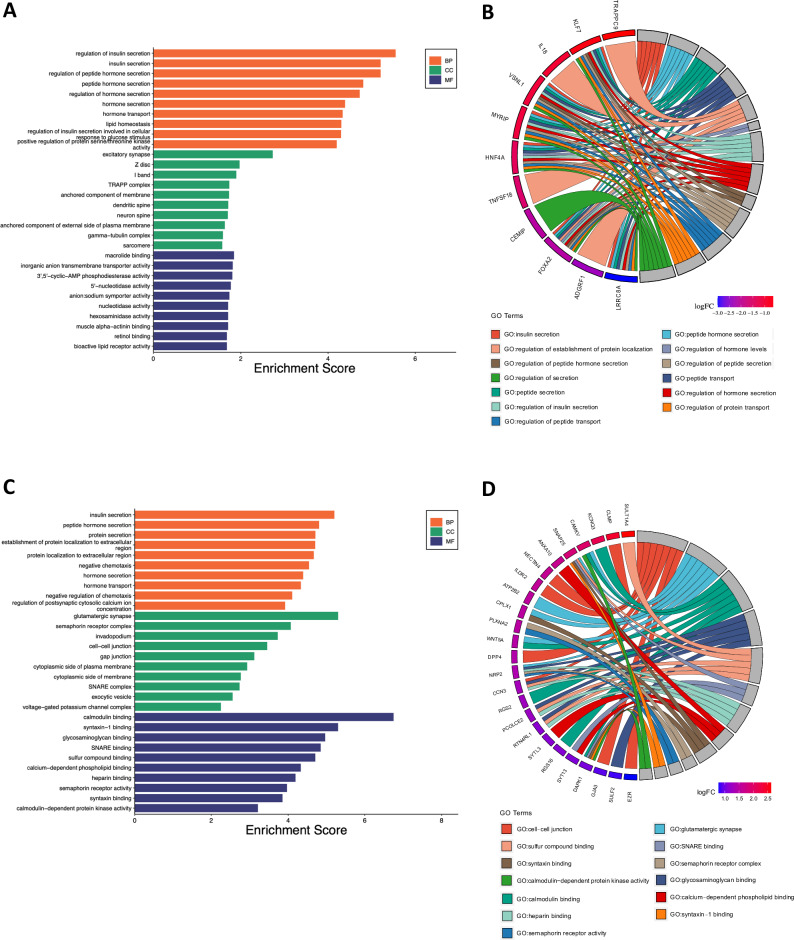
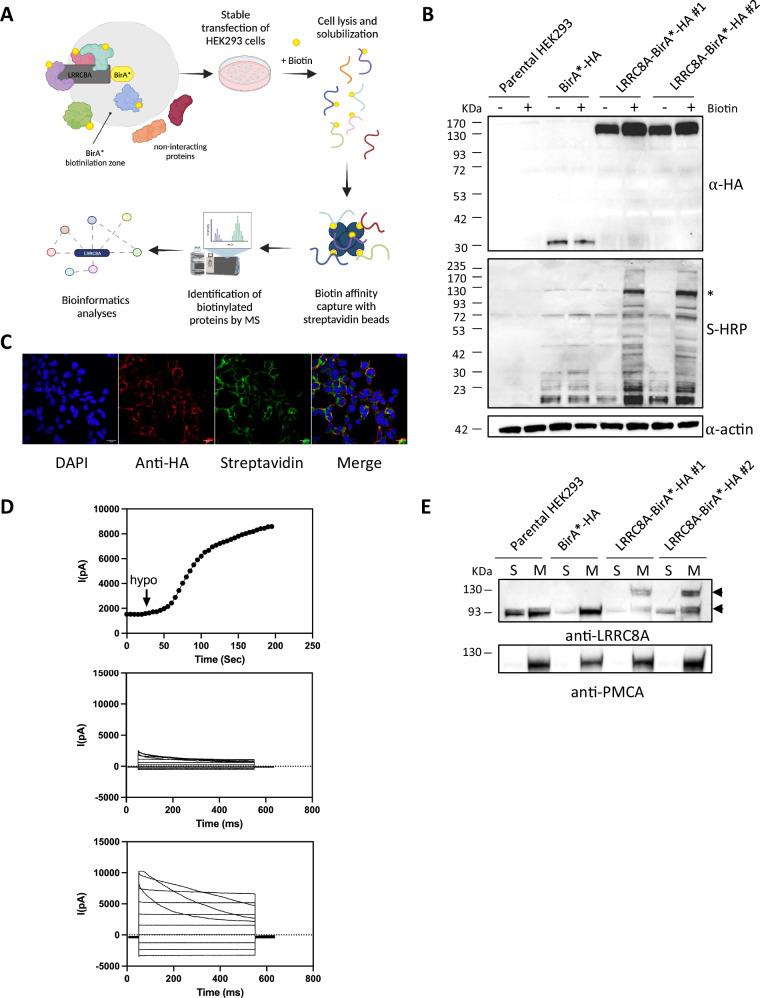
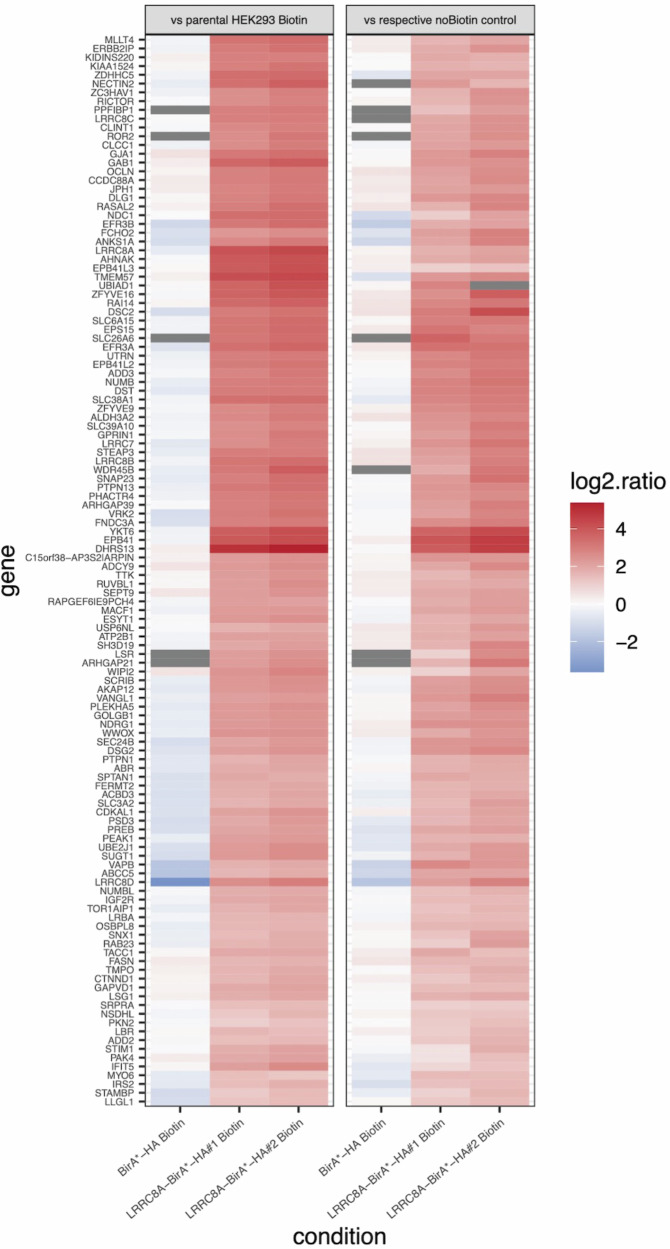
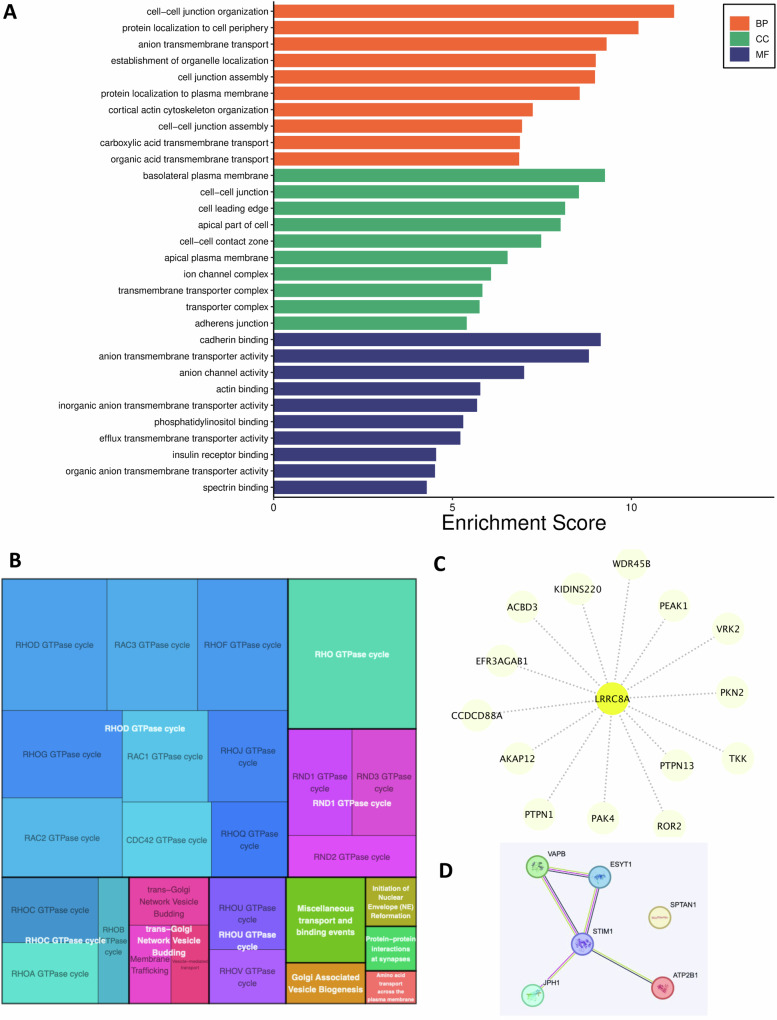
Ion channels are critical in enabling ion movement into and within cells and are important targets for pharmacological interventions in different human diseases. In addition to their ion transport abilities, ion channels interact with signalling and scaffolding proteins, which affects their function, cellular positioning, and links to intracellular signalling pathways. The study of "channelosomes" within cells has the potential to uncover their involvement in human diseases, although this field of research is still emerging. LRRC8A is the gene that encodes a crucial protein involved in the formation of volume-regulated anion channels (VRACs). Some studies suggest that LRRC8A could be a valuable prognostic tool in different types of cancer, serving as a biomarker for predicting patients' outcomes. LRRC8A expression levels might be linked to tumour progression, metastasis, and treatment response, although its implications in different cancer types can be varied. Here, publicly accessible databases of cancer patients were systematically analysed to determine if a correlation between VRAC channel expression and survival rate exists across distinct cancer types. Moreover, we re-evaluated the impact of LRRC8A on cellular proliferation and migration in colon cancer via HCT116 LRRC8A-KO cells, which is a current topic of debate in the literature. In addition, to investigate the role of LRRC8A in cellular signalling, we conducted biotin proximity-dependent identification (BioID) analysis, revealing a correlation between VRAC channels and cell-cell junctions, mechanisms that govern cellular calcium homeostasis, kinases, and GTPase signalling. Overall, this dataset improves our understanding of LRRC8A/VRAC and explores new research avenues while identifying promising therapeutic targets and promoting inventive methods for disease treatment.


Conflict of interest statement

The authors declare no competing interests.

Figures

Fig. 1
Fig. 1. LRRC8s family in human cancers.
A Differential expression of LRRC8s family in human cancers. LRRC8s multiple gene comparison was performed using TCGA and GTEx datasets and using the GEPIA database. Data were normalized as transcripts per kilobase million (TPM) values. TPM values were converted to log2-normalized transcripts per million [log2(TPM + 1)]. B Mutation frequencies of LRRC8s in 32 cancer studies were retrieved from cBioPortal (TCGA Pan-Cancer Atlas dataset). C Mutation frequencies of LRRC8A in 32 cancer studies were retrieved from cBioPortal (TCGA Pan-Cancer Atlas dataset). D Survival plots based on LRRC8A expression level in represented tumours were obtained through Kaplan–Meier analysis by sorting samples for high and low LRRC8A expression groups according to Survival Genie software. E The forest plot illustrates hazard ratio (HR) analyses. The results of the Wald test (HR P-value) and log-rank test (LR P-value) are also displayed. F LRRC8A correlated differentially expressed genes and related pathways. The top 25 positively LRRC8A co-expressed genes were mapped using the TCGA KIRC, LGG, SARC, COAD, HNSC, and PAAD datasets in the ULCAN database.
Fig. 2
Fig. 2. Characterization of LRRC8A knockout HCT116 cells.
A Strategy of CRISPR/Cas9 editing applied for LRRC8A and characterization of LRRC8A KO HCT116 cells. KO-LRRC8A monoclonal HCTT16 cell lines were isolated and evaluated for the expression of their LRRC8A gene using real-time qPCR. HCT116 WT cells were used as a control, and the housekeeping genes ACTB and TBP were employed. Gene expression data were normalised to the control and presented as a percentage variation (n = 5, one-way ANOVA, ****p < 0.0001). In addition, the α-LRRC8A antibody was used to assess the protein expression of LRRC8A, with HCT116 WT cells as the control. Protein extracts (50 μg) were loaded for each sample, with actin serving as the loading control. Single clones indicated by a red asterisk were selected for further analysis. B Growth curves of KO- and WT-LRRC8A HCT116 cells. At the 96-hour, it was found that KO clones exhibited a lower proliferation rate compared to HCT116 WT control (n = 4, two-way ANOVA, ***p-value < 0.001). C Colony formation assay. LRRC8A-KO cells formed significantly fewer colonies compared to HCT116 WT control (n = 5, one-way ANOVA, *p-value < 0.5). D The Wound Healing Assay examined migratory capacity by measuring the percentage of the initial scratch area free at various time points (from t = 0 h to t = 36 h) using ImageJ software. In both experimental settings (mitomycin 5 μg/mL), HCT116 WT control and LRRC8A-KO clones displayed no significant differences in scratch closure speed (n = 4, two-way ANOVA). Illustrative histograms showing HCT116 WT and KO clone. Statistical analysis of independent triplicate experiments showed non-significant differences between WT and the KO cells in terms of apoptosis (E) and cell cycle (F). Data were compared by Nonparametric T- test with a significance level of p < 0.05.
Fig. 3
Fig. 3. Gene Ontology (GO) enrichment analysis of down- and up-regulated genes across three principal ontologies.
A The graph provides the enrichment scores from a Gene Ontology analysis focusing on down-regulated genes, categorized into the domains of Biological Processes (BP), Cellular Components (CC), and Molecular Functions (MF). The bars, color-coded as orange for BP, green for CC, and blue for MF, illustrate the degree of each GO term within the studied dataset. Notably, BP terms such as regulation of insulin secretion’ and ‘lipid homeostasis’ show the highest enrichment scores, indicating their significant down-regulation in the genomic profile. B The figure delineates a series of genes with their corresponding log fold changes (logFC), indicating a down-regulation in expression levels. The color-coded segments represent individual genes, while the connecting ribbons illustrate their binding to specific GO terms associated. The GO terms lists include cell-cell junctions, synaptic activity, and binding activities (such as calmodulin and glycosaminoglycan). C The chart depicts the enrichment scores derived from a GO analysis for up-regulated genes. Notably, “calmodulin-dependent protein kinase activity” in the MF category and “insulin secretion” in the BP category exhibit the highest enrichment scores, suggesting significant up-regulation in these functional areas. D The figure draws the genes with their corresponding logFC. GO terms associated with these genes are listed, including those related to cell-cell junctions, synaptic activity, and binding activities (such as calmodulin and glycosaminoglycan).
Fig. 4
Fig. 4. Expression Profiles of lncRNAs Across Various Cancer Types.
The tables systematically compare the expression profiles of long non-coding RNAs (lncRNAs) across different cancer types. A and B illustrate, respectively, the downregulated and upregulated lncRNAs in various types of cancers. Each row represents a specific lncRNA, with columns indicating detectability, expression dysregulation, alterations, and the localization of focal alterations within the genome, as identified in the CAESLG database.
Fig. 5
Fig. 5. Characterization of cells stably expressing LRRC8A-BioID fusion protein.
A Schematic representation of the BioID technique, a method for exploring protein complexes in live cells [114, 120]. Within the BioID methodology, the target protein is expressed in cells as a fusion with a specialized tagging enzyme, BirA R118G (a promiscuous mutant biotin ligase, hereinafter referred to as BirA*). This enzyme utilizes exogenous biotin to catalyse the formation of biotinoyl-5’-AMP, a highly reactive molecule that biotinylates primary amines, such as the lysine side chain, within a proximity of approximately 10 nm [121]. Subsequently, cells are lysed, and the labeled proteins are subjected to affinity purification, followed by detection through MS. The identification of pertinent biotinylated proteins is then accomplished through quantitative and statistical methodologies B Verification of BirA* activity in cells expressing LRRC8A-BirA*-HA by Western blot. The expression of the LRRC8A-BirA*-HA fusion protein was assessed using an anti-HA antibody in the absence and presence of biotin. BirA* activity in cells expressing LRRC8A-BirA*-HA was assessed by WB using streptavidin-HRP for the detection of biotinylated proteins. Activity was assessed in the presence and absence of biotin (50 μM), using HEK293 cells and cells transfected with pcDNA3.1 MCS-BirA(R118G)-HA (in the blot indicated as BirA*) as controls. Actin was used as a loading control. For each sample, 50 μg of total protein extract was loaded. C Validation of the subcellular localization of the LRRC8A-BirA*-HA protein by immunofluorescence. Nuclei were visualized by DAPI staining; α-HA antibody and Alexa Fluor 586-conjugated red-emitting secondary antibody were used to visualize LRRC8A-BirA*-HA; streptavidin-HRP was used to visualize biotinylated proteins. D Validation of LRRC8A-BirA*-HA protein channel activity by patch clamp: Representative time course of current activation upon perfusion with a hypotonic solution of cells co-expressing the 8A-BirA*-8E heteromers. E Validation of the subcellular localization of the LRRC8A-BirA*-HA protein by Western Blotting. The localization of the LRRC8A-BirA*-HA protein was assessed in the two clones and in HEK293 cells and cells transfected with pcDNA3.1 MCS-BirA(R118G)-HA using the α-LRRC8A antibody. For each sample, 50 μg of protein extract enriched with the cytoplasmic (S) or membrane (M) protein fraction was loaded. The α-PMCA antibody was used to exclude contamination of the S-fraction by proteins from the M-fraction.
Fig. 6
Fig. 6. MS results: identification of hits proteins.
Heatmap reporting the log2 fold changes as indicated in the heading (left column ratio against the parental HEK293 Biotin control and right column against the corresponding noBiotin control) for the 122 identified enriched proteins (hits).
Fig. 7
Fig. 7. Pathway analysis of the interacting proteins.
A Analysis of GO-term enrichment, showcasing the top 10 significant biological processes, molecular functions, and cellular components, respectively, derived from the 120 hit proteins. B Reactome pathway enrichment FDR < 0.05. C Cell-cell junctions exhibited the greatest enrichment in cellular components. The chart explores the range of cell-cell junction structures that contributed to this increased enrichment. D Schematic representation of calcium-related proteins identified using BioID. The figure was created using https://string-db.org.

Similar articles

Cited by

References

    1. Al-Sabi A, Abd El-Aziz TM, Yu P, Rowe AH, Wulff H. Editorial: Ion channels in health and disease. Front Physiol. 2022;13:1093210. 10.3389/fphys.2022.1093210 - DOI - PMC - PubMed
    1. Banderali U, Leanza L, Eskandari N, Gentile S. Potassium and chloride ion channels in cancer: a novel paradigm for cancer therapeutics. Rev Physiol Biochem Pharm. 2022;183:135–55.10.1007/112_2021_62 - DOI - PubMed
    1. Bachmann M, Pontarin G, Szabo I. The contribution of mitochondrial ion channels to cancer development and progression. Cell Physiol Biochem. 2019;53:63–78. 10.33594/000000198 - DOI - PubMed
    1. Checchetto V, Leanza L, De Stefani D, Rizzuto R, Gulbins E, Szabo I, Mitochondrial K. Mitochondrial K+ channels and their implications for disease mechanisms.Pharmacol Ther. 2021;227:107874. 10.1016/j.pharmthera.2021.107874 - DOI - PubMed
    1. Stoilova-McPhie S, Ali S, Laezza F. Protein-protein interactions as new targets for ion channel drug discovery. Austin J Pharmacol Ther. 2013;1:5. - PMC - PubMed