. 2024 Jun 22;15(1):5334.
doi: 10.1038/s41467-024-49232-x.

Widespread chromatin context-dependencies of DNA double-strand break repair proteins

Affiliations

Widespread chromatin context-dependencies of DNA double-strand break repair proteins

Xabier Vergara et al. Nat Commun. .

Abstract

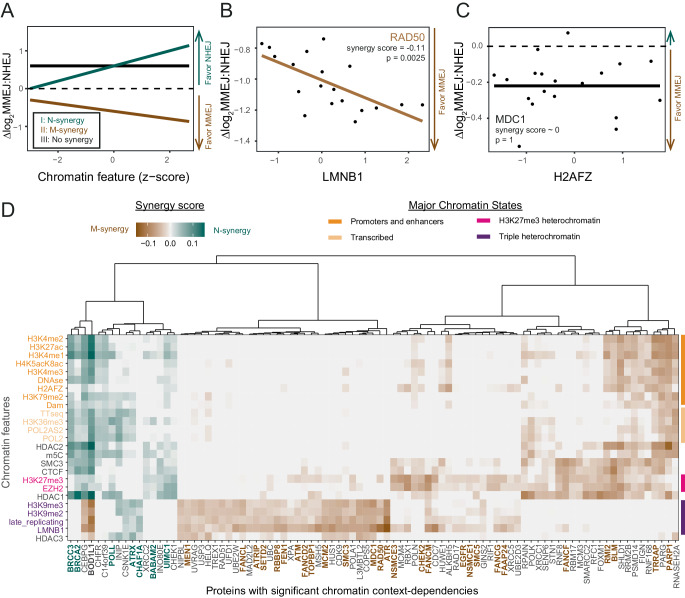
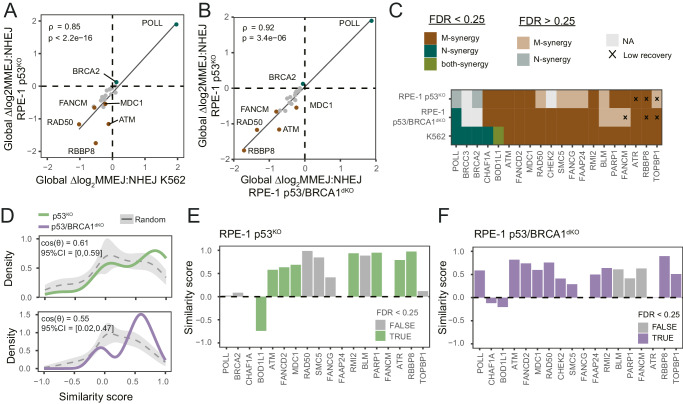
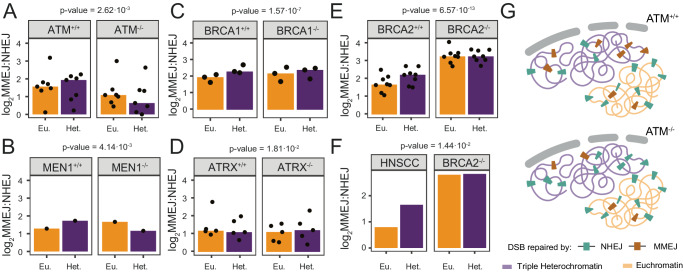
DNA double-strand breaks are repaired by multiple pathways, including non-homologous end-joining (NHEJ) and microhomology-mediated end-joining (MMEJ). The balance of these pathways is dependent on the local chromatin context, but the underlying mechanisms are poorly understood. By combining knockout screening with a dual MMEJ:NHEJ reporter inserted in 19 different chromatin environments, we identified dozens of DNA repair proteins that modulate pathway balance dependent on the local chromatin state. Proteins that favor NHEJ mostly synergize with euchromatin, while proteins that favor MMEJ generally synergize with distinct types of heterochromatin. Examples of the former are BRCA2 and POLL, and of the latter the FANC complex and ATM. Moreover, in a diversity of human cancer types, loss of several of these proteins alters the distribution of pathway-specific mutations between heterochromatin and euchromatin. Together, these results uncover a complex network of proteins that regulate MMEJ:NHEJ balance in a chromatin context-dependent manner.


Conflict of interest statement

The authors declare no competing interests.

Figures

Fig. 1
Fig. 1. Multiplexed CRISPR screen to assess chromatin context-dependencies of DNA repair proteins.
A Overview of screen design. See main text for explanation. B Volcano-plot of global ∆log2MMEJ:NHEJ scores (mean value of 19 IPRs). Horizontal dotted line shows significance threshold (FDR = 0.001). Labels mark proteins highlighted in the text. C Heatmap of levels of 25 chromatin features at the 19 IPR sites. Four major chromatin states and their defining features are highlighted in distinct colors. Source data are provided as a Source Data file.
Fig. 2
Fig. 2. CCDs of 89 DNA repair proteins.
A Illustration of M- and N-synergy concepts. For chromatin feature—protein combinations with N-synergy (I in green) ∆log2MMEJ:NHEJ scores increase as the chromatin feature levels increase. For combinations with M-synergy (II in brown) ∆log2MMEJ:NHEJ scores decrease as the chromatin feature levels increase. For combinations with no synergy (III in black) ∆log2MMEJ:NHEJ scores do not correlate with the individual chromatin features. B M-synergy example: linear fit (brown line) of RAD50 ∆log2MMEJ:NHEJ scores with LMNB1 interaction levels. Slope (synergy score) and p-value of the correlation are shown in the graph. C No synergy example: linear fit (black line) of MDC1 ∆log2MMEJ:NHEJ scores with H2AFZ levels. Slope (synergy score) and two-sided p-value of the correlation are shown in the graph. D Heatmap of synergy scores of all 89 proteins with significant CCDs. Proteins (columns) mentioned in the text are highlighted in bold. Chromatin features (rows) are colored and ordered as in Fig. 1C. Source data are provided as a Source Data file.
Fig. 3
Fig. 3. CCDs of DNA repair proteins in RPE-1 cells.
A Scatter plot of global ∆log2MMEJ:NHEJ scores in RPE-1 p53KO (y-axis) and K562 (x-axis). Spearman’s rho and two-sided p-value of the correlation are shown in the graph. Proteins highlighted in the text are shown in brown (M-synergy) or in green (N-synergy). B Same as in A but for RPE-1 p53KO (y-axis) and RPE-1 p53/BRCA1dKO (y-axis). C M- and N-synergies in RPE-1 p53KO, p53/BRCA1dKO and K562 cells of the tested 20 DNA repair proteins. M-synergies are shown in brown, N-synergies in green and both synergies in olive. Synergies detected with an FDR < 0.25 are shown in solid colors and synergies with FDR > 0.25 are shown in lighter colors. Empty values in gray represent DNA repair proteins that did not change the log2MMEJ:NHEJ balance in RPE-1 cells. M- or N-synergies marked by a X were detected in samples with low DNA recovery compared to controls samples (See Methods and Supplementary Fig. 8A). D Distribution of pairwise similarity scores for CCDs patterns across chromatin features in K562 and RPE1 p53KO cells (top) and RPE1 p53/BRCA1dKO cells (bottom). In both plots, the green/purple distributions represent similarity scores of the same protein and in gray the distribution of random protein pairs (mean ± s.d. of 1000 draws). In the top left corner of each graph, the mean similarity scores of the real distribution (cos(θ)) and 95%CI of the mean similarity scores of 1,000 random draws. E, F Pairwise similarity scores for CCD patterns of each of the proteins assayed in (E) RPE-1 p53KO cells (n = 18) and (F) RPE-1 p53/BRCA1dKO cells (n = 18). Columns in green or purple represent M- or N-synergies with an FDR < 0.25 and in gray synergies with an FDR > 0.25. Source data are provided as a Source Data file.
Fig. 4
Fig. 4. Proteins that physically interact tend to have similar CCD patterns.
A Distributions of pairwise similarity scores for CCD patterns across the 25 chromatin features, between interacting proteins (red; 118 pairs) and between randomly picked protein pairs (mean ± s.d. of 1,000 draws of 118 random pairs). B Mean similarity score of 118 interacting protein pairs (red line) compared to the distribution of mean similarity scores of 1000 random draws as in (A) (gray histogram), indicating that high similarities of CCD patterns of interacting protein pairs cannot be explained by random chance (two-sided p-value = 0.0006). C Uniform Manifold Approximation and Projection (UMAP) visualization of proteins with CCDs. Each dot represents a protein, with the shape indicating the type of synergy. Color clouds show the major chromatin state that explains each CCD. Three ‘cliques’ of four interacting proteins are shown as colored quadrangles. Proteins shared between multiple cliques are marked by concentric circles with the color of each clique they are part of (DF) CCD similarity score matrix of proteins in (D) ATM clique, (E) FA clique and (F) mixed clique. GI Similarity scores of proteins in (G) ATM clique, (H) FA clique and (I) mixed clique in K562, RPE-1 p53KO and p53/BRCA1dKO cells. JN M- and N-synergies discussed in the text. Column labels are names of proteins or the inhibitor used (‘i’ suffix). Proteins or inhibitors with significant CCDs (FDRCCD < 0.05) are marked with an asterisk. Chromatin features are colored as in Fig. 1C. J ATM signaling. K Fanconi anemia complex. L SMC5/6 complex. M DNAPKcs KO and inhibition. N BRCA1-A complex. Source data are provided as a Source Data file.
Fig. 5
Fig. 5. CCD of ATM signaling in heterochromatin is independent on BRCA1.
A, B Global effect measured as ∆log2MMEJ:NHEJ scores in RPE-1 p53KO and p53/BRCA1dKO cells after (A) ATM KO and (B) ATM inhibition. P-value shown in parentheses are according to two-sided Student’s t-test. C, D Heterochromatin CCD effect measured as the estimated ∆log2MMEJ:NHEJ for every heterochromatic feature after (C) ATM KO and (D) ATM inhibition. P-value shown in parentheses are according to two-sided paired Student’s t-test. Source data are provided as a Source Data file.
Fig. 6
Fig. 6. Impact on mutation distribution in cancer genomes.
AE Total MMEJ and NHEJ signature indel log2 ratio in euchromatin (Eu.) and constitutive lamina-associated heterochromatin (Het.) in genomes of tumors with indicated genotypes. Control tumors (+/+) were tissue-matched as much as possible to the respective mutant tumors (-/-) (Supplementary Fig. 10A). Black dots represent values of individual tumor subtypes and the bars represent the median value across tissues and two-sided p-values are shown in the figure. F same as AE, but for BRCA2-/- tumors compared to genome-instable HPVneg HNSCC, which have a more similar overall mutation rate than the set in (E). G Cartoon illustrating ATM M-synergy with triple heterochromatin. In ATM+/+ tumors (topleft panel), triple heterochromatin has a higher abundance of MMEJ mutations (brown speckles) compared to NHEJ mutations (green speckles), relative to euchromatin. In ATM-/- tumors (right panel), euchromatin remains relatively unchanged, while triple heterochromatin shows a stronger reduction of MMEJ mutations than of NHEJ mutations. Source data are provided as a Source Data file.

References

    1. Scully R, Panday A, Elango R, Willis NA. DNA double-strand break repair-pathway choice in somatic mammalian cells. Nat. Rev. Mol. Cell Biol. 2019;20:698–714. doi: 10.1038/s41580-019-0152-0. - DOI - PMC - PubMed
    1. O’Neil NJ, Bailey ML, Hieter P. Synthetic lethality and cancer. Nat. Rev. Genet. 2017;18:613–623. doi: 10.1038/nrg.2017.47. - DOI - PubMed
    1. Hustedt N, Durocher D. The control of DNA repair by the cell cycle. Nat. Cell Biol. 2016;19:1–9. doi: 10.1038/ncb3452. - DOI - PubMed
    1. Schipler A, Iliakis G. DNA double-strand-break complexity levels and their possible contributions to the probability for error-prone processing and repair pathway choice. Nucleic Acids Res. 2013;41:7589–7605. doi: 10.1093/nar/gkt556. - DOI - PMC - PubMed
    1. Aymard F, et al. Transcriptionally active chromatin recruits homologous recombination at DNA double-strand breaks. Nat. Struct. Mol. Biol. 2014;21:366–374. doi: 10.1038/nsmb.2796. - DOI - PMC - PubMed

MeSH terms