. 2024 Jun 22;15(1):5318.
doi: 10.1038/s41467-024-49657-4.

Viral modulation of type II interferon increases T cell adhesion and virus spread

Affiliations

Viral modulation of type II interferon increases T cell adhesion and virus spread

Carina Jacobsen et al. Nat Commun. .

Abstract

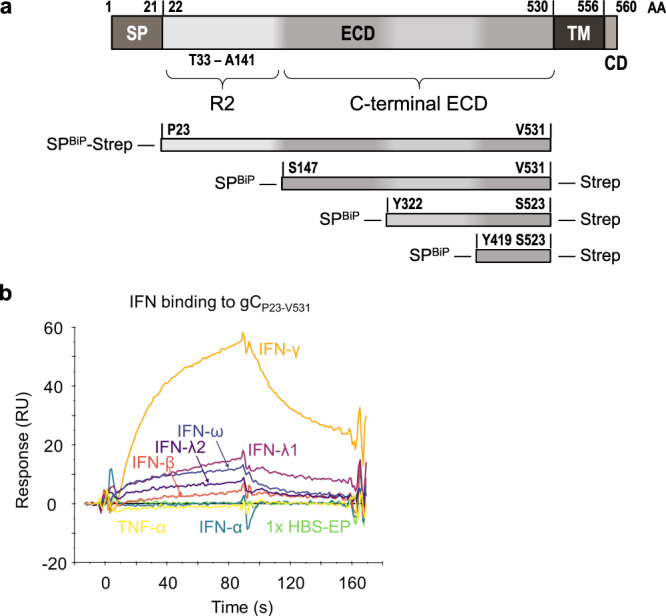
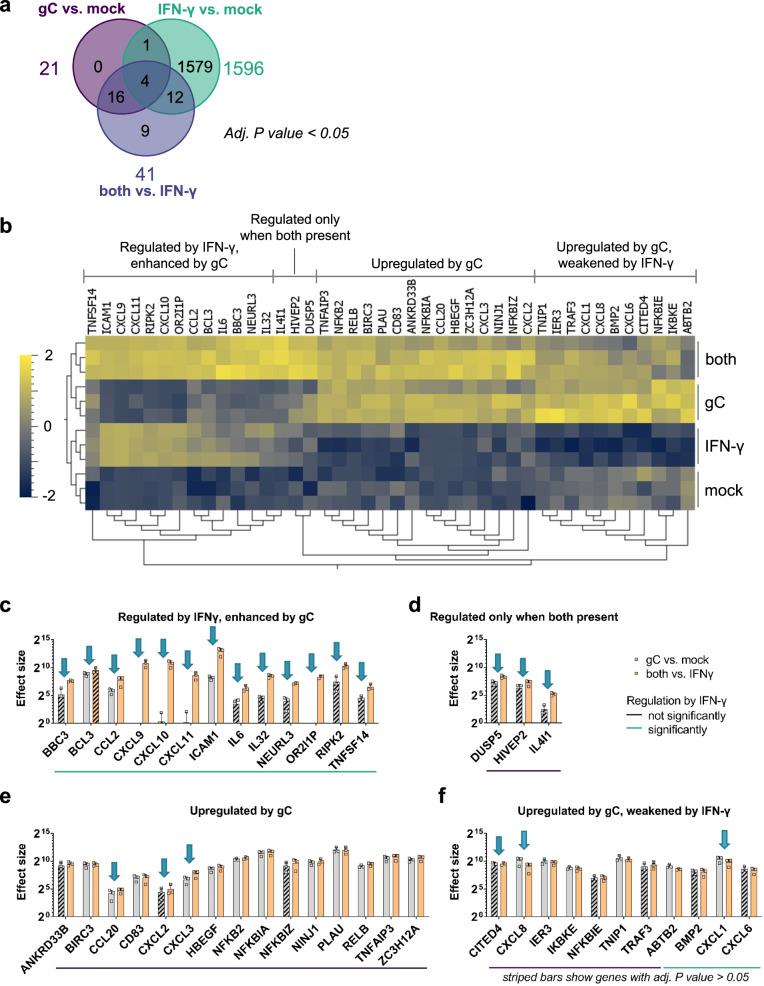
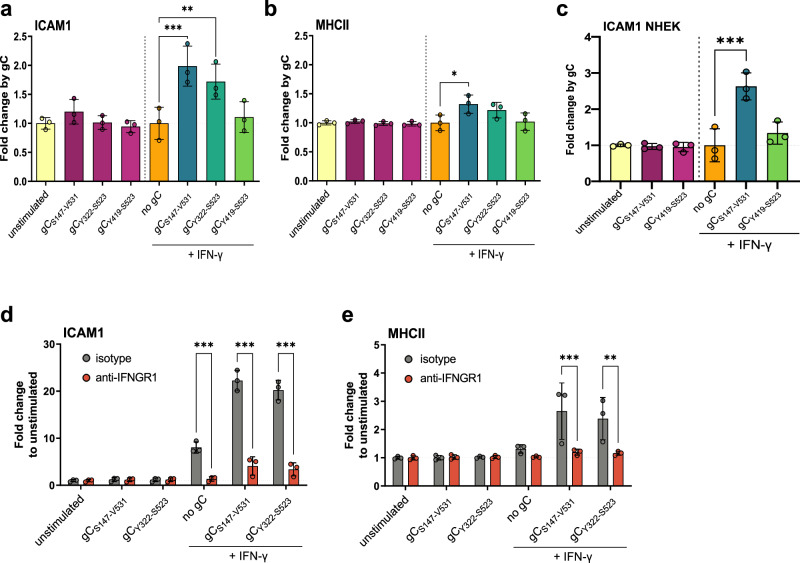
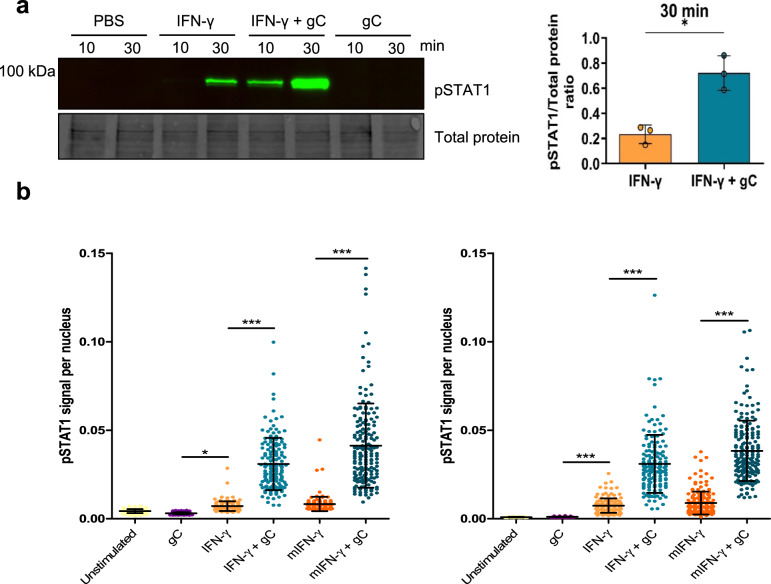
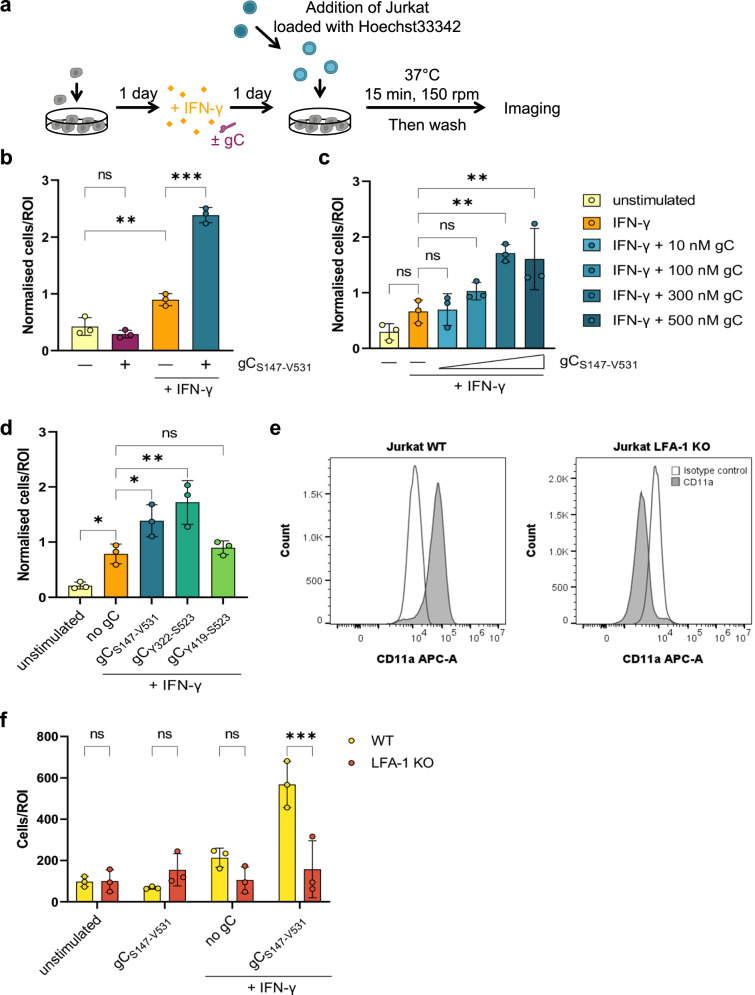
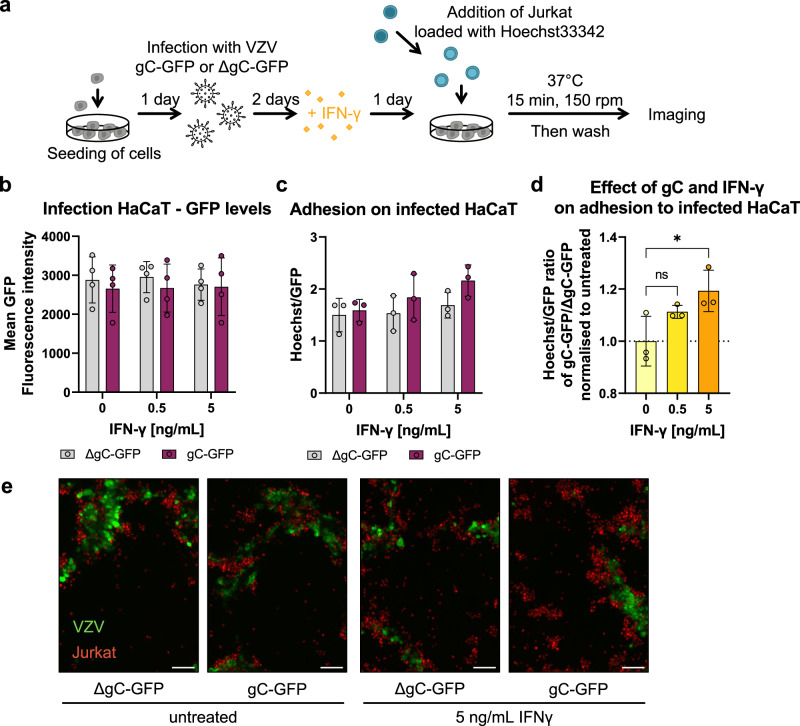
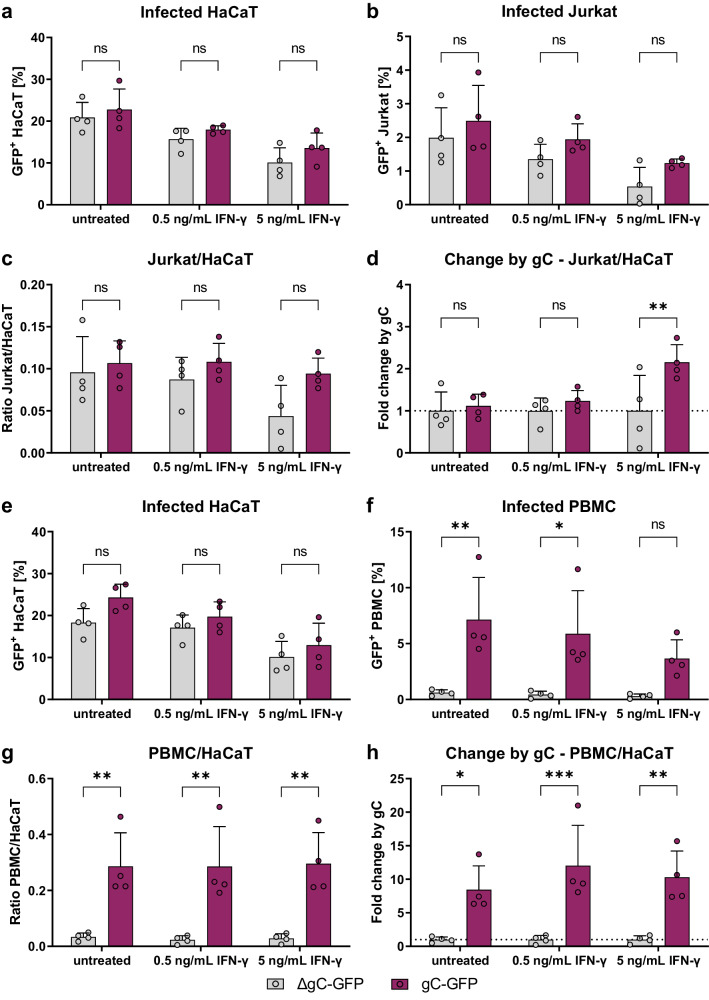
During primary varicella zoster virus (VZV) infection, infected lymphocytes drive primary viremia, causing systemic dissemination throughout the host, including the skin. This results in cytokine expression, including interferons (IFNs), which partly limit infection. VZV also spreads from skin keratinocytes to lymphocytes prior to secondary viremia. It is not clear how VZV achieves this while evading the cytokine response. Here, we show that VZV glycoprotein C (gC) binds IFN-γ and modifies its activity, increasing the expression of a subset of IFN-stimulated genes (ISGs), including intercellular adhesion molecule 1 (ICAM1), chemokines and immunomodulatory genes. The higher ICAM1 protein level at the plasma membrane of keratinocytes facilitates lymphocyte function-associated antigen 1-dependent T cell adhesion and expression of gC during infection increases VZV spread to peripheral blood mononuclear cells. This constitutes the discovery of a strategy to modulate IFN-γ activity, upregulating a subset of ISGs, promoting enhanced lymphocyte adhesion and virus spread.


Conflict of interest statement

The authors declare no competing interests.

Figures

Fig. 1
Fig. 1. VZV gC binds type II IFN.
a Schematic representation of VZV gC (top) and recombinant soluble gC constructs that were used in this study (below). All constructs contain a BiP signal peptide at the N-terminus and a Twin-Strep-tag. The first and last gC residue is indicated in each construct. The numbering of amino acid residues corresponds to the sequence of the Dumas strain. AA amino acid, SP signal peptide, ECD extracellular domain, TM transmembrane domain, CD cytoplasmic domain, R2 repeated domain 2, BiP Drosophila immunoglobulin binding chaperone protein signal sequence, Strep Twin-Strep-tag with enterokinase site for optional removal of tag. b Sensorgram showing the results of a binding screening between VZV gC and cytokines using the Biacore X100 system. The recombinant purified VZV gCP23-V531 was immobilised on a CM5 chip (3600 RU). IFNs and TNFα were injected at 100 nM with a flow rate of 10 μL/min. One representative experiment out of three biological repetitions is shown. s seconds, RU resonance units.
Fig. 2
Fig. 2. VZV gC induces biased IFN-γ-induced gene expression.
HaCaT cells were stimulated with IFN-γ, gCS147-V531, both or mock treated for 4 h. RNA was isolated and further processed for RNAseq. a Venn diagram showing the number of genes, whose expression was modified in a statistically significant manner (adjusted P value <0.05) for the three depicted comparisons. Differential gene expression analysis was performed comparing the different treatment conditions. DESeq2 was employed to analyse the RNAseq data and calculate the P values that are used in (af). b Normalised counts of genes with an adjusted (adj.) P value <0.05 for either the comparison 'gC vs. mock’ or ‘both vs. IFN-γ’ were plotted as heatmap after calculating the log2 and normalising (mean = 0, variance = 1) using Qlucore Omics Explorer 3.8. Hierarchical clustering was applied to sort for genes with similar behaviour among the treatment conditions. Genes were classified in four different groups based on their expression change upon stimulation with IFN-γ, gC or both. cf Genes with an adj. P value <0.05 for either the comparison ‘gC vs. mock’ or ‘both vs. IFN-γ’ were sorted into the four groups identified in the heatmap and the effect sizes were calculated and plotted. Arrows indicate genes that show more than a 1.5-fold change in their effect sizes between both comparisons. The coloured lines below the graphs indicate which genes were significantly regulated by IFN-γ alone. Striped bars indicate that the respective effect size was calculated from a not statistically significant regulated gene in that specific comparison. Panel (c) shows the genes regulated by IFN-γ and enhanced by gC. Panel (d) shows genes that were regulated when both were present. Panel (e) depicts genes mainly upregulated by gC alone and panel (f) includes genes that were upregulated by gC and weakened by IFN-γ. Bar charts in cf show the mean ± SD of the effect size of n = 3 biological replicates. Data in cf are provided as Source Data.
Fig. 3
Fig. 3. gC enhances IFN-γ-induced ICAM1 and MHCII protein levels at the plasma membrane via IFNGR.
ac HaCaT (a, b) cells or NHEK (c) were mock-stimulated or stimulated with 5 ng/mL IFN-γ, 300 nM VZV gC constructs or both for 24 h and then labelled with antibodies binding ICAM1, MHCII, and stained with Zombie-NIR dye. Cells were analysed by flow cytometry and median fluorescence intensities were determined after gating on single alive cells. Bar charts show the fold change of mean ± SD of ICAM1 (a, c) or MHCII (b) surface protein levels induced by gC constructs to either unstimulated or IFN-γ baseline. Each symbol in the graphs shown in (a-c) corresponds to one independent biological experiment (n = 3 biological replicates). d, e HaCaT cells were pre-treated with 2 μg/mL IFNGR1-neutralising antibody or isotype control for 2 h followed by the addition of 5 ng/mL IFN-γ, 300 nM gC or both for 24 h prior to flow cytometry analysis, as described. Bar charts show the fold change mean ± SD of ICAM1 (d) or MHCII (e) levels compared to unstimulated cells. Each symbol in the graphs shown in (d, e) corresponds to one independent biological experiment (n = 3 biological replicates). One-way ANOVA, followed by Šídák’s multiple comparisons was performed (comparing condition with gC to baseline without gC (ac) and comparing between isotype and neutralising antibody (d, e)). *P < 0.033; **P < 0.002; ***P < 0.001. Data were provided as Source Data.
Fig. 4
Fig. 4. VZV gC enhances IFN-γ-induced phosphorylation of STAT1 and its nuclear translocation.
a HaCaT cells were stimulated with 5 ng/mL IFN-γ, 300 nM VZV gCS147-V531 or both and phosphorylation levels of STAT1 (pSTAT1) at Y701 were detected. A representative immunoblot out of three independent ones with its respective loading control (TCE) is depicted, as well as a graph showing the pSTAT1/TCE signal ratios for the 30 min time points (n = 3 biological replicates). The three uncropped blots from the biological replicates are shown in Source Data. The graph shows the mean ± SD and the asterisk indicates statistical significance following a two-sided unpaired t-test with Welch’s correction. b HaCaT cells were treated with either 5 ng/mL of IFN-γ produced in bacteria or mammalian cells (mIFN-γ) in the presence or absence of 300 nM gCS147-V531. pSTAT1 was detected by immunofluorescence. Representative graphs show nuclear pSTAT1 signal for the two different time points tested (10 or 30 min) from one out of two independent biological replicates (n = 2 biological replicates), except for mIFN-γ, which was performed only once. Each dot represents a nucleus and at least 140 nuclei per condition were analysed through Cell Profiler. Error bars indicate mean ± SD and asterisk indicates statistical significance following one-way ANOVA with Bonferroni’s post hoc test (*P < 0.05; ***P < 0.001). Data were provided as Source Data.
Fig. 5
Fig. 5. Co-stimulation of HaCaT cells with IFN-γ and gC increases adhesion of Jurkat cells.
a Schematic representation of the assay. HaCaT cells were seeded 1 day prior to mock-stimulation or stimulation with IFN-γ, gC or both. 24 h after stimulation, Hoechst-labelled Jurkat cells were added and allowed to adhere for 15 min at 37 °C with shaking at 150 rpm. Then, non-adhered cells were washed off and two randomly selected regions of interest (ROI) were imaged per well (triplicate per condition) using an automated microscope (Cytation3, BioTek). The nuclei from adhered cells were quantified using a CellProfiler pipeline. bd Adhered Jurkat cells per ROI plotted in a bar chart after normalisation to the overall mean of adhered cells from each assay. Depicted are the comparisons between the four treatment conditions (b), the titration of the gC concentration (c), and the comparison of the different gC constructs (d). If not stated otherwise, 5 ng/mL IFN-γ and 300 nM gC were used. Shown is the mean ± SD. Filled circles represent the values from each independent assay (n = 3 biological replicates in bd). Ordinary one-way ANOVA followed by Šídák’s multiple comparisons test (b, to test for preselected pairs) or followed by Dunnett’s multiple comparisons test (c and d, to test each against a control = IFN-γ) were performed. e Histograms showing expression of lymphocyte function-associated antigen 1 (LFA-1, CD11a) in Jurkat WT (left) and LFA-1 knockout (KO) cells. f Adhesion assay comparing wild-type (WT) Jurkat cells to LFA-1 KO Jurkat cells. Adhered cells per ROI are plotted in a bar chart. Shown is the mean ± SD. Filled circles represent the mean values from each independent assay (n = 3 biological replicates, performed in triplicates with 2 ROI per well). Two-way ANOVA followed by Šídák’s multiple comparisons test (to test between the two cell types) was performed. ns not significant; *P < 0.033; **P < 0.002; ***P < 0.001. Data in bf were provided as Source Data.
Fig. 6
Fig. 6. Jurkat cells adhere better to cells infected with the VZV-gC-GFP virus than with VZV-ΔgC-GFP.
a Schematic representation of the assay. HaCaT cells were seeded 24 h prior to infection with VZV pOka expressing GFP fused to gC (gC-GFP) or expressing GFP instead of gC (ΔgC-GFP). 48 h after infection, the cells were stimulated with IFN-γ or mock-treated. The next day, Hoechst-labelled Jurkat cells were added and allowed to adhere for 15 min at 37 °C on a shaking platform at 150 rpm. Then, non-adhered cells were washed off and two randomly selected regions of interest (ROI) were imaged per well (triplicate per condition) using an automated microscope (Cytation3, BioTek) and the mean Hoechst and GFP intensities were determined. bd Each circle corresponds to one independent experiment (n = 4 biological experiments in (b) and 3 in (c and d)). Shown are the mean ± SD of the independent experiments. b Graph showing mean GFP fluorescence intensity obtained from HaCaT cells infected with VZV-gC-GFP or VZV-ΔgC-GFP and incubated or not with IFN-γ. c Bar chart showing the amount of adhered Jurkat cells normalised to the amount of infected HaCaT cells (Hoechst/GFP ratio) in the presence or absence of IFN-γ. d Graph showing the Hoechst/GFP ratio from HaCaT cells infected with VZV-gC-GFP divided by that of HaCaT cells infected with VZV-ΔgC-GFP and normalised to the mock-treated condition. Ordinary one-way ANOVA followed by Dunnett’s multiple comparisons test (to test each against a control = no IFN-γ). ns not significant; *P < 0.033; **P < 0.002; ***P < 0.001. Data in bd are provided as Source Data. e Representative fluorescence microscopy images of Jurkat and HaCaT cells in the four experimental conditions. The GFP signal corresponding to productive infection is depicted in green, whereas the adhered Hoechst positive cells are shown in red. The scale bar corresponds to 100 µm.
Fig. 7
Fig. 7. VZV-gC-GFP spreads more efficiently from HaCaT cells to Jurkat cells and PBMCs than VZV-ΔgC-GFP.
Quantification of infected HaCaT, Jurkat cells and PBMCs by flow cytometry. Each symbol in the graphs (ah) corresponds to one independent biological experiment (n = 4 biological replicates) depicted as mean ± SD. Magenta indicates cultures infected with VZV-gC-GFP and grey indicates VZV-ΔgC-GFP infected cultures. a, b Percentages of GFP+ HaCaT cells (a) and GFP+ Jurkat cells (b) after co-culture are plotted as bar charts. c Ratio of GFP+ Jurkat cells to GFP+ HaCaT cells is plotted as bar chart. d The fold change attributed to the presence of gC is plotted as a bar chart. e, f Percentages of GFP+ HaCaT cells (e) and GFP+ PBMCs (f) after co-culture are plotted as bar charts. g Ratio of GFP+ PBMCs to GFP HaCaT cells is plotted as bar chart. h The fold change attributed to the presence of gC is plotted as a bar chart. Two-way ANOVA followed by Šídák’s multiple comparisons test (to test between the two viruses) was performed in all experiments. ns not significant; *P < 0.033; **P < 0.002; ***P < 0.001. Data were provided as Source Data.

Update of

References

    1. Ku CC, Padilla JA, Grose C, Butcher EC, Arvin AM. Tropism of varicella-zoster virus for human tonsillar CD4(+) T lymphocytes that express activation, memory, and skin homing markers. J. Virol. 2002;76:11425–11433. doi: 10.1128/JVI.76.22.11425-11433.2002. - DOI - PMC - PubMed
    1. Moffat JF, Stein MD, Kaneshima H, Arvin AM. Tropism of varicella-zoster virus for human CD4+ and CD8+ T lymphocytes and epidermal cells in SCID-hu mice. J. Virol. 1995;69:5236–5242. doi: 10.1128/jvi.69.9.5236-5242.1995. - DOI - PMC - PubMed
    1. Abendroth A, Morrow G, Cunningham AL, Slobedman B. Varicella-zoster virus infection of human dendritic cells and transmission to T cells: implications for virus dissemination in the host. J. Virol. 2001;75:6183–6192. doi: 10.1128/JVI.75.13.6183-6192.2001. - DOI - PMC - PubMed
    1. Sen N, et al. Single-cell mass cytometry analysis of human tonsil T cell remodeling by varicella zoster virus. Cell Rep. 2014;8:633–645. doi: 10.1016/j.celrep.2014.06.024. - DOI - PMC - PubMed
    1. Ku CC, et al. Varicella-zoster virus transfer to skin by T Cells and modulation of viral replication by epidermal cell interferon-alpha. J. Exp. Med. 2004;200:917–925. doi: 10.1084/jem.20040634. - DOI - PMC - PubMed

MeSH terms

Substances