. 2024 Jun 22;15(1):5321.
doi: 10.1038/s41467-024-49741-9.

Increased reactivity of the paraventricular nucleus of the hypothalamus and decreased threat responding in male rats following psilocin administration

Affiliations

Increased reactivity of the paraventricular nucleus of the hypothalamus and decreased threat responding in male rats following psilocin administration

Devin P Effinger et al. Nat Commun. .

Abstract

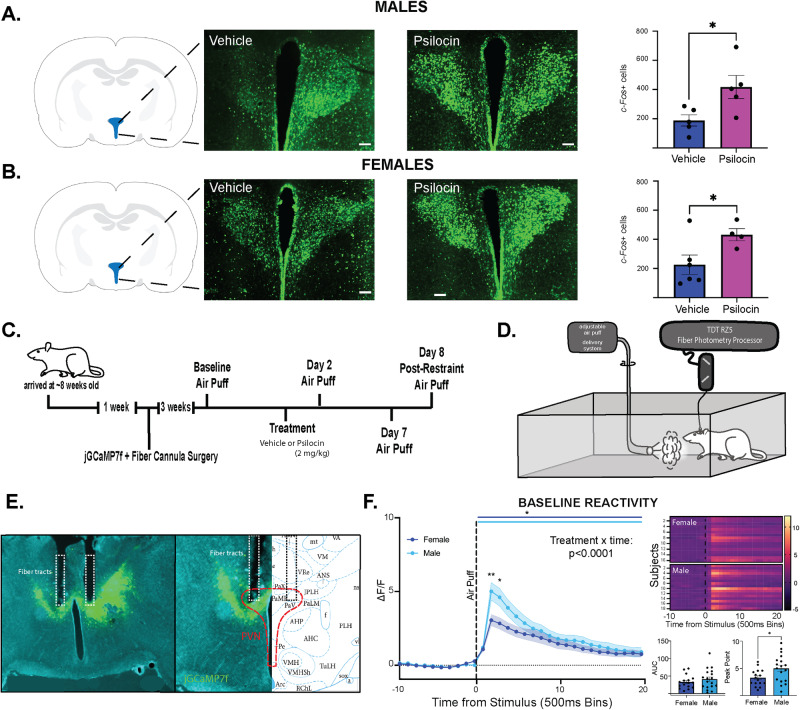
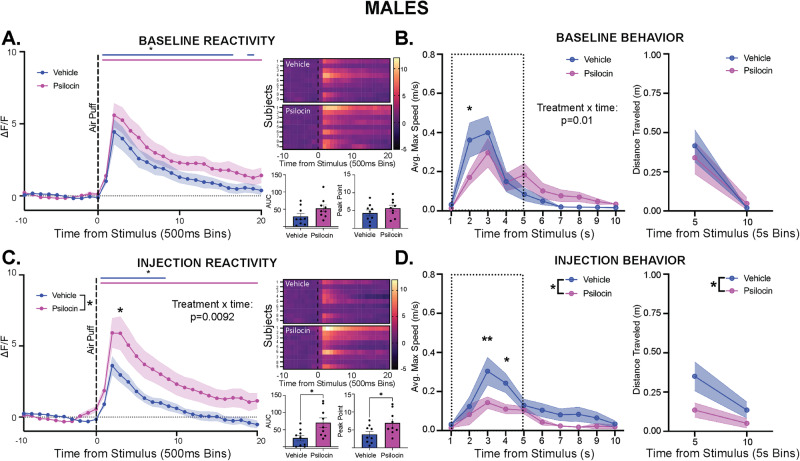
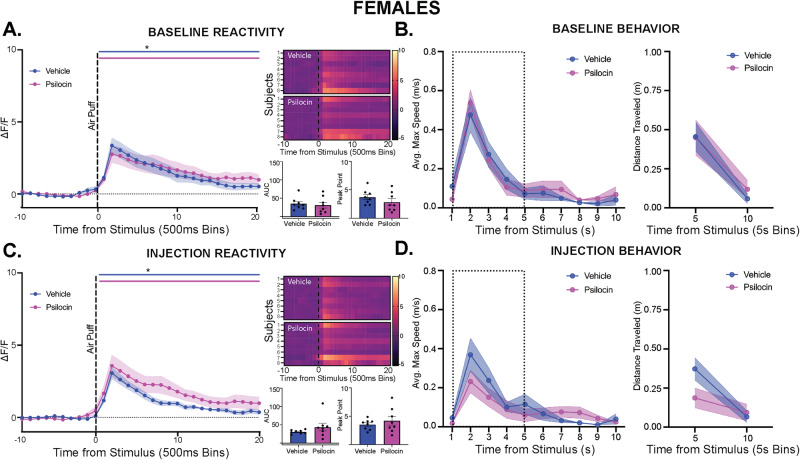
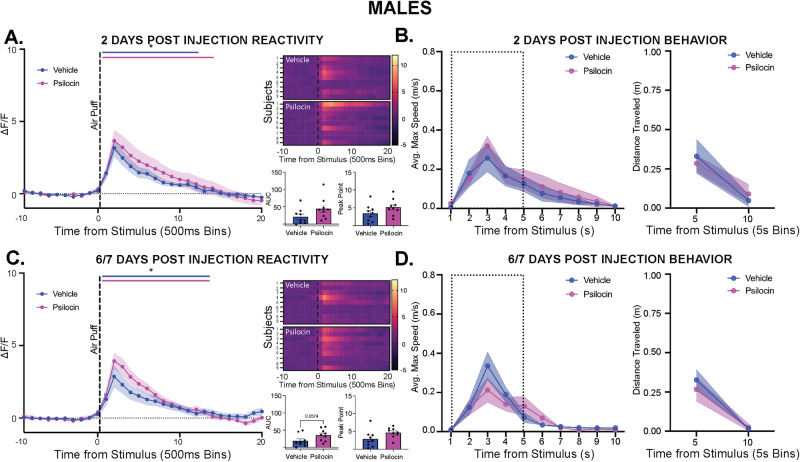
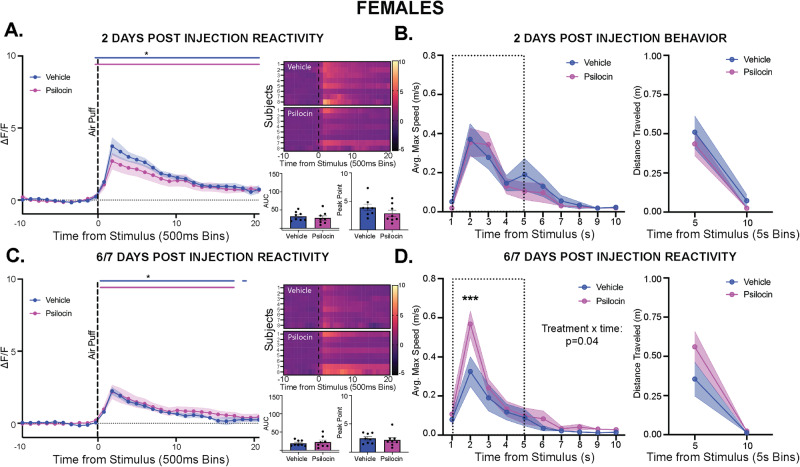
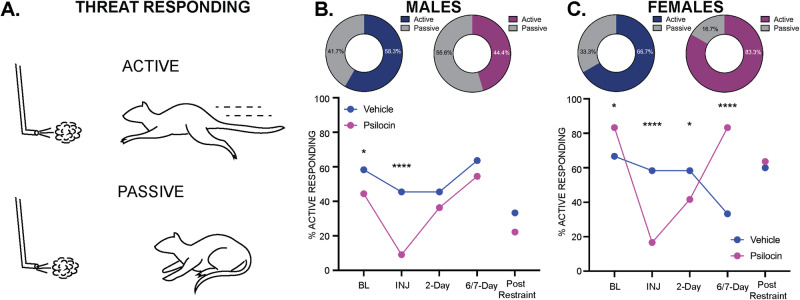
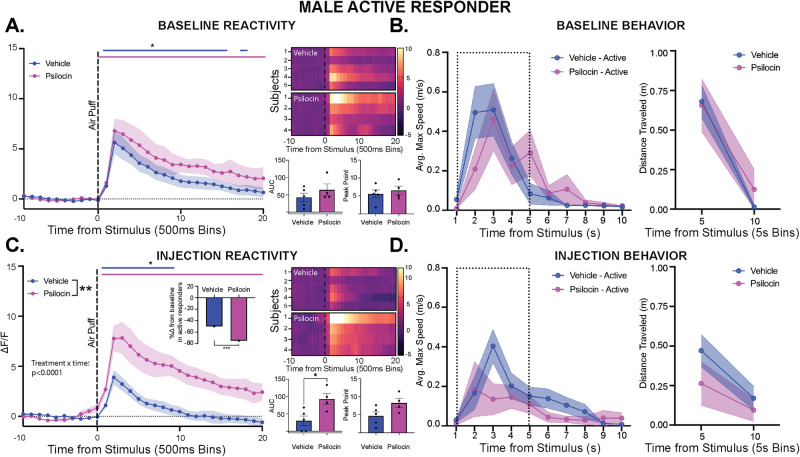
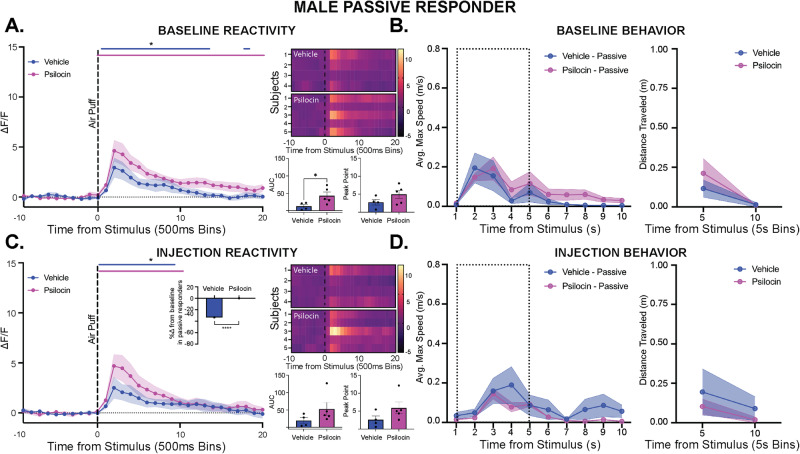
Psychedelics have experienced renewed interest following positive clinical effects, however the neurobiological mechanisms underlying effects remain unclear. The paraventricular nucleus of the hypothalamus (PVN) plays an integral role in stress response, autonomic function, social behavior, and other affective processes. We investigated the effect of psilocin, the psychoactive metabolite of psilocybin, on PVN reactivity in Sprague Dawley rats. Psilocin increased stimulus-independent PVN activity as measured by c-Fos expression in male and female rats. Psilocin increased PVN reactivity to an aversive air-puff stimulus in males but not females. Reactivity was restored at 2- and 7-days post-injection with no group differences. Additionally, prior psilocin injection did not affect PVN reactivity following acute restraint stress. Experimental groups sub-classified by baseline threat responding indicate that increased male PVN reactivity is driven by active threat responders. These findings identify the PVN as a significant site of psychedelic drug action with implications for threat responding behavior.


Conflict of interest statement

Authors have no competing interests to report.

Figures

Fig. 1
Fig. 1. Experimental details.
A Males: representative images showing c-Fos+ cells tagged with a green fluorescence protein (GFP) in the PVN. Scale bar = 100 μm. Each data point represents a single subject (average of c-Fos counts for 3 sections). Histograms display group averages +/- S.E.M. Comparisons were made using an unpaired 2-tailed t-test. Psilocin group n = 5; Vehicle group n = 5. B Females: representative images showing c-Fos+ cells tagged with a green fluorescence protein (GFP) in the PVN. Scale bar = 100 μm. Each data point represents a single subject (average of c-Fos counts for 3 sections). Histograms display group averages +/- S.E.M. Comparisons were made using an unpaired 2-tailed t-test. Psilocin group n = 4; Vehicle group n = 6. C Experimental timeline. Animals arrived at ~8 weeks old and were allowed to habituate for 1-week prior to surgeries. Bilateral injection of calcium sensor (jGCaMP7f-AAV9) and implantation of a dual tip fiber optic cannula were conducted. After allowing 3 weeks for viral transfection, animals underwent a series of fiber photometry experiments. D Illustration depicting the animal in open field box with air-puff apparatus and fiber photometry system. E Representative coronal section (left) and split cartoon schematic (right) showing fiber placement and GCaMP expression. F Baseline PVN reactivity Females (n = 16) vs. Males (n = 18): ΔF/F trace plots of changes in PVN fluorescence following exposure to a 500 ms air-puff. A 2-way ANOVA found a significant treatment x time interaction p < 0.0001. Šidák multiple comparisons found significant differences at time bin 12 (p = 0.0038) and 13 (p = 0.0140). Data points represent group averages within 500 ms binned window mean +/- S.E.M. (shaded area); Heatmaps (top right) comparing individual responses to air-puff (dotted line) in males and females. Average AUC and PP + /- S.E.M. (bottom right) compared by unpaired t-test. Each data point represents an individual subject. Comparisons were made using 2-tailed unpaired t-tests. *p < 0.05, **p < 0.01, ***p < 0.001, ****p < 0.0001. AUC = area under curve, PP = peak point, ΔF/F = change in fluorescence as a function of baseline fluorescence.
Fig. 2
Fig. 2. Acute stimulus-evoked effects of psilocin on PVN reactivity and behavior in males.
Fiber photometry: Psilocin n = 9, Vehicle n = 9; Behavior: Psilocin n = 11, Vehicle n = 12; A Baseline PVN reactivity (left): ΔF/F trace plots of changes following 500 ms air-puff. A 2-way ANOVA was performed for statistical analysis. Data points represent 500 ms binned group averages with mean +/- S.E.M (shaded area).; Heatmaps (top right) comparing individual responses to air-puff (dotted line) in vehicle and psilocin groups.); Average AUC and PP + /- S.E.M. (bottom right) compared by 2-tailed unpaired t-tests between groups. Each data point represents an individual subject. B Average maximum speed (left) and distance traveled (right) after air-puff stimulus. A 2-way ANOVA was performed for statistical analysis. Data points are group averages +/- S.E.M. (shaded area) (C) Day of injection PVN reactivity (left): ΔF/F trace plots of changes following 500 ms air-puff. A 2-way ANOVA found a significant treatment x time interaction (p = 0.0092) and a main effect of treatment (p = 0.0340). Šidák multiple comparisons found significant differences at time bin 13 (p = 0.0149). Data points represent group averages within 500 ms binned window +/- S.E.M. (shaded area); Heatmaps (top right) comparing individual responses to air-puff (dotted line) in vehicle and psilocin groups. Average AUC and PP + /- S.E.M. (bottom right) compared by 2-tailed unpaired t-test with a significant difference in AUC (p = 0.0129) and PP (p = 0.0330) between groups. Each data point represents an individual subject. D Average maximum speed (left) and distance traveled (right)after air-puff stimulus. A 2-way ANOVA found a main effect of treatment (p = 0.0208). Data points are group averages +/- S.E.M (shaded area). In each trace bin plot, a significant increase in ΔF/F was determined whenever the lower bound of the 99% CI was >0 with statistical significance shown as colored lines above each ΔF/F curve with colors corresponding to the respective binned traces. *p < 0.05, **p < 0.01, *** p < 0.001, **** p < 0.0001. AUC = area under curve, PP = peak point, ΔF/F = change in fluorescence as a function of baseline fluorescence, CI = confidence interval.
Fig. 3
Fig. 3. Acute stimulus-evoked effects of psilocin on PVN reactivity and behavior in females.
Fiber photometry: Psilocin n = 8, Vehicle n = 8; Behavior: Psilocin n = 12, Vehicle n = 12; A Baseline PVN reactivity (left): ΔF/F trace plots of changes following 500 ms air-puff. Comparisons were made using a 2-way ANOVA. Data points represent 500 ms binned group averages with mean +/- S.E.M. (shaded area); Heatmaps (top right) comparing individual responses to air-puff (dotted line) in vehicle and psilocin groups. Average AUC and PP + /- S.E.M. (bottom right) compared by 2-tailed unpaired t-tests between groups. Each data point represents an individual subject. B Average maximum speed (left) and distance traveled (right) after air-puff stimulus. A 2-way ANOVA was performed for statistical analysis. Data points are group averages + /- S.E.M. (shaded area) (C) Day of injection PVN reactivity (left): ΔF/F trace plots of changes following exposure to 500 ms air-puff. A 2-way ANOVA was performed for statistical analysis. Data points represent group averages within 500 ms binned window +/- S.E.M. (shaded area); Heatmaps (top right) comparing individual responses to air-puff (dotted line) in vehicle and psilocin groups.; Average AUC and PP + /- S.E.M (bottom right) compared by 2-tailed unpaired t-tests between groups. Each data point represents an individual subject. D Average maximum speed (left) and distance traveled (right) after air-puff stimulus. Comparisons were made using a 2-way ANOVA. Data points are group averages +/- S.E.M (shaded area). In each trace bin plot, a significant increase in ΔF/F was determined whenever the lower bound of the 99% CI was >0 with statistical significance shown as colored lines above each ΔF/F curve with colors corresponding to the respective binned traces. *p < 0.05, **p < 0.01, ***p < 0.001, ****p < 0.0001. AUC = area under curve, PP = peak point, ΔF/F = change in fluorescence as a function of baseline fluorescence, CI = confidence interval.
Fig. 4
Fig. 4. Prolonged effects of psilocin on PVN reactivity and behavior in males.
Fiber photometry: Psilocin n = 9, Vehicle n = 9; Behavior: Psilocin n = 11, Vehicle n = 12; A 2-days post-injection PVN reactivity (left): ΔF/F trace plots of changes following exposure to a 500 ms air-puff. A 2-way ANOVA was performed for statistical analysis. Data points represent group averages within 500 ms binned window + /- S.E.M. (shaded area); Heatmaps (top right) comparing individual responses to air-puff stimulus (dotted line) in vehicle and psilocin groups. Average AUC and PP + /- S.E.M. (bottom right) compared by 2-tailed unpaired t-tests between groups. Each data point represents an individual subject. B Average maximum speed (left) and distance traveled (right) after air-puff stimulus. A 2-way ANOVA was performed for statistical analysis. Data points are group averages + /- S.E.M. (shaded area) (C) 6/7-days post-injection PVN reactivity (left): ΔF/F trace plots of changes following exposure to a 500 ms air-puff. A 2-way ANOVA was performed for statistical analysis. Data points represent group averages within 500 ms binned window + /- S.E.M. (shaded area); Heatmaps (top right) comparing individual responses to air-puff stimulus (dotted line) in vehicle and psilocin groups. Average AUC and PP + /- S.E.M. (bottom right) compared by 2-tailed unpaired t-tests between groups. Each data point represents an individual subject. D Average maximum speed (left) and distance traveled (right) after air-puff stimulus. A 2-way ANOVA was performed for statistical analysis. Data points are group averages +/- S.E.M. (shaded area). In each trace bin plot, a significant increase in ΔF/F was determined whenever the lower bound of the 99% CI was >0 with statistical significance shown as colored lines above each ΔF/F curve with colors corresponding to the respective binned traces *p < 0.05, **p < 0.01, ***p < 0.001, ****p < 0.0001. AUC = area under curve, PP = peak point, ΔF/F = change in fluorescence as a function of baseline fluorescence, CI = confidence interval.
Fig. 5
Fig. 5. Prolonged effects of psilocin on PVN reactivity and behavior in females.
Fiber photometry: Psilocin n = 8, Vehicle n = 8; Behavior: Psilocin n = 12, Vehicle n = 12; A 2-days post-injection PVN reactivity (left): ΔF/F trace plots of changes following exposure to a 500 ms air-puff. A 2-way ANOVA was performed for statistical analysis. Data points represent group averages within 500 ms binned window +/- S.E.M. (shaded area); Heatmaps (top right) comparing individual responses to air-puff stimulus (dotted line) in vehicle and psilocin groups. Average AUC and PP + /- S.E.M. (bottom right) compared by unpaired 2-tailed t-tests between groups. Each data point represents an individual subject. B Average maximum speed (left) and distance traveled (right) after air-puff stimulus. A 2-way ANOVA was performed for statistical analysis. Data points are group averages +/- S.E.M. (shaded area) (C) 6/7-days post-injection PVN reactivity (left): ΔF/F trace plots of changes following exposure to a 500 ms air-puff. A 2-way ANOVA was performed for statistical analysis. Data points represent group averages within 500 ms binned window +/- S.E.M. (shaded area); Heatmaps (top right) comparing individual responses to air-puff stimulus (dotted line) in vehicle and psilocin groups. H Average AUC and PP + /- S.E.M. (bottom right) compared by unpaired 2-tailed t-tests between groups. Each data point represents an individual subject. D Average maximum speed (left) and distance traveled (right) after air-puff stimulus. A 2-way ANOVA found an interaction between treatment and time (p = 0.0486). Šidák multiple comparisons revealed a significant difference at 2 seconds (p = 0.0001). Data points are group averages + /- S.E.M (shaded area). In each trace bin plot, a significant increase in ΔF/F was determined whenever the lower bound of the 99% CI was >0 with statistical significance shown as colored lines above each ΔF/F curve with colors corresponding to the respective binned traces *p < 0.05, **p < 0.01, ***p < 0.001, ****p < 0.0001. AUC = area under curve, PP = peak point, ΔF/F = change in fluorescence as a function of baseline fluorescence, CI = confidence interval.
Fig. 6
Fig. 6. Effects of psilocin on PVN reactivity following an acute stress in male and females.
A Average male (Psilocin n = 9; Vehicle n = 9) and female (Psilocin n = 11, Vehicle n = 9) plasma corticosterone levels. 2-way ANOVA revealed a main effect of sex (p < 0.0001). Each data point represents an individual subject. Mean +/- S.E.M. compared between groups. B Male post-restraint PVN reactivity (left): ΔF/F trace plots of changes following exposure to a 500 ms air-puff A 2-way ANOVA was performed for statistical analysis. Data points represent group averages within 500 ms binned window + /- S.E.M. (shaded area); Heatmaps (top right) comparing individual responses to air-puff stimulus (dotted line) in vehicle and psilocin groups. Average AUC and PP + /- S.E.M. (bottom right) compared by unpaired 2-tailed t-test between groups. Each data point represents an individual subject (Psilocin n = 7, Vehicle n = 6). C Male: Average maximum speed (left) and distance traveled (right) following air-puff stimulus. 2-way ANOVA was performed for statistical analysis. Data points are group averages + /- S.E.M. (shaded area) (Psilocin n = 9, Vehicle n = 9) (D) Female post-restraint PVN reactivity (left): ΔF/F trace plots of changes following exposure to a 500 ms air-puff. 2-way ANOVA was performed for statistical analysis. Data points represent group averages within 500 ms binned window +/- S.E.M. (shaded area); Heatmaps (top right) comparing individual responses to air-puff stimulus (dotted line) in vehicle and psilocin groups. Average AUC and PP + /- S.E.M. (bottom right) compared by unpaired 2-tailed t-test between groups. Each data point represents an individual subject. (Psilocin n = 7, Vehicle n = 5). E Female: Average maximum speed (left) and distance traveled (right) after air-puff stimulus. 2-way ANOVA was performed for statistical analysis. Data points are group averages +/- S.E.M. (shaded area) (Psilocin n = 11, Vehicle n = 9). In each trace bin plot, a significant increase in ΔF/F was determined whenever the lower bound of the 99% CI was >0 with statistical significance shown as colored lines above each ΔF/F curve with colors corresponding to the respective binned traces *p < 0.05, **p < 0.01, ***p < 0.001, ****p < 0.0001. AUC = area under curve, PP = peak point, ΔF/F = change in fluorescence as a function of baseline fluorescence, CI = confidence interval.
Fig. 7
Fig. 7. Active vs. passive threat responding in males and females.
A Illustration depicting active vs. passive responding to the air-puff stimulus. B Males (Psilocin n = 11; Vehicle n = 12): pie chart (top) showing the proportion of active vs. passive responders at baseline. Line graph (bottom) comparing changes in the proportion of active responders in male psilocin and vehicle groups across each recording session. Each data point represents the proportion of active responders at each time period. Statistical analysis comparisons utilized a 2-sided Fisher’s exact test found significant differences between groups at baseline (p = 0.0127) and injection (p < 0.0001). C Females (Psilocin n = 12; Vehicle n = 12): pie chart (top) showing the proportion of active vs. passive responders at baseline. Line graph (bottom) comparing changes in the proportion of active responders in male psilocin and vehicle groups across each recording session. Each data point represents the proportion of active responders at each time period. Statistical analysis comparisons using a 2-sided Fisher’s exact test found significant differences between groups at baseline (p = 0.0138), injection (p < 0.0001), 2-day (p = 0.0336), and 7-day (p < 0.0001). *p < 0.05, **p < 0.01, ***p < 0.001, ****p < 0.0001. BL = baseline, INJ = injection.
Fig. 8
Fig. 8. Psilocin produces increases in PVN reactivity in active responding males.
Fiber photometry: Psilocin active n = 4, Vehicle active n = 5, Psilocin passive n = 5, Vehicle passive n = 4; Behavior: Psilocin active n = 4, Vehicle active n = 6, Psilocin passive n = 7, Vehicle passive n = 6; (A) Baseline PVN reactivity (left): ΔF/F trace plots of changes following exposure to a 500 ms air-puff. 2-way ANOVA was performed for statistical analysis. Data points represent group averages within 500 ms binned window +/- S.E.M. (shaded area); Heatmaps (top right) comparing individual responses to air-puff stimulus (dotted line) in vehicle and psilocin groups. Average AUC and PP + /- S.E.M. (bottom right) compared by unpaired 2-tailed t-test between groups. Each data point represents an individual subject. B Average maximum speed (left) and distance traveled (right) following air-puff stimulus. 2-way ANOVA was performed for statistical analysis. Data points are group averages +/- S.E.M. (shaded area) (C) PVN reactivity (left): ΔF/F trace plots of changes following exposure to a 500 ms air-puff. 2-way ANOVA significant treatment x time interaction (p < 0.0001) and main effect of treatment (p = 0.0091). Data points represent group averages within 500 ms binned window +/- S.E.M. (shaded area); Heatmaps (top right) comparing individual responses to air-puff stimulus (dotted line) in vehicle and psilocin groups. Average AUC and PP + /- S.E.M (bottom right) compared by unpaired 2-tailed t-test between groups, AUC (p = 0.0202). Each data point represents an individual subject. Inset: Histogram reflecting change in the proportion of active responding animals compared to baseline. 2-sided Fisher’s exact test revealed a significant difference between groups (p = 0.0004). D Average maximum speed (left) and distance traveled (right) following air-puff stimulus. 2-way ANOVA was performed for statistical analysis. Data points are group averages + /- S.E.M. (shaded area). In each trace bin plot, a significant increase in ΔF/F was determined whenever the lower bound of the 99% CI was >0 with statistical significance shown above each ΔF/F curve with colors corresponding to the respective binned traces *p < 0.05, **p < 0.01, ***p < 0.001, ****p < 0.0001. AUC = area under curve, PP = peak point, ΔF/F = change in fluorescence as a function of baseline fluorescence, CI = confidence interval.
Fig. 9
Fig. 9. Psilocin did not alter PVN reactivity in passive responding males.
Fiber photometry: Psilocin n = 5, Vehicle n = 4; Behavior: Psilocin n = 7, Vehicle n = 6; A Baseline PVN reactivity (left): ΔF/F trace plots of changes following exposure to a 500 ms air-puff. 2-way ANOVA was performed for statistical analysis. Data points represent group averages within 500 ms binned window +/- S.E.M. (shaded area); Heatmaps (top right) comparing individual responses to air-puff stimulus (dotted line) in vehicle and psilocin groups. Average AUC and PP + /- S.E.M (bottom right) compared by unpaired 2-tailed t-test between groups with a significant difference in AUC (p = 0.0468). Each data point represents an individual subject. B Average maximum speed (left) and distance traveled (right) following the air-puff stimulus. A 2-way ANOVA was performed for statistical analysis. Data points are group averages +/- S.E.M. (shaded area) (C) Day of injection PVN reactivity (left): ΔF/F trace plots of changes following exposure to a 500 ms air-puff. A 2-way ANOVA was performed for statistical analysis. Data points represent group averages within 500 ms binned window +/- S.E.M. (shaded area); Inset: Change in the proportion of passive responding animals compared to baseline (p < 0.0001) by 2-sided Fisher’s exact test. The data point reflects the reduction in percentage from the baseline for the entire group. Heatmaps (top right) comparing individual responses to air-puff stimulus (dotted line) in vehicle and psilocin groups. Average AUC and PP + /- S.E.M. (bottom right) compared by unpaired 2-tailed t-test between groups. Each data point represents an individual subject. D Average maximum speed (left) and distance traveled (right) following the air-puff stimulus. A 2-way ANOVA was performed for statistical analysis. Data points are group averages +/- S.E.M. (shaded area). In each trace bin plot, a significant increase in ΔF/F was determined whenever the lower bound of the 99% CI was >0 with statistical significance shown as colored lines above each ΔF/F curve with colors corresponding to the respective binned traces *p < 0.05, **p < 0.01, ***p < 0.001, ****p < 0.0001. AUC = area under curve, PP = peak point, ΔF/F = change in fluorescence as a function of baseline fluorescence, CI = confidence interval.

References

    1. Bogenschutz MP, Johnson MW. Classic hallucinogens in the treatment of addictions. Prog. Neuro-Psychopharmacol. Biol. Psychiatry. 2016;64:250–258. doi: 10.1016/j.pnpbp.2015.03.002. - DOI - PubMed
    1. Davis AK, et al. Effects of psilocybin-assisted therapy on major depressive disorder: a randomized clinical trial. JAMA psychiatry. 2021;78:481–489. doi: 10.1001/jamapsychiatry.2020.3285. - DOI - PMC - PubMed
    1. Johnson MW, Garcia-Romeu A, Griffiths RR. Long-term follow-up of psilocybin-facilitated smoking cessation. Am. J. drug alcohol Abus. 2017;43:55–60. doi: 10.3109/00952990.2016.1170135. - DOI - PMC - PubMed
    1. Johnson MW, Griffiths RR. Potential therapeutic effects of psilocybin. Neurotherapeutics. 2017;14:734–740. doi: 10.1007/s13311-017-0542-y. - DOI - PMC - PubMed
    1. Griffiths RR, et al. Psilocybin produces substantial and sustained decreases in depression and anxiety in patients with life-threatening cancer: A randomized double-blind trial. J. Psychopharmacol. 2016;30:1181–1197. doi: 10.1177/0269881116675513. - DOI - PMC - PubMed

MeSH terms