. 2024 Aug;38(8):1764-1776.
doi: 10.1038/s41375-024-02321-8. Epub 2024 Jun 22.

Pivotal role of the endoplasmic reticulum stress-related XBP1s/miR-22/SIRT1 axis in acute myeloid leukemia apoptosis and response to chemotherapy

Affiliations

Pivotal role of the endoplasmic reticulum stress-related XBP1s/miR-22/SIRT1 axis in acute myeloid leukemia apoptosis and response to chemotherapy

Céline Philippe et al. Leukemia. 2024 Aug.

Abstract

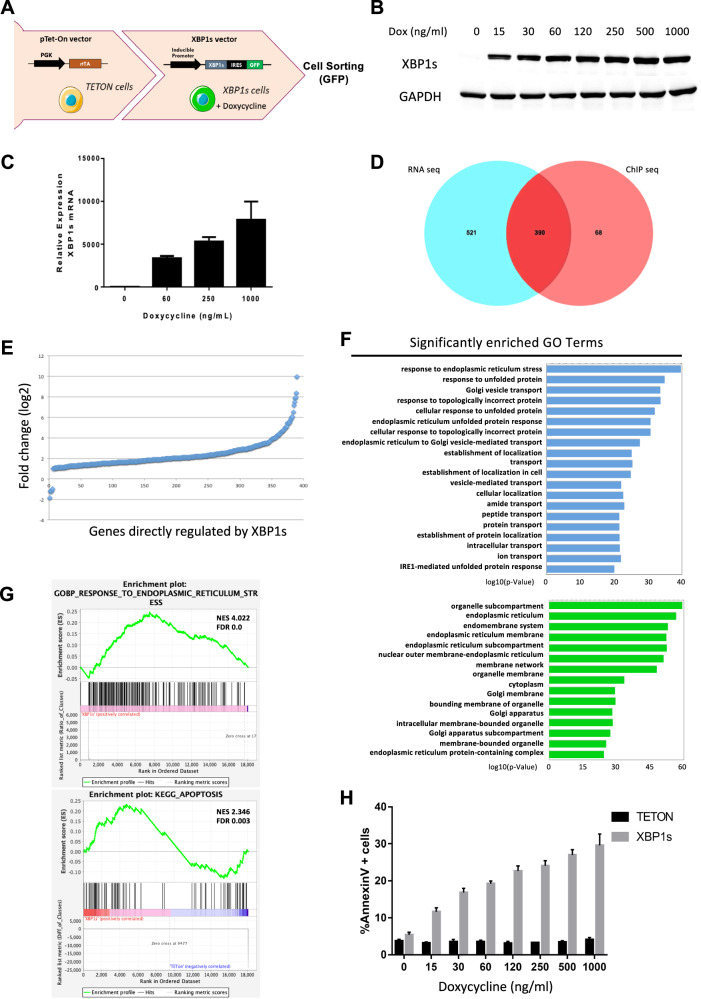
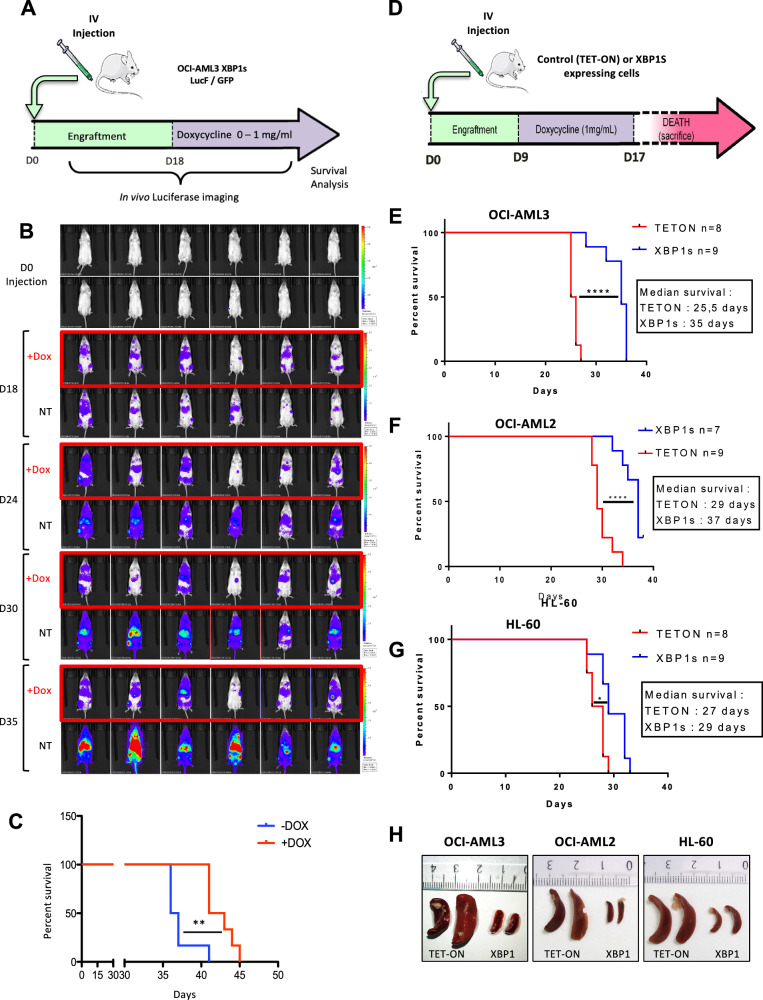
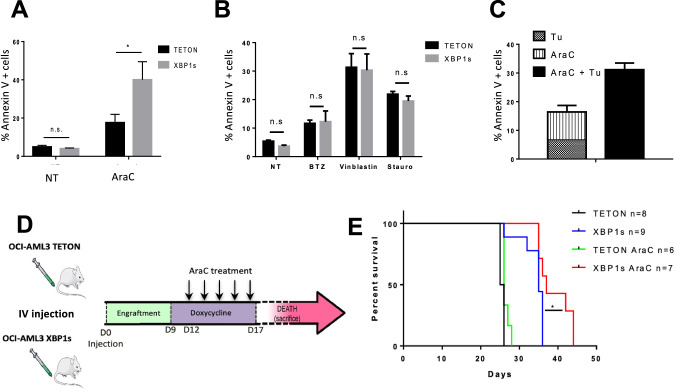
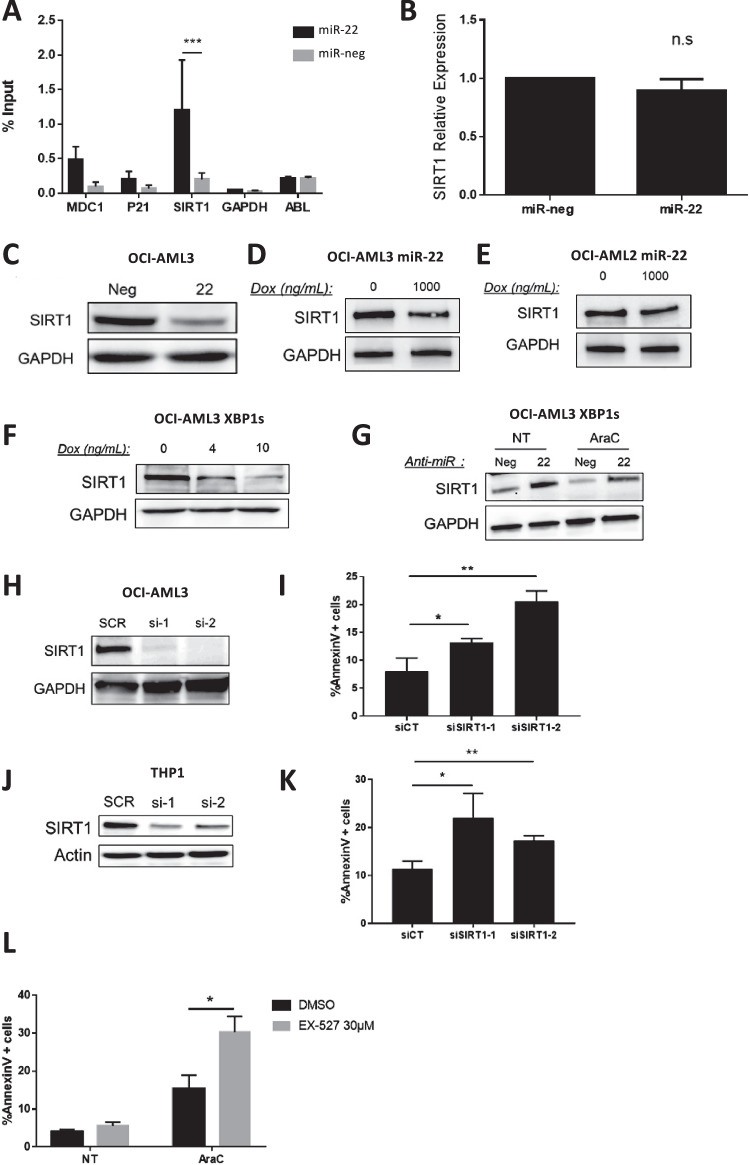
Malignant growth relies on rapid protein synthesis frequently leading to endoplasmic reticulum (ER) overload and accumulation of unfolded or misfolded protein in this cellular compartment. In the ER, protein homeostasis is finely regulated by a mechanism called the unfolded protein response (UPR), involving the activation of signalization pathways mediated by three transmembrane proteins, namely PERK, IRE1 and ATF6. IRE1 endoribonuclease activation leads in particular to the splicing of the cytosolic mRNA encoding the key UPR-specific transcription factor XBP1s. Our study shows that sustained activation of XBP1s expression in acute myeloid leukemia (AML) cells induces apoptosis in vitro and in vivo, whereas a moderate XBP1s expression sensitizes cells to chemotherapeutic treatments. ChIP-seq experiments identified specific XBP1s target genes including the MIR22HG lncRNA, the precursor transcript of microRNA-22-3p. miR-22-3p upregulation by XBP1s or forced expression of miR-22 significantly decreases cell's viability and sensitizes leukemic cells to chemotherapy. We found that miR-22-3p intracellular effects result at least partially from the targeting of the mRNA encoding the deacetylase sirtuin-1 (SIRT1), a well-established pro-survival factor. Therefore, this novel XBP1s/miR-22/SIRT1 axis identified could play a pivotal role in the proliferation and chemotherapeutic response of leukemic cells.


Conflict of interest statement

The authors declare no competing interests.

Figures

Fig. 1
Fig. 1. XBP1s expression induces apoptosis in vitro.
A Schematic of XBP1s-inducible model generation: OCI-AML3 cells were first transduced by a lentivirus expressing the rtTA doxycycline-inducible transactivator. These cells were used as “Tet-On” control cells in the following experiments. These Tet-On cells were then transduced with a lentivector expressing the XBP1s transgene followed by an IRES-eGFP cassette, under the control of a TET-inducible promoter. GFP-positive cells were sorted using flow cytometry after 24 h of doxycycline treatment. OCI-AML3 cells were treated with increasing amounts of doxycycline during 48 h. B XBP1s protein level was evaluated by western blot; GAPDH was used as loading control. C XBP1s expression was evaluated by RT-qPCR. Expression values were normalized to the housekeeping genes HPRT, MLN51 and ABL, and are depicted as a ratio of mRNA expression in doxycycline-induced cells relative to untreated cells. D Venn diagrams showing the overlap between RNA seq and ChIP seq experiments in OCI-AML3 XBP1s cells treated with 10 ng/ml of doxycycline for 48 h. The 911 genes selected in RNA seq are the ones with expression increased or inhibited by more than twofold in XBP1s cells compared to control cells. The 458 genes, shortlisted from the ChIP seq analysis, display an XBP1s peak at least at 750 bp upstream or downstream of the characterized transcription start site. E Variations in the expression level of the 390 genes showing modulated expression in OCI-AML3-XBP1s cells upon treatment with doxycycline and overlapping between RNA seq and ChIP seq experiments. F Gene ontology analysis was performed with the 390 genes up- and downregulated overlapping between RNA seq and ChIP seq experiments in OCI-AML3-XBP1s cells treated with doxycycline. G Gene set enrichment analysis (GSEA) was performed on the RNA seq full data of OCI-AML3-XBP1s cells treated with doxycycline. NES normalized enrichment score, FDR false discovery rate. H Apoptosis levels of OCI-AML3 Tet-On or OCI-AML3-XBP1s cells treated with increasing amounts of doxycycline during 48 h were measured by flow cytometry using Annexin V/PI staining. Data represent mean ± SD (n = 3).
Fig. 2
Fig. 2. Transient XBP1s expression slows tumor growth in vivo and extends mice survival.
A NSG mice (n = 6 for each group) were injected intravenously with OCI-AML3-XBP1s LucF/GFP-expressing cells. Eighteen days after engraftment, when the luciferase signal was detectable in all the animals, doxycycline was added (or not) at 1 mg/ml in the drinking water. B Leukemia development in mice was monitored by bioluminescence imaging with the IVIS Spectrum CT System (PerkinElmer) at the indicated time points. C Survival analysis of each group of mice was performed using a log-rank test (**p ≤ 0.01). D NSG mice were intravenously injected with either XBP1s-inducible AML cells or their control (Tet-On) counterparts. After a 9 days engraftment, doxycycline was added at the concentration of 1 mg/mL in drinking water during 8 days. EG Survival analyses were then performed using the log-rank test (*p ≤ 0.05; ****p ≤ 0.0001) E injection of OCI-AML3 cells F injection of OCI-AML2 cells G injection of HL60 cells. H Analysis of spleen size after euthanasia of mice in each of the control (TET-ON) or XBP1s-expressing cell models.
Fig. 3
Fig. 3. XBP1s expression induces tumor regression and cell apoptosis in vivo.
A Nude mice were grafted subcutaneously with OCI-AML3 XBP1s-expressing cells and were treated without (Ni) or with doxycycline at 2 mg/ml, 0.2 mg/mL or 0.02 mg/ml. B The mean tumor volume in mm3 was calculated over a 22-day period. Data represent mean ± SD (n = 8 for each group). Statistical analyses were performed by two-way ANOVA with Bonferroni correction (**p ≤ 0.01, ****p ≤ 0.0001). C Nude mice were injected subcutaneously with OCI-AML3 XBP1s cells. Seventeen days post injection, mice were exposed (or not), to doxycycline dissolved in their drinking water at a concentration of 2 mg/ml or 0.2 mg/mL. D The mean tumor volume in mm3 was calculated every 2 days after doxycycline treatment. Data represent mean ± SD (n = 7 for each group). Statistical analysis was performed by two-way ANOVA with Bonferroni correction (**p ≤ 0.01, ***p ≤ 0.001). E XBP1s expression, PARP and Caspase 3 cleavage were analyzed by western blotting on protein extracts from tumor samples collected at day 23 (end point) and using GAPDH as loading control. Samples 1–7 correspond to individual mice untreated with doxycycline (red curve). Samples 8–14 correspond to individual mice treated with a dose of 0.2 mg/mL of doxycycline in drinking water (black curve).
Fig. 4
Fig. 4. XBP1s expression restores sensitivity to aracytine in the chemoresistant cell line OCI-AML3, both in vitro and in vivo.
A OCI-AML3 Tet-On (control) and XBP1s received a 24 h treatment of doxycycline at 4 ng/mL, followed by a 24 h treatment with aracytine (10 µM). Percentage of apoptotic cells was measured by flow cytometry using Annexin V/PI staining. B OCI-AML3 Tet-On and XBP1s-inducible cells were treated with doxycycline (4 ng/mL) for 24 h and then with bortezomib (BTZ), vinblastine or staurosporine (Stauro), respectively, at 5 nM, 0.5 μM and 0.2 μM for 24 h or left untreated (NT). Data represent mean ± SD (n = 3). Statistical analyses were performed using unpaired t-tests; *p ≤ 0.05. C Apoptosis was assessed by Annexin V/propidium iodide (PI) staining in OCI-AML3 cells. Data represent mean ± SD (n = 3). The left side represents the apoptosis induced by tunicamycin and aracytine treatment alone. The right side represents the apoptotic response induced by a combinatorial treatment of the ER stress inducer tunicamycin and aracytine which appears significantly higher than the sum of the separate effects of each individual treatment, indicating that ER stress potentiates aracytine treatment. D Schematic of the in vivo procedure. NSG mice were injected (day 0) with 2 million of OCI-AML3 Tet-On (control) and XBP1s cells. After a 9 days engraftment, doxycycline was added at 1 mg/mL in drinking water during 8 days. At day 12, mice were daily injected intraperitoneally with aracytine at 30 mg/kg during 5 days. E Survival analyses of the treated mice were performed using a log-rank test (*p ≤ 0.05).
Fig. 5
Fig. 5. Identification of the MIR22HG lncRNA precursor of mir-22-3p as a direct target of XBP1s.
Mature mir-22-3p expression levels were assessed by RT-qPCR in OCI-AML3- (A), THP1- (B) and MOLM-14-XBP1s (C) cells treated with doxycycline. Expression values were normalized to the control let-7a microRNA, and are depicted as the relative mir-22 expression ratio in doxycycline-treated cells compared to untreated cells. Data represent mean ± SD (n = 3). D Snapshots of ChIP-Seq signals (peaks) representing XBP1s-bound genomic regions in OCI-AML3 cells treated with 10 ng/mL of doxycycline for 48H compared to the input. The MIR22 Host Gene (MIR22HG) promoter region and exons are shown. E RT-qPCR analysis of MIR22HG and DNAJB9 (positive binding control) promoter regions immunoprecipitated following ChIP assay on OCI-AML3 XBP1s cells treated with 10 ng/mL of Dox and performed using anti-XBP1 or IgG isotype control antibodies. The enrichment of target gene promoter regions is expressed in % of input. The actin B (ACT B) promoter region is used as a negative control. F Sequence logos of the consensus cis-regulatory elements discovered in XBP1s target promoter, and localization of this consensus sequence in the MIR22HG promoter region. Pearson’s correlation analyses showing gene expression levels (quantified by RT-qPCR) of XBP1s versus DNAJB9 (G), XBP1s versus MIR22HG (H) and DNAJB9 versus MIR22HG (I) in a 55-AML-patient cohort. Expression values are expressed in Delta Ct (D Ct), calculated using housekeeping genes Actin, MLN51, GAPDH and TBP. J Correlation of MIR22HG and DNAJB9 expression in 483 AML patient samples from the BEAT AML database. Expression levels are shown on Log2 scales. K Survival curves are shown for MIR22HG expression in AML using BEAT AML data. To avoid potential bias in data interpretation, we removed here the samples that were not collected at diagnosis but later after the first line of therapy, those presenting with a myelodysplastic syndrome (MDS) or a myeloproliferative neoplasm (MPN) and the samples from patients who could benefit from a transplantation (either bone marrow or cord blood cells engraftment). The Kaplan–Meier curves were finally plotted with such a homogeneous set of n = 236 patients. Low and high expression levels of MIR22HG are drawn in blue and red, respectively. The p value represents the equality of survival curves based on a log-rank test.
Fig. 6
Fig. 6. miR-22 recapitulates XBP1s-dependent phenotypes.
A OCI-AML3 cells were transfected with a mir-22 mimic (22) or a non-relevant miRNA (Neg) for 48 h. Apoptosis was then assessed by cytometry using Annexin V/PI staining. Lower panel: mean ± SD of three independent experiments. B Western blot analysis of cleaved-PARP levels following mir-22 transfection in OCI-AML3. C OCI-AML3 Tet-On cells were transduced with a lentivector expressing a dox-inducible miR-22. Transduced cells and Tet-On control cells were then treated with increasing amounts of doxycycline during 48 h. Apoptosis was measured by flow cytometry using Annexin V/PI staining. Data represent mean ± SD (n = 3). D OCI-AML3 XBP1s cells were transfected with antisense oligonucleotides against mir-22 (anti-miR-22) or non-relevant oligonucleotides (anti-miR-neg) as control. After transfection, cells were treated with increasing amounts of doxycycline. After 24 h, apoptosis was quantified. Data represent mean ± SD (n = 3). E OCI-AML3 XBP1s cells were transfected with antisense oligonucleotides against mir-22-3p (anti-miR-22) or non-relevant oligonucleotide (anti-mir-neg) as control. After transfection, cells were treated with 4 ng/mL of doxycycline to induce XBP1s expression and with aracytine (AraC), at 10 μM. Apoptosis was quantified after 24 h. Data represent mean ± SD (n = 3). Statistical analyses were performed using unpaired t-tests (**p ≤ 0.01, ***p ≤ 0.001, ****p ≤ 0,0001).
Fig. 7
Fig. 7. XBP1s/miR-22 axis inhibits SIRT1 expression and compromises leukemic cells survival.
A RT-qPCR analysis of MDC1, P21, SIRT1, GAPDH and ABL mRNA levels following an RNA pull-down with a biotinylated mir-22 mimic transfected in OCI-AML3 wild-type cells. miR-neg: non-relevant pull-down with control miRNA. GAPDH and ABL: non-target mRNA controls. Data represent mean ± SD (n = 3). OCI-AML3 cells were either transfected with a miR-22 mimic (miR-22) or a non-relevant mimic (miR-neg). SIRT1 mRNA and protein levels were determined by RT-qPCR analysis (B) and western blotting (C), respectively. For RT-qPCR, values were normalized to the expression level of the housekeeping gene ABL and are shown as relative SIRT1 mRNA expression compared to non-relevant mimic transfection. SIRT1 protein levels were determined by western blotting after miR-22 induction in OCI-AML3-miR-22 (D) and OCI-AML2-miR-22 (E) inducible cells. F SIRT1 protein levels were analyzed by western blotting in OCI-AML3 XBP1s-expressing cells treated with 4 ng/mL or 10 ng/mL of doxycycline. G SIRT1 protein level was assessed by western blotting in OCI-AML3 XBP1s treated with 4 ng/mL of doxycycline and with (or not) 10 µM aracytine treatment and transfected with an antisense oligonucleotide against miR-22-3P (anti-miR-22) or non-relevant oligonucleotide (anti-miR-neg). GAPDH was used as a loading control. HK OCI-AML3 and THP1 were transfected by two independent siRNAs directed against SIRT1 (si-1; si-2) or a non-relevant siRNA (siSCR) during 48 h. H, J siRNA efficiencies were evaluated by western blot using GAPDH or Actin as loading controls. I, K Apoptosis was measured by flow cytometry using Annexin V/PI staining. Data represent mean ± SD (n = 3). L OCI-AML3 cells were treated for 96 h with 30 µM of the SIRT1 inhibitor EX-527 or its vehicle DMSO, either with (AraC) or without (NT) aracytine treatment at 10 µM during the last 24 h. Apoptosis was measured by flow cytometry using Annexin V/PI staining. Data represent mean ± SD (n = 3). For all the presented experiments statistical analyses were performed using unpaired t-tests (*p ≤ 0.05; **p ≤ 0.01, ***p ≤ 0.001).

References

    1. Moon HW, Han HG, Jeon YJ. Protein quality control in the endoplasmic reticulum and cancer. Int J Mol Sci. 2018;19:3020. 10.3390/ijms19103020 - DOI - PMC - PubMed
    1. Hetz C. The unfolded protein response: controlling cell fate decisions under ER stress and beyond. Nat Rev Mol Cell Biol. 2012;13:89–102. 10.1038/nrm3270 - DOI - PubMed
    1. Hetz C, Papa FR. The unfolded protein response and cell fate control. Mol cell. 2018;69:169–81. 10.1016/j.molcel.2017.06.017 - DOI - PubMed
    1. Hetz C, Zhang K, Kaufman RJ. Mechanisms, regulation and functions of the unfolded protein response. Nat Rev Mol Cell Biol. 2020;21:421–38. 10.1038/s41580-020-0250-z - DOI - PMC - PubMed
    1. Ron D, Walter P. Signal integration in the endoplasmic reticulum unfolded protein response. Nat Rev Mol Cell Biol. 2007;8:519–29. 10.1038/nrm2199 - DOI - PubMed

LinkOut - more resources