. 2024 Jun 22;14(1):14384.
doi: 10.1038/s41598-024-64864-1.

Estimating the COVID-19 prevalence from wastewater

Affiliations

Estimating the COVID-19 prevalence from wastewater

Jan Mohring et al. Sci Rep. .

Abstract

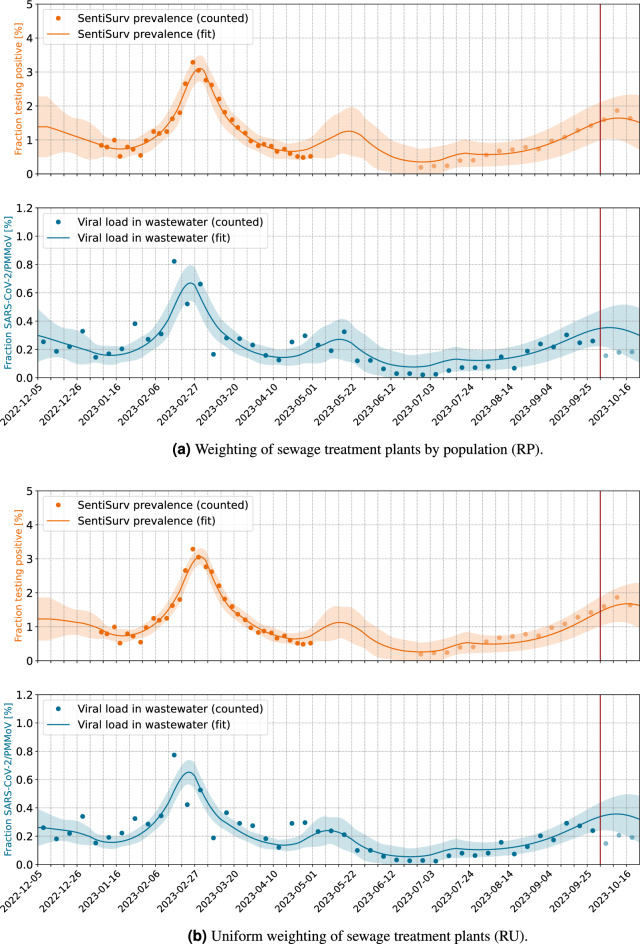
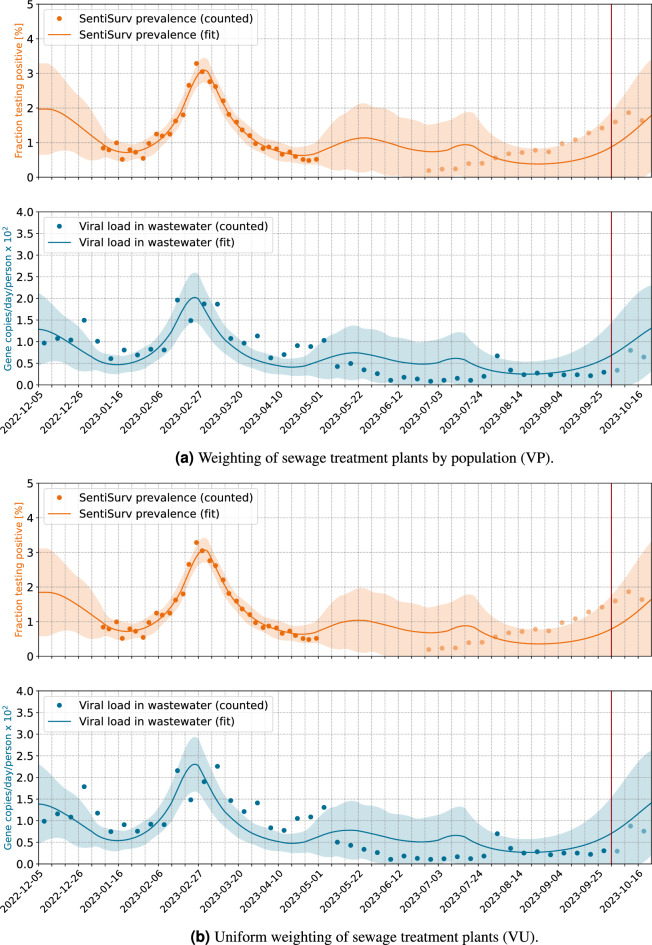
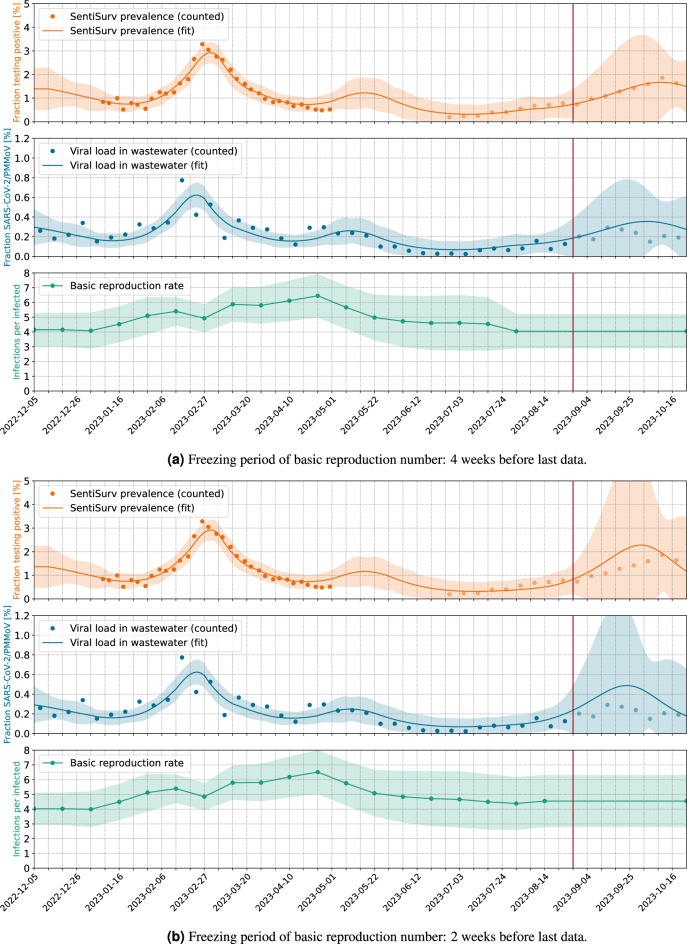
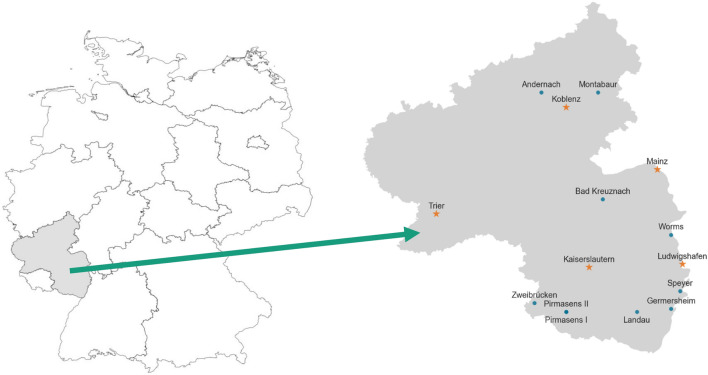
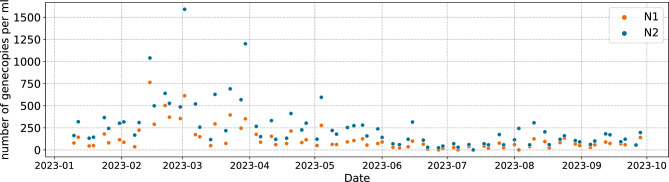
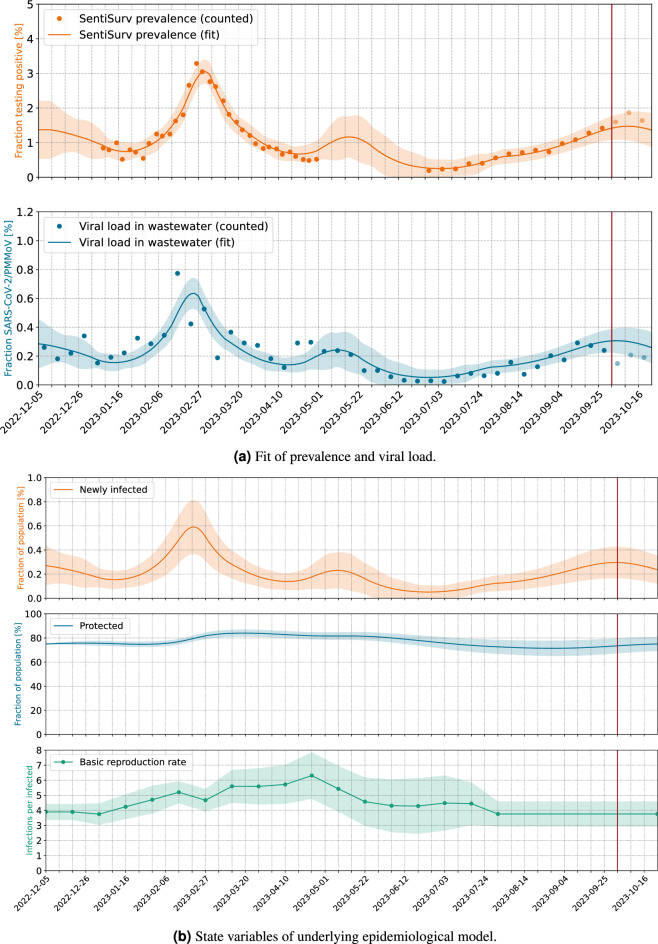
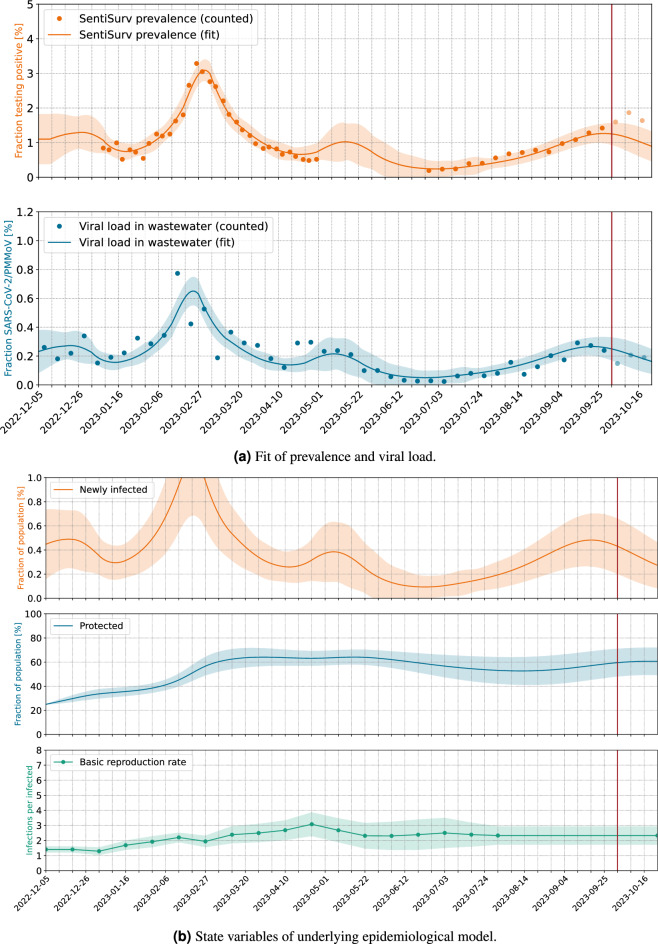
Wastewater based epidemiology has become a widely used tool for monitoring trends of concentrations of different pathogens, most notably and widespread of SARS-CoV-2. Therefore, in 2022, also in Rhineland-Palatinate, the Ministry of Science and Health has included 16 wastewater treatment sites in a surveillance program providing biweekly samples. However, the mere viral load data is subject to strong fluctuations and has limited value for political deciders on its own. Therefore, the state of Rhineland-Palatinate has commissioned the University Medical Center at Johannes Gutenberg University Mainz to conduct a representative cohort study called SentiSurv, in which an increasing number of up to 12,000 participants have been using sensitive antigen self-tests once or twice a week to test themselves for SARS-CoV-2 and report their status. This puts the state of Rhineland-Palatinate in the fortunate position of having time series of both, the viral load in wastewater and the prevalence of SARS-CoV-2 in the population. Our main contribution is a calibration study based on the data from 2023-01-08 until 2023-10-01 where we identified a scaling factor ( 0.208 ± 0.031 ) and a delay ( 5.07 ± 2.30 days) between the virus load in wastewater, normalized by the pepper mild mottle virus (PMMoV), and the prevalence recorded in the SentiSurv study. The relation is established by fitting an epidemiological model to both time series. We show how that can be used to estimate the prevalence when the cohort data is no longer available and how to use it as a forecasting instrument several weeks ahead of time. We show that the calibration and forecasting quality and the resulting factors depend strongly on how wastewater samples are normalized.

Keywords: Cohort study; Covid-19; Forecast; Mathematical modelling; Wastewater-based epidemiology.


Conflict of interest statement

The authors declare no competing interests.

Figures

Figure 1
Figure 1
Reconstruction of prevalence from viral load in wastewater. Normalization by PMMoV. The vertical red line marks the date of model fitting. Pale dots indicate measurements which do not enter the fit, but are used for validation. These are viral loads measured after the fit and all prevalence data of phase II of the SentiSurv study.
Figure 2
Figure 2
Reconstruction of prevalence from viral load in wastewater. Normalization by volume flow. The vertical red line marks the date of model fitting. Pale dots indicate measurements which do not enter the fit, but are used for validation. These are viral loads measured after the fit and all prevalence data of phase II of the SentiSurv study.
Figure 3
Figure 3
Short-term forecast of the prevalence in Rhineland–Palatinate for September and October 2023. Measurements plotted as pale dots do not enter the model fitting, but are used for validation. The vertical red lines mark the time of the forecast. Wastewater data are normalized by reference virus and uniform weighting of sites (RU).
Figure 4
Figure 4
Locations of sampled waste water treatment plants (all markers) and locations of cities participating in the SentiSurv cohort (orange stars). The locations are distributed to cover uniformly population rather than area. On the left, the location of Rhineland–Palatinate in Germany is visualized.
Figure 5
Figure 5
Raw data of N1 and N2 values for one treatment site (Kaiserslautern).
Figure 6
Figure 6
Median number of validly transmitted tests in SentiSurv cohort per month.
Figure 7
Figure 7
Schematic representation of the integration kernels for viral load, proportion of infectious persons and proportion of persons testing positive. Note that the periods of shedding the virus, being infectious and testing positive are not identical. In particular, antigen tests are triggered only a few days after a person has become infectious, but may show a positive result even if the viral load is no longer sufficient for infection.
Figure 8
Figure 8
Reference calibration.
Figure 9
Figure 9
Calibration with low initial value of protected people.

Similar articles

Cited by

References

    1. Pilz M, et al. Statistical analysis of three data sources for Covid-19 monitoring in Rhineland-Palatinate, Germany. Sci. Rep. 2024;14:10245. doi: 10.1038/s41598-024-60973-z. - DOI - PMC - PubMed
    1. Choi PM, et al. Wastewater-based epidemiology biomarkers: Past, present and future. TrAC Trends Anal. Chem. 2018;105:453–469. doi: 10.1016/j.trac.2018.06.004. - DOI
    1. Xagoraraki, I. & O’Brien, E. Wastewater-based epidemiology for early detection of viral outbreaks. In Women in Water Quality: Investigations by Prominent Female Engineers 75–97 (2020).
    1. Daughton CG. Wastewater surveillance for population-wide Covid-19: The present and future. Sci. Total Environ. 2020;736:139631. doi: 10.1016/j.scitotenv.2020.139631. - DOI - PMC - PubMed
    1. McCall C, Wu H, Miyani B, Xagoraraki I. Identification of multiple potential viral diseases in a large urban center using wastewater surveillance. Water Res. 2020;184:116160. doi: 10.1016/j.watres.2020.116160. - DOI - PMC - PubMed