

Kinetics of pro- and anti-inflammatory spike-specific cellular immune responses in long-term care facility residents after COVID-19 mRNA primary and booster vaccination: a prospective longitudinal study in Japan
- PMID: 38909235
- PMCID: PMC11193299
- DOI: 10.1186/s12979-024-00444-1
Kinetics of pro- and anti-inflammatory spike-specific cellular immune responses in long-term care facility residents after COVID-19 mRNA primary and booster vaccination: a prospective longitudinal study in Japan
Abstract
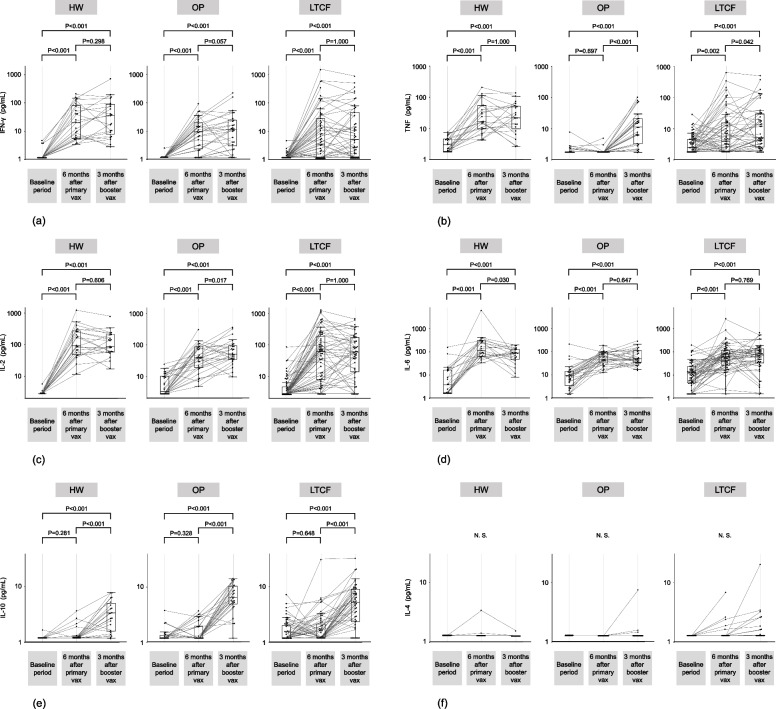
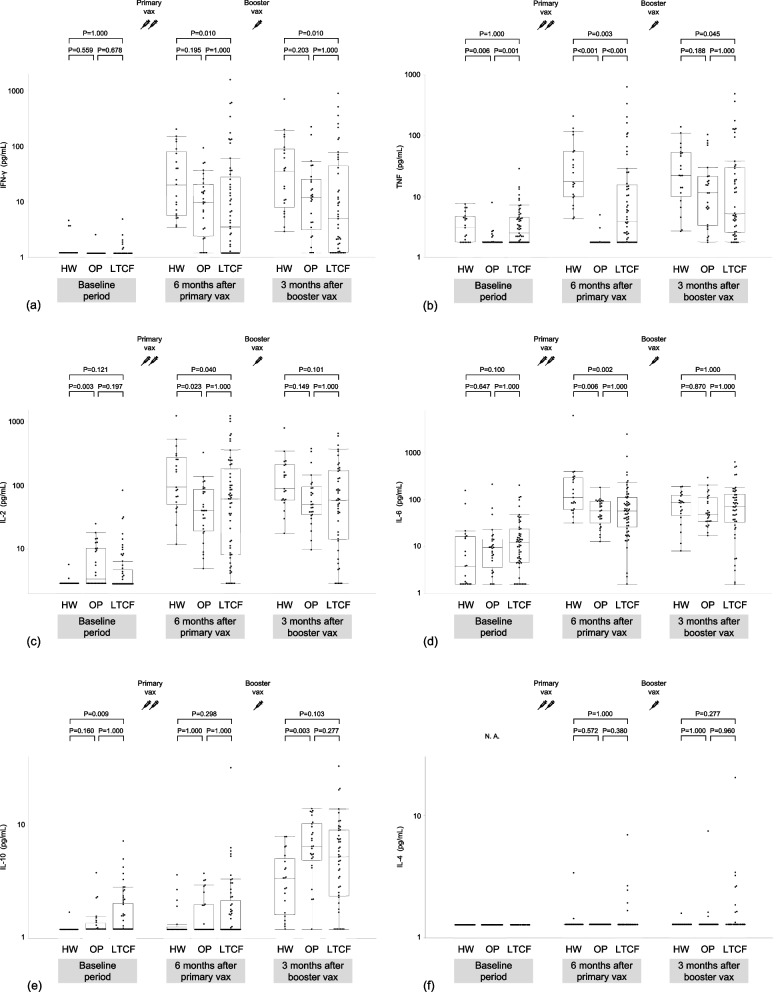
Background: The magnitude and durability of cell-mediated immunity in older and severely frail individuals following coronavirus disease 2019 (COVID-19) vaccination remain unclear. A controlled immune response could be the key to preventing severe COVID-19; however, it is uncertain whether vaccination induces an anti-inflammatory cellular immune response. To address these issues, a 48-week-long prospective longitudinal study was conducted. A total of 106 infection-naive participants (57 long-term care facility [LTCF] residents [median age; 89.0 years], 28 outpatients [median age; 72.0 years], and 21 healthcare workers [median age; 51.0 years]) provided peripheral blood mononuclear cell (PBMC) samples for the assessment of spike-specific PBMC responses before primary vaccination, 24 weeks after primary vaccination, and three months after booster vaccination. Cellular immune responses to severe acute respiratory syndrome coronavirus 2 spike protein were examined by measuring interferon (IFN)-γ, tumor necrosis factor (TNF), interleukin (IL)-2, IL-4, IL-6, and IL-10 levels secreted from the spike protein peptide-stimulated PBMCs of participants.
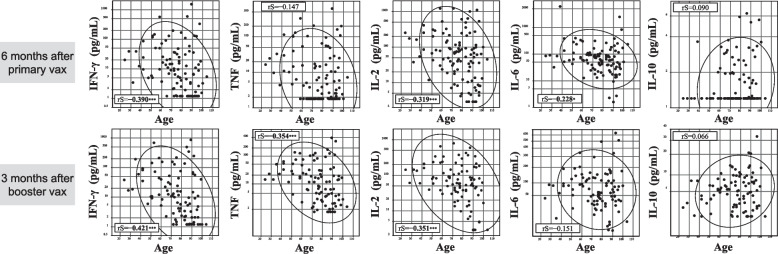
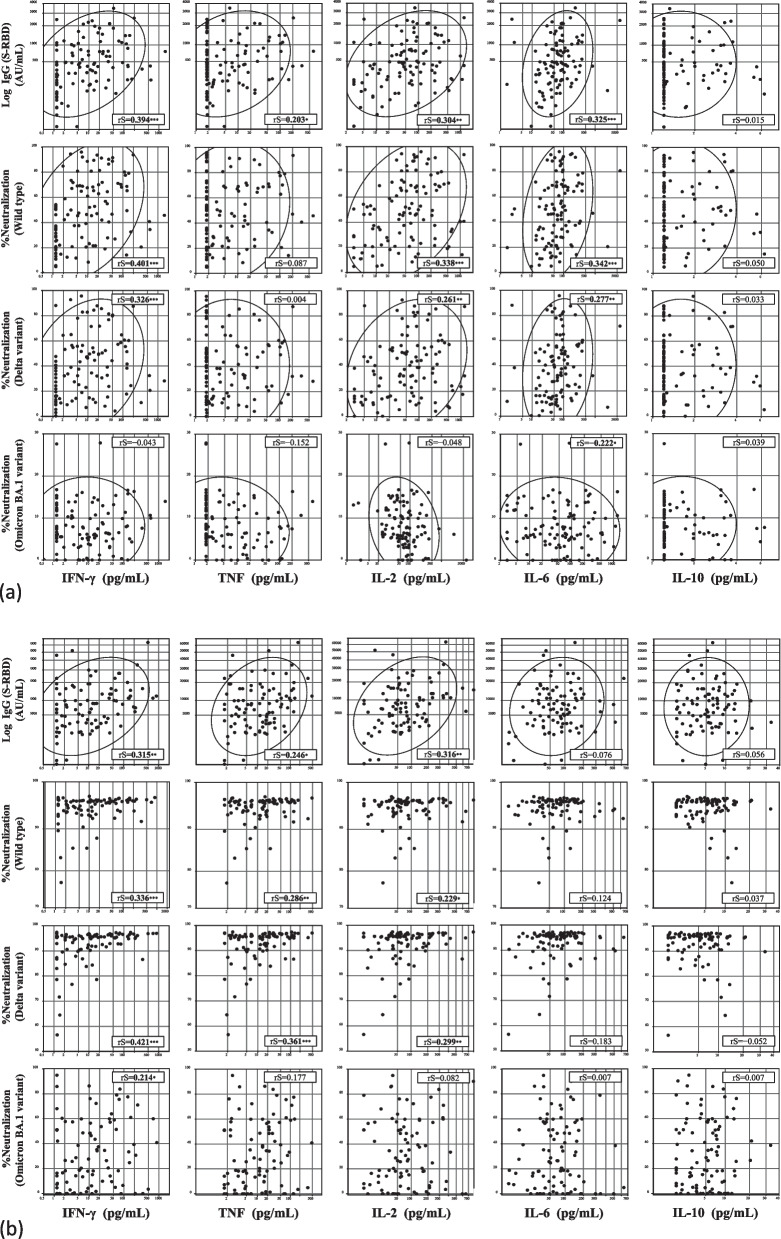
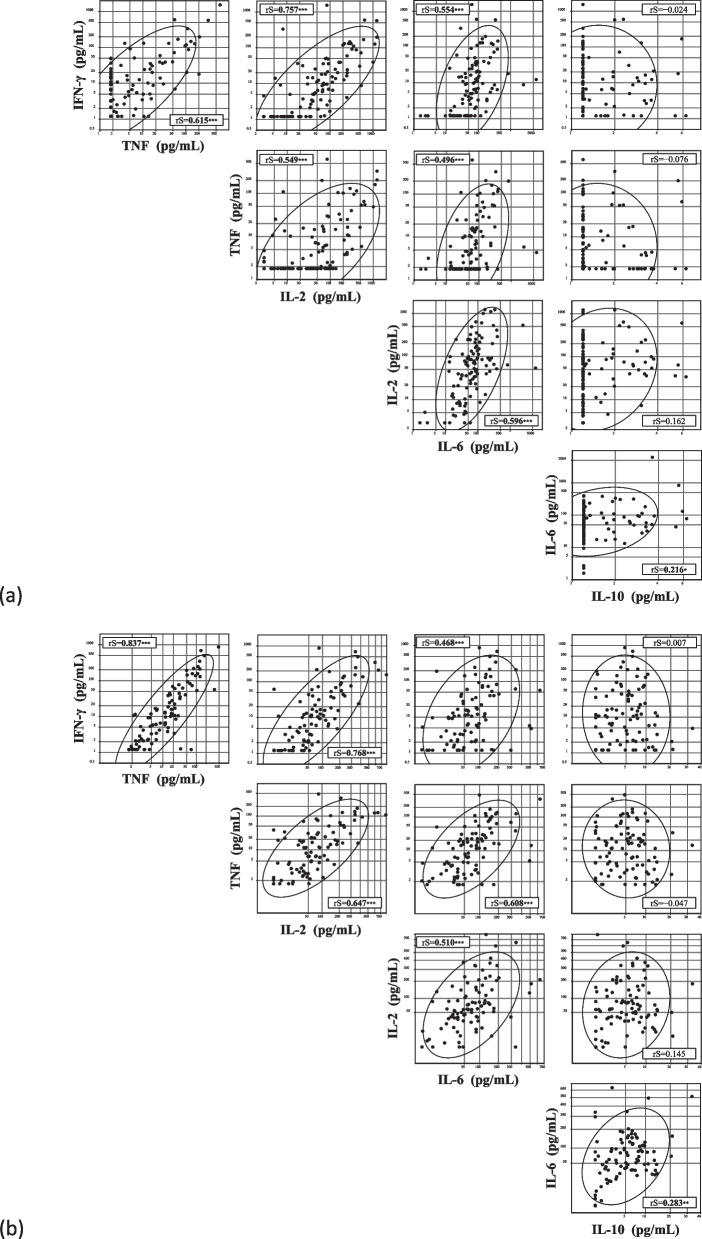
Results: LTCF residents exhibited significantly lower IFN-γ, TNF, IL-2, and IL-6 levels than healthcare workers after the primary vaccination. Booster vaccination increased IL-2 and IL-6 levels in LTCF residents comparable to those in healthcare workers, whereas IFN-γ and TNF levels in LTCF residents remained significantly lower than those in healthcare workers. IL-10 levels were not significantly different from the initial values after primary vaccination but increased significantly after booster vaccination in all subgroups. Multivariate analysis showed that age was negatively associated with IFN-γ, TNF, IL-2, and IL-6 levels but not with IL-10 levels. The levels of pro-inflammatory cytokines, including IFN-γ, TNF, IL-2, and IL-6, were positively correlated with humoral immune responses, whereas IL-10 levels were not.
Conclusions: Older and severely frail individuals may exhibit diminished spike-specific PBMC responses following COVID-19 vaccination compared to the general population. A single booster vaccination may not adequately enhance cell-mediated immunity in older and severely frail individuals to a level comparable to that in the general population. Furthermore, booster vaccination may induce not only a pro-inflammatory cellular immune response but also an anti-inflammatory cellular immune response, potentially mitigating detrimental hyperinflammation.
Keywords: COVID-19; Cell-mediated immunity; Frailty; IFN-γ; IL-10; Interleukin; Older adults; SARS-CoV-2; Vaccination.
© 2024. The Author(s).
Conflict of interest statement
TK and KD are employees of the Department of Pulmonology and Gerontology, Graduate School of Medicine, Yamaguchi University, Ube, Japan, funded by the Medical Corporation WADOKAI. The other authors declare no conflicts of interest.
Figures
Similar articles
-
Kinetics of COVID-19 mRNA primary and booster vaccine-associated neutralizing activity against SARS-CoV-2 variants of concern in long-term care facility residents: a prospective longitudinal study in Japan.Immun Ageing. 2023 Aug 17;20(1):42. doi: 10.1186/s12979-023-00368-2. Immun Ageing. 2023. PMID: 37592283 Free PMC article.
-
T-Cell Mediated Response after Primary and Booster SARS-CoV-2 Messenger RNA Vaccination in Nursing Home Residents.J Am Med Dir Assoc. 2023 Feb;24(2):140-147.e2. doi: 10.1016/j.jamda.2022.11.024. Epub 2022 Dec 7. J Am Med Dir Assoc. 2023. PMID: 36587928 Free PMC article.
-
Kinetics of the B- and T-Cell Immune Responses After 6 Months From SARS-CoV-2 mRNA Vaccination in Patients With Rheumatoid Arthritis.Front Immunol. 2022 Feb 28;13:846753. doi: 10.3389/fimmu.2022.846753. eCollection 2022. Front Immunol. 2022. PMID: 35309297 Free PMC article.
-
Real-world serological responses to extended-interval and heterologous COVID-19 mRNA vaccination in frail, older people (UNCoVER): an interim report from a prospective observational cohort study.Lancet Healthy Longev. 2022 Mar;3(3):e166-e175. doi: 10.1016/S2666-7568(22)00012-5. Epub 2022 Feb 23. Lancet Healthy Longev. 2022. PMID: 35224524 Free PMC article.
-
Study of the cellular and humoral immune responses to SARS-CoV-2 vaccination.Heliyon. 2024 Apr 2;10(7):e29116. doi: 10.1016/j.heliyon.2024.e29116. eCollection 2024 Apr 15. Heliyon. 2024. PMID: 38601689 Free PMC article. Review.
Cited by
-
Comparison of inflammatory mediator cytokine responses to inactivated virus platform COVID-19 vaccines between elderly and young adult populations.Narra J. 2024 Dec;4(3):e1380. doi: 10.1042/narra.v4i3.1380. Epub 2024 Nov 12. Narra J. 2024. PMID: 39816048 Free PMC article.
-
Real-World Effectiveness of Boosting Against Omicron Hospitalization in Older Adults, Stratified by Frailty.Vaccines (Basel). 2025 May 26;13(6):565. doi: 10.3390/vaccines13060565. Vaccines (Basel). 2025. PMID: 40573896 Free PMC article.
References
-
- Portmann L, de Kraker MEA, Frohlich G, Thiabaud A, Roelens M, Schreiber PW, et al. Hospital Outcomes of Community-Acquired SARS-CoV-2 Omicron Variant Infection Compared With Influenza Infection in Switzerland. JAMA Netw Open. 2023;6(2):e2255599. doi: 10.1001/jamanetworkopen.2022.55599. - DOI - PMC - PubMed
LinkOut - more resources
Full Text Sources
Miscellaneous
