. 2024 Nov;20(11):2460-2477.
doi: 10.1080/15548627.2024.2370751. Epub 2024 Jul 3.

(-)-Epigallocatechin 3-gallate protects pancreatic β-cell against excessive autophagy-induced injury through promoting FTO degradation

Affiliations

(-)-Epigallocatechin 3-gallate protects pancreatic β-cell against excessive autophagy-induced injury through promoting FTO degradation

Yixue Shao et al. Autophagy. 2024 Nov.

Abstract

Excessive macroautophagy/autophagy leads to pancreatic β-cell failure that contributes to the development of diabetes. Our previous study proved that the occurrence of deleterious hyperactive autophagy attributes to glucolipotoxicity-induced NR3C1 activation. Here, we explored the potential protective effects of (-)-epigallocatechin 3-gallate (EGCG) on β-cell-specific NR3C1 overexpression mice in vivo and NR3C1-enhanced β cells in vitro. We showed that EGCG protects pancreatic β cells against NR3C1 enhancement-induced failure through inhibiting excessive autophagy. RNA demethylase FTO (FTO alpha-ketoglutarate dependent dioxygenase) caused diminished m6A modifications on mRNAs of three pro-oxidant genes (Tlr4, Rela, Src) and, hence, oxidative stress occurs; by contrast, EGCG promotes FTO degradation by the ubiquitin-proteasome system in NR3C1-enhanced β cells, which alleviates oxidative stress, and thereby prevents excessive autophagy. Moreover, FTO overexpression abolishes the beneficial effects of EGCG on β cells against NR3C1 enhancement-induced damage. Collectively, our results demonstrate that EGCG protects pancreatic β cells against NR3C1 enhancement-induced excessive autophagy through suppressing FTO-stimulated oxidative stress, which provides novel insights into the mechanisms for the anti-diabetic effect of EGCG.Abbreviation 3-MA: 3-methyladenine; AAV: adeno-associated virus; Ad: adenovirus; ALD: aldosterone; AUC: area under curve; βNR3C1 mice: pancreatic β-cell-specific NR3C1 overexpression mice; Ctrl: control; CHX: cycloheximide; DEX: dexamethasone; DHE: dihydroethidium; EGCG: (-)-epigallocatechin 3-gallate; FTO: FTO alpha-ketoglutarate dependent dioxygenase; GSIS: glucose-stimulated insulin secretion; HFD: high-fat diet; HG: high glucose; i.p.: intraperitoneal; IOD: immunofluorescence optical density; KSIS: potassium-stimulated insulin secretion; m6A: N6-methyladenosine; MeRIP-seq: methylated RNA immunoprecipitation sequencing; NO: nitric oxide; NR3C1/GR: nuclear receptor subfamily 3, group C, member 1; NR3C1-Enhc.: NR3C1-enhancement; NAC: N-acetylcysteine; NC: negative control; PBS: phosphate-buffered saline; PI: propidium iodide; OCR: oxygen consumption rate; Palm.: palmitate; RELA: v-rel reticuloendotheliosis viral oncogene homolog A (avian); RNA-seq: RNA sequencing; O2.-: superoxide anion; SRC: Rous sarcoma oncogene; ROS: reactive oxygen species; T2D: type 2 diabetes; TEM: transmission electron microscopy; TLR4: toll-like receptor 4; TUNEL: terminal dUTP nick-end labeling; UTR: untranslated region; WT: wild-type.

Keywords: (-)-epigallocatechin 3-gallate; Autophagy; FTO; diabetes; oxidative stress; pancreatic β-cell.


Conflict of interest statement

No potential conflict of interest was reported by the author(s).

Figures
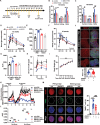
Figure 1.
Figure 1.
EGCG improves glucose tolerance and β-cell function in β-cell-specific NR3C1 overexpression mice. Male C57BL/6J mice (6 weeks old) were injected with AAV8-RIP2-vector or AAV8-RIP2-Nr3c1 via pancreatic intraductal viral infusion. (A) 4 weeks after infusion, ctrl and βNR3C1 mice were gavage with PBS or EGCG (50 mg/kg body weight) for 10 weeks. GTTs, ITTs and serum insulin levels were measured as indicated. (B,C) Blood glucose levels were measured in mice from all groups at 14 (B) and 18 (C) weeks. (D,E) GTTs were performed at 15 weeks. AUC (area under the curves) were calculated in (E). (F,G) GTTs were performed at 19 weeks. AUC (area under the curves) were calculated in (G). (H) Serum insulin levels after glucose stimulation were measured at 19 weeks by ELISA. (I) Body weight for mice in all four groups during EGCG duration. (J) Immunofluorescence staining of primary islets obtained from βNR3C1 or ctrl mice gavaged with PBS or EGCG was performed for NR3C1 (red), insulin (green), and DAPI (blue). Scale bar: 100 μm. The immunofluorescence optical density (IOD) of NR3C1 was measured and quantified below. (K-L) Islet perfusion was performed in βNR3C1 and ctrl mice in three separate experiments. Islets (80–100) obtained from 3 mice were evaluated per group. AUC values for the 1st and 2nd phases of GSIS in islet perfusion were calculated in (L). (M) TUNEL staining of cellular apoptosis of islets in βNR3C1 and ctrl mice. The quantification of TUNEL+ β cells is on the right. Scale bar: 100 μm. Data are presented as mean ± SEM. n = 5 for each group.
Figure 2.
Figure 2.
EGCG reverses NR3C1 enhancement-induced pancreatic β-cell failure. (A–C) Human islets were infected with Ad-NR3C1 for 12 h, then, treated with EGCG (50 μmol/l) for 48 h. Islet perfusion assays (almost 100 human islets obtained from 4 individuals per group), glucose- or KCl-stimulated insulin secretion (GSIS and KSIS) assays (almost 10 human islets per group) were performed in three separate experiments. AUC (area under curve) values for the 1st and 2nd phases of GSIS in islet perfusion were calculated in (C). (D,E) MIN6 cells and human islets were treated with aldosterone (200 nmol/l) with/without EGCG (50 μmol/l) for 48 h. GSIS assays were performed in three separate experiments (D). Insulin content were measured meanwhile (E). (F-G) Isolated human islets were treated with aldosterone and/or EGCG for 48 h during islet perfusion in three separate experiments. AUC values for the 1st and 2nd phases of GSIS in islet perfusion were calculated in (G). (H) Cell viability was evaluated in MIN6 cells treated with aldosterone and/or EGCG using a CCK-8 assay (n = 6). (I) Cell apoptosis was detected using flow cytometric assay with ANXA5-FITC and PI-staining in MIN6 cells treated with aldosterone and/or EGCG (n = 3). (J) TUNEL staining of cellular apoptosis of human islets exposed to aldosterone with/without EGCG administration. The images of TUNEL+ β-cells were captured and quantified. Scale bar: 50 μm. VEH: vehicle, ALD: aldosterone, EGCG: epigallocatechin-3-gallate. Data are presented as mean ± SEM.
Figure 3.
Figure 3.
EGCG protects pancreatic β cells against NR3C1 enhancement-induced failure through inhibiting excessive autophagy. (A–B) Immunofluorescence staining of pancreatic sections obtained from βNR3C1 or control mice was performed for LC3 (green), SQSTM1 (green), insulin (red), and DAPI (blue). Scale bar: 100 μm. n = 5. (C,D) Representative TEM images of pancreatic β cells obtained from ctrl mice and βNR3C1 mice. Boxes indicate autophagic structures. The graphs in (D) show quantification of autophagic structures in β cells in (D) (n = 22–31). Scale bar: 1 μm. (E) MIN6 cells were transfected with NR3C1 overexpressing plasmids or empty vectors and then treated with EGCG for 36 h. LC3 and SQSTM1 expression were measured by western blot. GAPDH was used as internal control. n = 3. (F) MIN6 cells were transfected with mRFP-GFP-LC3 adenovirus and the dots per cell was quantified below (n = 10). Scale bar: 20 μm. (G) INS1 cells were transfected with mRFP-GFP-LC3 and the dots per cell was quantitated below (n = 10). Scale bar: 20 μm. (H) MIN6 cells were transfected with NR3C1 overexpressing plasmids or empty vectors and then treated with EGCG and rapamycin for 72 h. TUNEL staining of cellular apoptosis were performed. Scale bar: 150 μm. (I) MIN6 cells were transfected with NR3C1 overexpressing plasmids or empty vectors and then treated with EGCG and rapamycin for 36 h. GSIS and insulin content were determined. n = 6. Data are presented as mean ± SEM. For E-J.
Figure 4.
Figure 4.
EGCG promotes FTO degradation in NR3C1 enhancement-activated β cells. (A) Molecular docking studies between EGCG and FTO (mouse). (B) After pretreated with EGCG (50 μmol/l) for 2 h, MIN6 cells were exposed to chronic HG and Palm. with/without EGCG for an additional 36 h. FTO and NR3C1 expression were measured by western blot. GAPDH was used as internal control. (C) Immunofluorescence staining of T2D human islets treated with PBS or EGCG was performed for FTO (red), insulin (insulin), and DAPI (blue). Scale bar: 20 μm. (D) Immunofluorescence staining of pancreatic sections obtained from βNR3C1 or control mice was performed for FTO (red), insulin (green), and DAPI (blue). Scale bar: 100 μm. (E) MIN6 cells were transfected with NR3C1-overexpressing plasmids or empty vectors and treated with EGCG (50 μmol/l) for 24 h. FTO expression were measured by western blot. n = 3. (F) Western blot analysis of FTO in NR3C1-overexpressed MIN6 cells with or without 50 μmol/l EGCG incubated under 50 mmol/l CHX treatment for 0, 3, 6 and 9 h. GAPDH was used as internal control and the relative FTO expression was calculated below. n = 3. (G-H) Western blot analysis of FTO in NR3C1-overexpressed MIN6 cells with 50 μmol/l EGCG and 10 μmol/l MG132 or 50 μmol/l CQ treated. n = 3. (I) Co-immunoprecipitations were performed to detect the ubiquitination modification of FTO in NR3C1-overexpressing MIN6 cells with or without 50 μmol/l EGCG treated. n = 3. Data are presented as mean ± SEM. For F-H.
Figure 5.
Figure 5.
EGCG prevents the NR3C1 enhancement-induced mitochondrial dysfunction and oxidative stress. (A) The O2 level of islets obtained from βNR3C1 or control mice was detected by DHE and the fluorescence microscopy images are shown. O2 (red), and DAPI (blue). Scale bar: 100 μm. (B) Immunofluorescence staining of islets obtained from βNR3C1 or control mice was performed for insulin (green), 4-HNE or 8-OHdG (red), and DAPI (blue). Scale bar: 100 μm. Images for each group were obtained at the exact same gain setting on the microscope. (C) The O2 fluorescence intensity of islets was quantitated on the left (n = 10) and the 4-HNE fluorescence intensity was quantified on the right (n = 30). The proportion of 8-OHdG-positive cells to insulin-positive cells was counted in the middle (n = 15). (D-E) Representative TEM images of mitochondria in pancreatic β cells from ctrl mice and βNR3C1 mice treated with or without EGCG (n = 21–27). Dotted yellow lines represent cell boundaries. Arrows indicate mitochondria. Scale bar: 2 μm. The number of mitochondria and mitochondrial length/width ratio was quantified in (E). (F) MIN6 cells were transfected with NR3C1-overexpressing plasmids or empty vectors and then treated with EGCG for 48 h, subsequently, MIN6 cells were incubated with oligomycin 1 μmol/l, FCCP 1.5 μmol/l, antimycin a and rotenone 0.5 μmol/l for OCR measurement. The data have been represented as mean ± SEM with n = 6 per group. (G) Islets obtained from ctrl mice and βNR3C1 mice were treated with EGCG for 48 h. Mitochondrial respiratory chain complex were measured by western blot. n = 3. (H) The O2 level of the MIN6 cells transfected with NR3C1 overexpressing plasmids or empty vectors were measured with fluorescent probe DHE after EGCG incubated 48 h and subsequently observed by confocal microscope. ROS (red), and DAPI (blue). Scale bar: 100 μm. Images for each group were obtained at the exact same gain setting on the microscope and the red fluorescence intensity of MIN6 were quantified (n = 20). Nitric oxide (NO) was determined with a nitrate/nitrite assay kit. Data are presented as mean ± SEM.
Figure 6.
Figure 6.
FTO inhibition is responsible for the antioxidant action of EGCG in response to NR3C1-induced oxidative stress. (A) Gene ontology analysis of MeRIP-seq in NR3C1-overexpressing MIN6 cells. (B-D) Integrative genomics viewer (IGV) plots of m6A peaks at the Tlr4 (B), Rela (C), and Src (D). (E) The levels of Tlr4, Rela and Src mRNA in MIN6 cells transfected with NR3C1-overexpressing plasmids and siFto. (F) MeRIP-qPCR analysis of m6A levels of Tlr4, Rela and Src mRNA in MIN6 cells transfected with NR3C1-overexpressing plasmids and siFto. (G-I) MIN6 cells were transfected with NR3C1 overexpressing plasmids or empty vectors and then treated with 50 μmol/l EGCG for 48 h, FTO overexpressing plasmids were transfected into the EGCG treated MIN6 cells for 24 h. Subsequently, Tlr4, Rela and Src mRNA levels, the O2 and NO levels of the treated cells were detected. Tlr4, Rela and Src mRNA levels were shown in (G). The immunofluorescence images of O2 fluorescent probe were shown in H, scale bar: 100 μm, and the images for each group were obtained at the exact same gain setting on the microscope and the red fluorescence intensity of MIN6 cells were quantitated on the right side (n = 30). The level of nitric oxide (NO) was exhibited in (I). Data are presented as mean ± SEM.
Figure 7.
Figure 7.
EGCG prevents FTO-induced excessive autophagy via ameliorating oxidative stress. (A) Western blot analysis of LC3 and SQSTM1 in control and FTO overexpressed MIN6 cells treated with or without 1 mmol/l NAC for 48 h. (B) MIN6 cells were transfected with mRFP-GFP-LC3 adenovirus with or without FTO-overexpression for 24 h. Cells were observed to distinguish between autophagosome (yellow puncta) and autolysosome (AL, red-only puncta) after colocalization analysis using a confocal microscope and the dots per cell were quantified below (n = 15). Scale bar: 20 μm. (C) Representative TEM images of pancreatic β cells obtained from ctrl mice and βNR3C1 mice with or without 1 mmol/l NAC for 48 h. The number of autophagic structures was quantified on the right (n = 20). Scale bar: 1 μm. (D) Western blot analysis of LC3 and SQSTM1 in control and FTO-overexpressing cells treated with or without 10 mmol/l 3-MA for 4 h. n = 3. (E-F) MIN6 cells were transfected with FTO-overexpressing plasmids or empty vectors and then treated with 10 mmol/l 3-MA for 4 h. O2 were detected with fluorescent probe DHE and subsequently observed by confocal microscope. O2 (red), and DAPI (blue). Scale bar: 100 μm. Images for each group were obtained at the exact same gain setting on the microscope and the red fluorescence intensity of MIN6 cells were quantitated (n = 30). NO was determined with a nitrate/nitrite assay kit in F. (G) Western blot analysis of LC3 and SQSTM1 in control and FTO-overexpressing cells treated with or without 50 μmol/l EGCG for 48 h. And then H2O2 were added to EGCG treated MIN6 cells for 24 h. n = 3. (H-I) MIN6 cells were transfected with FTO-overexpressing plasmids or empty vectors and then treated with EGCG and/or rapamycin for 4 h, and O2− were detected with fluorescent probe DHE and subsequently observed by confocal microscopy. NO was determined with a nitrate/nitrite assay kit in (I). Data are presented as mean ± SEM.
Figure 8.
Figure 8.
EGCG protects β cells against NR3C1 activation-induced damage via downregulation of FTO. (A-C) MIN6 cells were treated as indicated, and then GSIS (A), insulin content (B) and cell apoptosis (C) was determined. Scale bar: 100 μm. (D-E) INS1 cells were treated as indicated, and then KSIS (D), insulin content (E) and cell apoptosis (F) was determined. Scale bar: 100 μm. (G) MIN6 cells that overexpressing FTO were treated with ALD and EGCG for 48 h, then a GSIS assay was carried out. (H) MIN6 cells that overexpressed FTO were treated with DEX and EGCG for 48 h., then a GSIS assay was carried out. Data are presented as mean ± SEM.

References

    1. Chen ZF, Li YB, Han JY, et al. The double-edged effect of autophagy in pancreatic beta cells and diabetes. Autophagy. 2011;7(1):12–16. doi: 10.4161/auto.7.1.13607 - DOI - PMC - PubMed
    1. Tanemura M, Ohmura Y, Deguchi T, et al. Rapamycin causes upregulation of autophagy and impairs islets function both in vitro and in vivo. Am J Transplant. 2012;12(1):102–114. doi: 10.1111/j.1600-6143.2011.03771.x - DOI - PubMed
    1. Lee YH, Kim J, Park K, et al. beta-cell autophagy: mechanism and role in beta-cell dysfunction. Mol Metab. 2019;27S:S92–S103. doi: 10.1016/j.molmet.2019.06.014 - DOI - PMC - PubMed
    1. Israeli T, Riahi Y, Garzon P, et al. Nutrient sensor mTORC1 regulates insulin secretion by modulating beta-cell autophagy. Diabetes. 2022;71(3):453–469. doi: 10.2337/db21-0281 - DOI - PMC - PubMed
    1. Li S, Du L, Zhang L, et al. Cathepsin B contributes to autophagy-related 7 (Atg7)-induced nod-like receptor 3 (NLRP3)-dependent proinflammatory response and aggravates lipotoxicity in rat insulinoma cell line. J Biol Chem. 2013;288(42):30094–30104. doi: 10.1074/jbc.M113.494286 - DOI - PMC - PubMed

Publication types

MeSH terms