. 2024 Aug 13;150(7):544-559.
doi: 10.1161/CIRCULATIONAHA.123.066577. Epub 2024 Jun 24.

Impaired Intracellular Calcium Buffering Contributes to the Arrhythmogenic Substrate in Atrial Myocytes From Patients With Atrial Fibrillation

Affiliations

Impaired Intracellular Calcium Buffering Contributes to the Arrhythmogenic Substrate in Atrial Myocytes From Patients With Atrial Fibrillation

Funsho E Fakuade et al. Circulation. .

Abstract

Background: Alterations in the buffering of intracellular Ca2+, for which myofilament proteins play a key role, have been shown to promote cardiac arrhythmia. It is interesting that although studies report atrial myofibrillar degradation in patients with persistent atrial fibrillation (persAF), the intracellular Ca2+ buffering profile in persAF remains obscure. Therefore, we aimed to investigate the intracellular buffering of Ca2+ and its potential arrhythmogenic role in persAF.

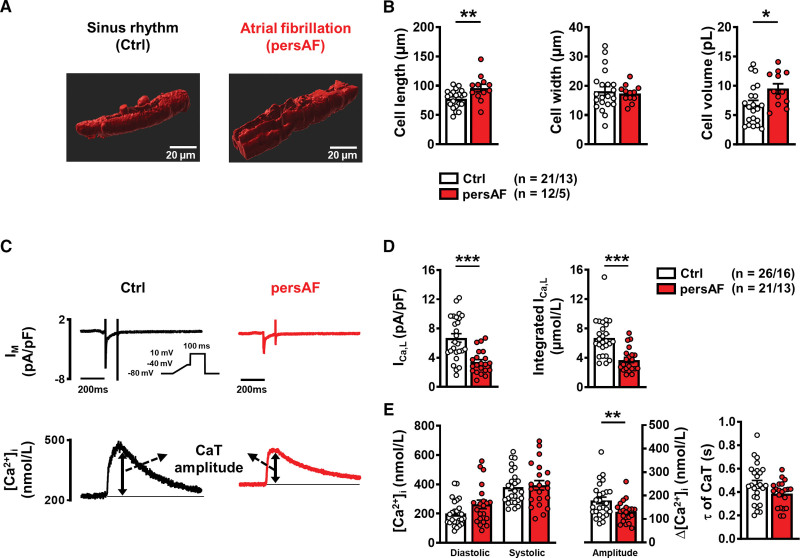
Methods: Transmembrane Ca2+ fluxes (patch-clamp) and intracellular Ca2+ signaling (fluo-3-acetoxymethyl ester) were recorded simultaneously in myocytes from right atrial biopsies of sinus rhythm (Ctrl) and patients with persAF, alongside human atrial subtype induced pluripotent stem cell-derived cardiac myocytes (iPSC-CMs). Protein levels were quantified by immunoblotting of human atrial tissue and induced pluripotent stem cell-derived cardiac myocytes. Mouse whole heart and atrial electrophysiology were measured on a Langendorff system.

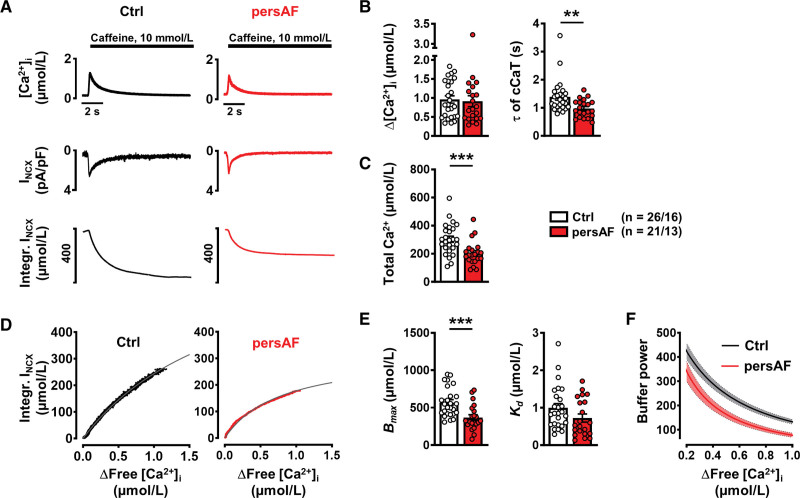
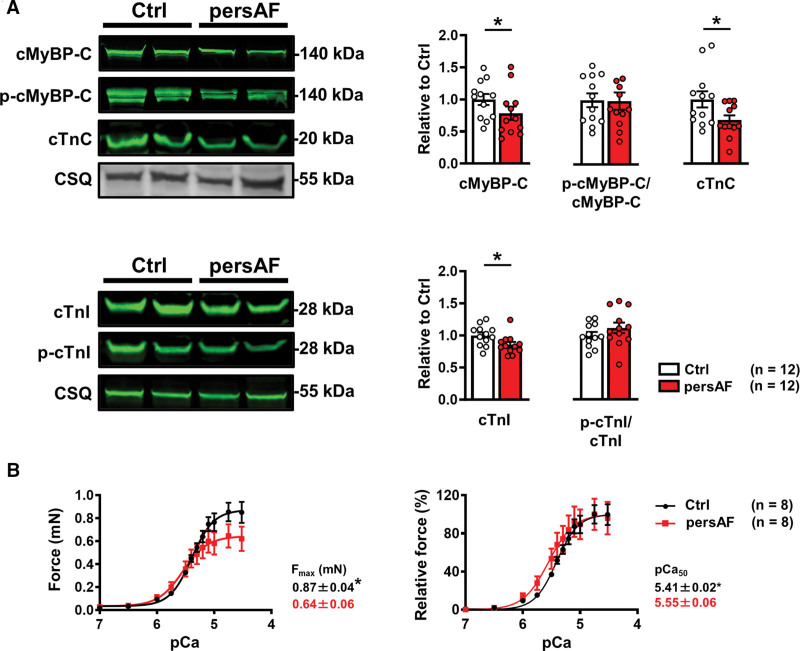
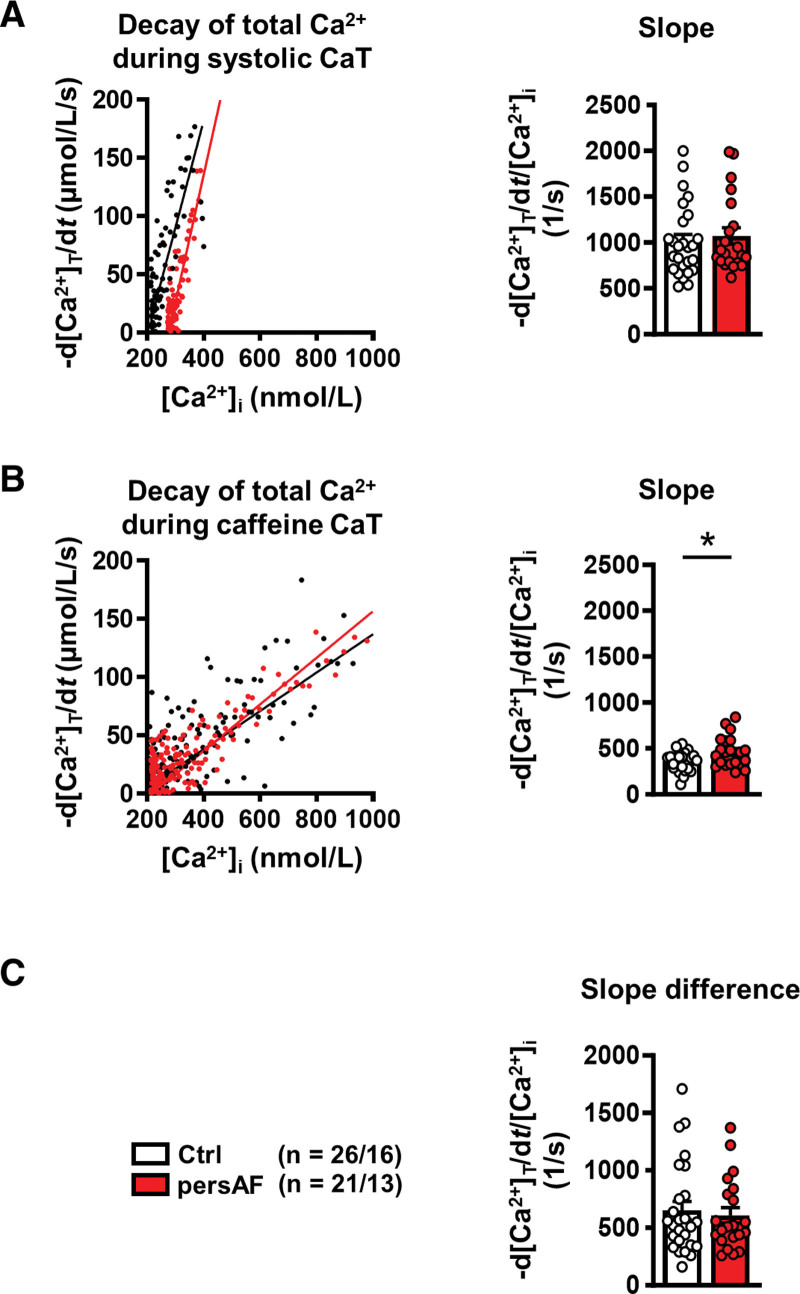
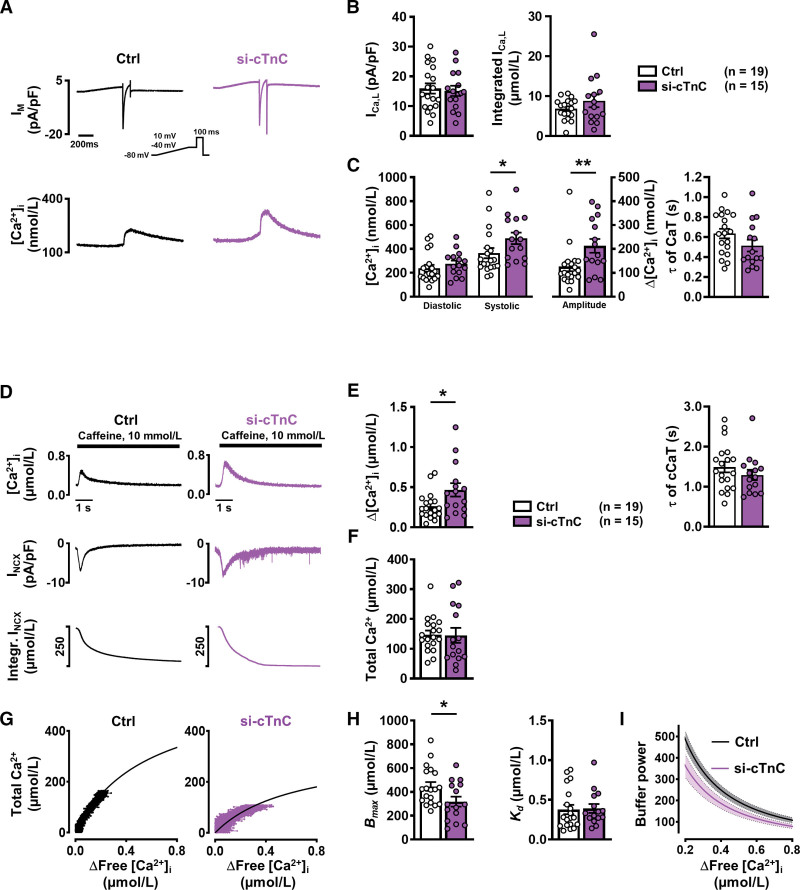
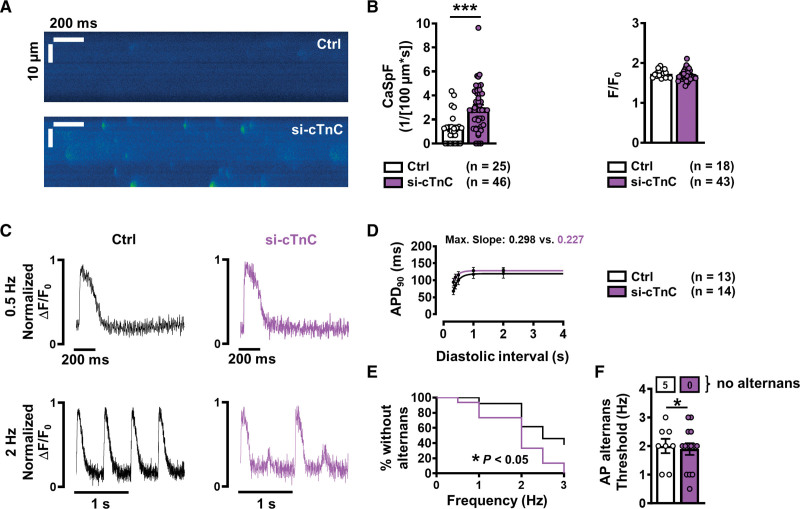
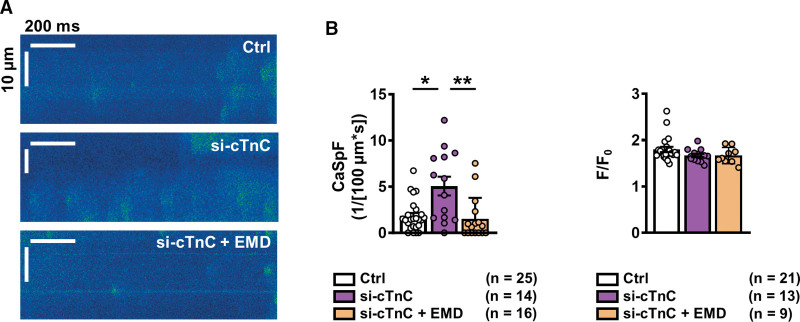
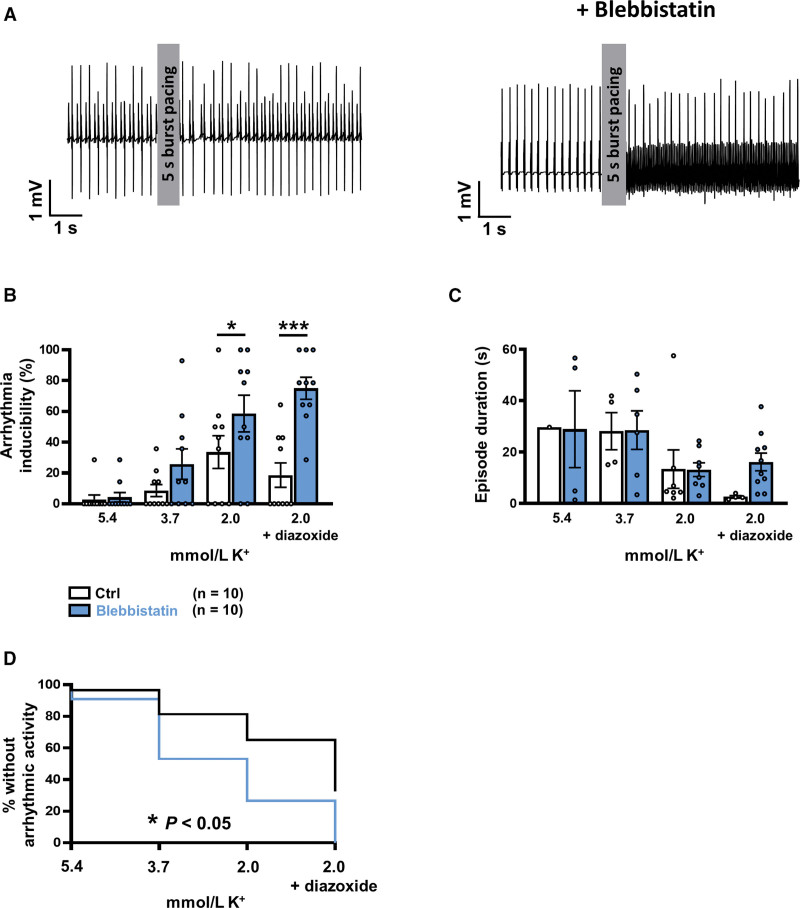
Results: Cytosolic Ca2+ buffering was decreased in atrial myocytes of patients with persAF because of a depleted amount of Ca2+ buffers. In agreement, protein levels of selected Ca2+ binding myofilament proteins, including cTnC (cardiac troponin C), a major cytosolic Ca2+ buffer, were significantly lower in patients with persAF. Small interfering RNA (siRNA)-mediated knockdown of cTnC (si-cTNC) in atrial iPSC-CM phenocopied the reduced cytosolic Ca2+ buffering observed in persAF. Si-cTnC treated atrial iPSC-CM exhibited a higher predisposition to spontaneous Ca2+ release events and developed action potential alternans at low stimulation frequencies. Last, indirect reduction of cytosolic Ca2+ buffering using blebbistatin in an ex vivo mouse whole heart model increased vulnerability to tachypacing-induced atrial arrhythmia, validating the direct mechanistic link between impaired cytosolic Ca2+ buffering and atrial arrhythmogenesis.

Conclusions: Our findings suggest that loss of myofilament proteins, particularly reduced cTnC protein levels, causes diminished cytosolic Ca2+ buffering in persAF, thereby potentiating the occurrence of spontaneous Ca2+ release events and atrial fibrillation susceptibility. Strategies targeting intracellular buffering may represent a promising therapeutic lead in persAF management.

Keywords: atrial fibrillation; atrial remodeling; calcium signaling; cardiac arrhythmias; electrophysiology; ion channels.


Conflict of interest statement

None.

Figures

Figure 1.
Figure 1.
Characterization of atrial myocytes isolated from patients without (Ctrl) and with persAF. A, Example 3-dimensional reconstruction of confocal z-stack images of atrial myocytes from Ctrl and persAF stained with di-4-ANEPPS. B, Mean±SEM cell dimensions and volume of control and persAF myocytes. C, ICa,L-triggered CaT in control and persAF atrial myocytes; representative simultaneous recordings of ICa,L (upper, inset, voltage-clamp protocol, 0.5 Hz) and triggered CaT (Fluo-3, lower). D, Mean±SEM peak ICa,L (left) and integrated ICa,L (right). E, Mean±SEM diastolic and systolic [Ca2+]i (left) and resulting CaT amplitude (middle), and time constant (τ) of decay (right). *P<0.05, **P<0.01, ***P<0.001 vs control. n/N=number of myocytes/patients. Normality of data was determined by Shapiro-Wilk test, whereas comparison was made using the Student t test with Welch correction and Mann-Whitney U test for normally and nonnormally distributed data, respectively. CaT indicates Ca2+ transient; Ctrl, control; and persAF, persistent atrial fibrillation.
Figure 2.
Figure 2.
Caffeine-induced CaT and corresponding transient inward current (INCX) to assess SR Ca2+ content and buffering properties of atrial myocytes isolated from patients without (control) and with persAF. A, Representative caffeine-induced CaT (upper), associated INCX (middle) and integral of inward current, corrected for cell volume to give a measure of total Ca2+ (lower). B, Mean±SEM amplitude and time constant (τ) of decay of caffeine-induced CaT. C, Mean±SEM calculated total Ca2+. D, Representative buffer curves showing the relationship between cytosolic free Ca2+ and total Ca2+, fitted with a hyperbolic function. E, Mean±SEM maximum buffering capacity (Bmax, left) and dissociation constant (Kd, right), determined from buffer curves. F, Mean (line) ±SEM (shaded) of calculated individual total buffer power curves as a function of free [Ca2+]i. **P<0.01, ***P<0.001 vs control. n/N=number of myocytes/patients. Normality of data was determined by Shapiro-Wilk test and comparison was made using the Mann Whitney U test. Ctrl indicates control; and persAF, persistent atrial fibrillation.
Figure 3.
Figure 3.
Myofilament protein expression and contractile response to cytosolic Ca2+ in control and persAF. A, Immunoblots (upper left) and quantification (upper right) of cMyBP-C (cardiac myosin binding protein-C), its phosphorylated state (P-cMyBP-C), and cTnC (cardiac troponin-C) in atrial samples from controls and patients with persAF, normalized to CSQ (calsequestrin), except for P-cMyBP-C, which was normalized to total cMyBP-C. Immunoblots (lower left) and quantification (lower right) of cTnI (cardiac troponin I) and its phosphorylated state (P-cTnI) in atrial samples from controls and patients with persAF, normalized to CSQ and total cTnI, respectively. B, Absolute (left) and normalized (right) force-pCa relationship of skinned muscle fibers of controls and patients with persAF with mean±SEM of maximum force (Fmax) and calcium sensitivity (pCa50). *P<0.05 vs control. n=number of patients. Normality of data was determined by Shapiro-Wilk test, whereas comparison was made using the Student t test with Welch correction. Ctrl indicates control; and persAF, persistent atrial fibrillation.
Figure 4.
Figure 4.
Quantification of decay of total Ca2+ in atrial myocytes isolated from patients without (control) and with persAF. A, Representative rate of decay of total Ca2+ (-d[Ca2+]T/dt) plotted during systolic CaT against free [Ca2+]i (left) and slope of -d[Ca2+]T/dt plotted against [Ca2+]i (right). B, Representative rate of decay of total Ca2+ during caffeine-induced Ca2+ transient (-d[Ca2+]T/dt) plotted against the corresponding free [Ca2+]i (left) and slope of -d[Ca2+]T/dt during caffeine plotted against corresponding [Ca2+]i (right). C, Difference between slopes in A and B, indicating unaltered [Ca2+]i dependence of SERCA-mediated Ca2+ removal. *P<0.05 vs control. n/N=number of myocytes/patients. Normality of data was determined by Shapiro-Wilk test, whereas comparison was made using the Student t test with Welch correction and Mann-Whitney U test for normally and nonnormally distributed data, respectively. Ctrl indicates control; and persAF, persistent atrial fibrillation.
Figure 5.
Figure 5.
Ca2+ handling and Ca2+ buffering properties in atrial iPSC-CMs with normal (control) and reduced (si-cTnC) cTnC levels. A, Representative simultaneous recordings of ICa,L (upper, inset, voltage-clamp protocol, 1 Hz) and triggered CaT (lower). B, Mean±SEM peak ICa,L (left) and integrated ICa,L (right) in control (siRNA ns) and si-cTnC (siRNA cTnC) iPSC-CMs. C, Mean±SEM diastolic and systolic [Ca2+]i (left) and resulting CaT amplitude (middle), and time constant (τ) of decay (right). D, Representative caffeine-induced CaT (upper), associated INCX (middle) and integral of inward current, corrected for cell volume to give a measure of total Ca2+ (lower). E, Mean±SEM amplitude (left) and time constant (τ) of decay (right) of caffeine-induced CaT. F, Mean±SEM calculated total Ca2+. G, Buffer curves showing the relationship between cytosolic free Ca2+ and total Ca2+, fitted with a hyperbolic function. H, Mean±SEM maximum buffering capacity (Bmax, left) and dissociation constant (Kd, right), determined from buffer curves. I, Mean±SEM of calculated individual total buffer power curves as a function of free [Ca2+]i. *P<0.05, **P<0.01 vs control. n=number of myocytes (2–4 differentiations). Normality of data was determined by Shapiro-Wilk test, whereas comparison was made using the Student t test and Mann-Whitney U test for normally and nonnormally distributed data, respectively. Ctrl indicates control; cTnC, cardiac troponin C; CaT, Ca2+ transient; iPSC-CM, induced pluripotent stem cell–derived cardiac myocyte; ns, nonsilencing; and siRNA, small interfering RNA.
Figure 6.
Figure 6.
Incidence of Ca2+ sparks and action potential (AP) alternans in atrial iPSC-CMs with normal (control) and reduced (si-cTnC) cTnC levels. A, Representative confocal line scans showing SR Ca2+ release in the form of Ca2+ sparks in control (siRNA ns) and si-cTnC (siRNA cTnC) iPSC-CMs. B, Mean±SEM Ca2+ spark frequency (CaSpF, left) and amplitude (right). C, Representative normalized traces of AP at 0.5 Hz (upper) and 2 Hz (lower) in control (left) and si-cTnC iPSC-CMs. D, AP duration at 90% repolarization (APD90) at increasing diastolic intervals (AP restitution), fitted with a 1-phase association nonlinear function to determine maximum curve slope. E, Kaplan-Meier plot indicating the percentage of iPSC-CMs without alternans in relation to the respective pacing frequency. F, Mean±SEM alternans threshold frequency. Number of myocytes without AP alternans are shown in boxes above. ***P<0.001, *P<0.05 vs control. n=number of myocytes (2 or 3 differentiations). Comparison was made using the unpaired Student t test, the Mann-Whitney U test, and the Gehan-Breslow-Wilcoxon test (E). Ctrl indicates control; cTnC, cardiac troponin C; iPSC-CM, induced pluripotent stem cell–derived cardiac myocyte; ns, nonsilencing; and siRNA, small interfering RNA.
Figure 7.
Figure 7.
Effect of Ca2+ sensitization on Ca2+ sparks in atrial iPSC-CMs with reduced (si-cTnC) cTnC levels. A, Representative confocal line scans of atrial iPSC-CMs with normal (control, siRNA ns) and reduced (si-cTnC, siRNA cTnC) cTnC levels, pretreated with EMD57033 (EMD, 5 µmol/L). B, Mean±SEM Ca2+ spark frequency (CaSpF, left) and amplitude (right). *P<0.05, **P<0.01 vs control and si-cTnC. n=number of myocytes (2 differentiations). Comparison was made using the Kruskal-Wallis test followed by the Dunn post hoc test. Ctrl indicates control; cTnC, cardiac troponin C; iPSC-CM, induced pluripotent stem cell–derived cardiac myocyte; ns, nonsilencing; and siRNA, small interfering RNA.
Figure 8.
Figure 8.
Langendorff experiments in mouse heart. A, Representative atrial electrogram traces showing effect of burst pacing (100 Hz) in the absence (control, left) and presence (right) of blebbistatin (5 µmol/L) (2 mmol/L K+ in both). B, Grouped bar chart showing mean±SEM inducibility of atrial arrhythmic activity for each potassium level, differentiated by the presence or absence of blebbistatin. The chart highlights significant main effects of blebbistatin, F(1, 72)=20.06, P<0.0001, and potassium, F(3, 72)=14.91, P<0.0001. C, Mean±SEM arrhythmic episode duration for each potassium level, in the presence or absence of blebbistatin. The graph highlights the significant effect of potassium, F(3, 36)=3.52, P<0.05. D, Kaplan-Meier plot showing the percentage of hearts without arrhythmic activity. *P<0.05, ***P<0.001 vs control. n=number of hearts. Comparison using 2-way ANOVA followed by a Fisher Least Significant Difference post hoc test (B and C) and the Gehan-Breslow-Wilcoxon test (D). Ctrl indicates control.

References

    1. Go AS, Mozaffarian D, Roger VL, Benjamin EJ, Berry JD, Borden WB, Bravata DM, Dai S, Ford ES, Fox CS, et al. ; American Heart Association Statistics Committee and Stroke Statistics Subcommittee. Heart disease and stroke statistics--2013 update: a report from the American Heart Association. Circulation. 2013;127:e6–e245. doi: 10.1161/CIR.0b013e31828124ad - PMC - PubMed
    1. Goette A, Kalman JM, Aguinaga L, Akar J, Cabrera JA, Chen SA, Chugh SS, Corradi D, D’Avila A, Dobrev D, et al. . EHRA/HRS/APHRS/SOLAECE expert consensus on atrial cardiomyopathies: definition, characterization, and clinical implication. Heart Rhythm. 2017;14:e3–e40. doi: 10.1016/j.hrthm.2016.05.028 - PMC - PubMed
    1. Voigt N, Li N, Wang Q, Wang W, Trafford AW, Abu-Taha I, Sun Q, Wieland T, Ravens U, Nattel S, et al. . Enhanced sarcoplasmic reticulum Ca2+ leak and increased Na+-Ca2+ exchanger function underlie delayed afterdepolarizations in patients with chronic atrial fibrillation. Circulation. 2012;125:2059–2070. doi: 10.1161/CIRCULATIONAHA.111.067306 - PMC - PubMed
    1. Voigt N, Heijman J, Wang Q, Chiang DY, Li N, Karck M, Wehrens XHT, Nattel S, Dobrev D. Cellular and molecular mechanisms of atrial arrhythmogenesis in patients with paroxysmal atrial fibrillation. Circulation. 2014;129:145–156. doi: 10.1161/CIRCULATIONAHA.113.006641 - PMC - PubMed
    1. Dobrev D, Nattel S. Calcium handling abnormalities in atrial fibrillation as a target for innovative therapeutics. J Cardiovasc Pharmacol. 2008;52:293–299. doi: 10.1097/FJC.0b013e318171924d - PubMed