

Etiology of hospital mortality in children living in low- and middle-income countries: a systematic review and meta-analysis
- PMID: 38910960
- PMCID: PMC11190367
- DOI: 10.3389/fped.2024.1397232
Etiology of hospital mortality in children living in low- and middle-income countries: a systematic review and meta-analysis
Abstract
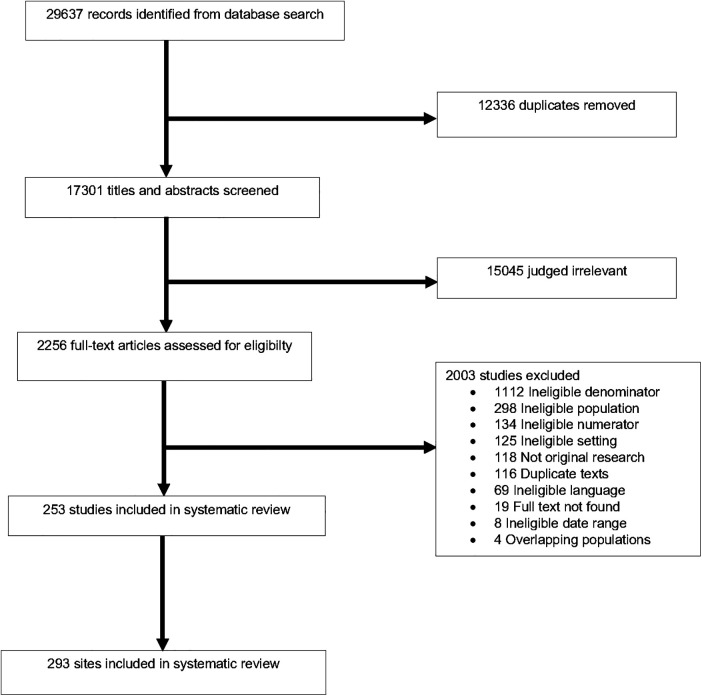
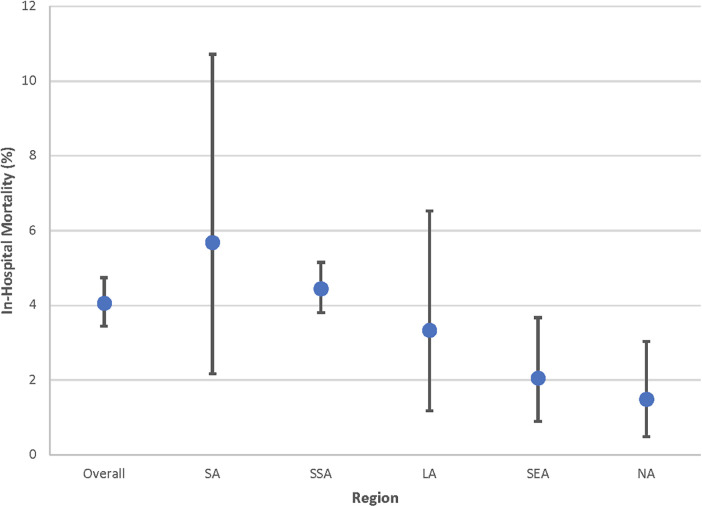
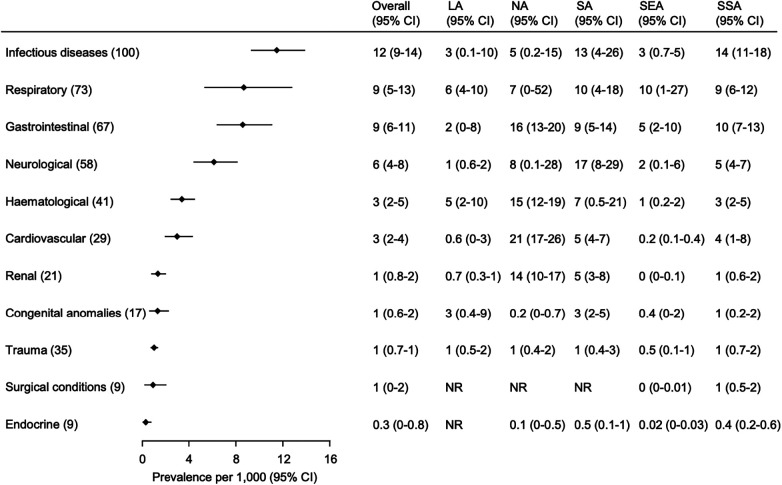
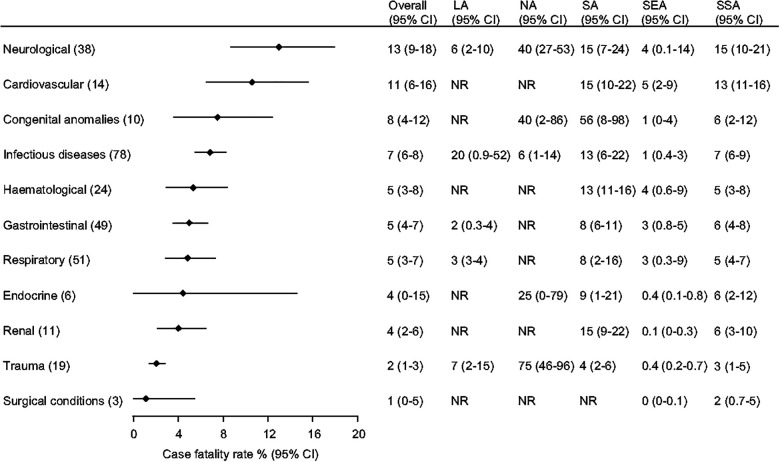
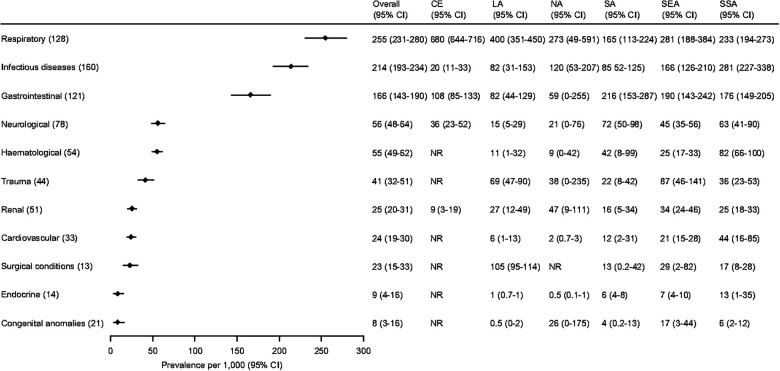
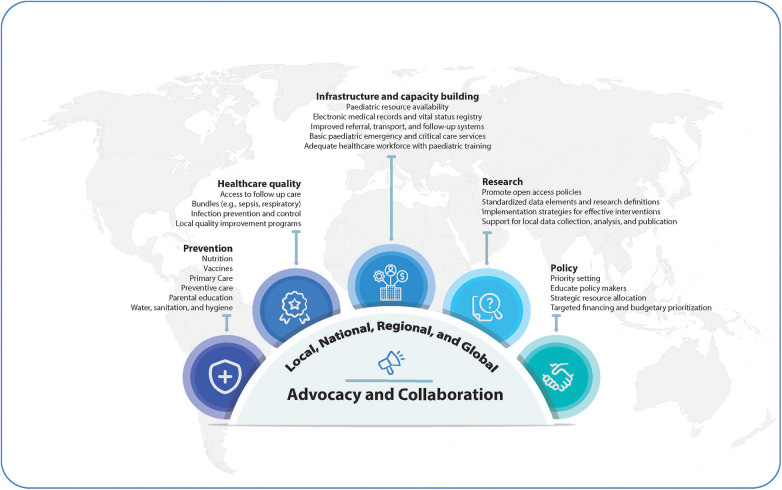
In 2019, 80% of the 7.4 million global child deaths occurred in low- and middle-income countries (LMICs). Global and regional estimates of cause of hospital death and admission in LMIC children are needed to guide global and local priority setting and resource allocation but are currently lacking. The study objective was to estimate global and regional prevalence for common causes of pediatric hospital mortality and admission in LMICs. We performed a systematic review and meta-analysis to identify LMIC observational studies published January 1, 2005-February 26, 2021. Eligible studies included: a general pediatric admission population, a cause of admission or death, and total admissions. We excluded studies with data before 2,000 or without a full text. Two authors independently screened and extracted data. We performed methodological assessment using domains adapted from the Quality in Prognosis Studies tool. Data were pooled using random-effects models where possible. We reported prevalence as a proportion of cause of death or admission per 1,000 admissions with 95% confidence intervals (95% CI). Our search identified 29,637 texts. After duplicate removal and screening, we analyzed 253 studies representing 21.8 million pediatric hospitalizations in 59 LMICs. All-cause pediatric hospital mortality was 4.1% [95% CI 3.4%-4.7%]. The most common causes of mortality (deaths/1,000 admissions) were infectious [12 (95% CI 9-14)]; respiratory [9 (95% CI 5-13)]; and gastrointestinal [9 (95% CI 6-11)]. Common causes of admission (cases/1,000 admissions) were respiratory [255 (95% CI 231-280)]; infectious [214 (95% CI 193-234)]; and gastrointestinal [166 (95% CI 143-190)]. We observed regional variation in estimates. Pediatric hospital mortality remains high in LMICs. Global child health efforts must include measures to reduce hospital mortality including basic emergency and critical care services tailored to the local disease burden. Resources are urgently needed to promote equity in child health research, support researchers, and collect high-quality data in LMICs to further guide priority setting and resource allocation.
Keywords: acute illness; critical illness; global health; hospital admission; hospital death; low- and middle-income countries; resource-limited settings.
© 2024 Kortz, Mediratta, Smith, Nielsen, Agulnik, Gordon Rivera, Reeves, O’Brien, Lee, Abbas, Attebery, Bacha, Bhutta, Biewen, Camacho-Cruz, Coronado Muñoz, deAlmeida, Domeryo Owusu, Fonseca, Hooli, Wynkoop, Leimanis-Laurens, Nicholaus Mally, McCarthy, Mutekanga, Pineda, Remy, Sanders, Tabor, Teixeira Rodrigues, Yuee Wang, Kissoon, Takwoingi, Wiens and Bhutta.
Conflict of interest statement
JC-C speaker for Novamed and Tecnoquimicas; received financial travel support from BAGO to attend the Colombian Congress of Pediatrics; participated in an Advisory Board for ZambonColombia; acted as an investigator in phase 2 and 3 clinical trials of Merck Sharp and Dhome drugs (antibiotics and monoclonal antibodies) that do not interfere in the course of this study. JL stock options in MERCK and MODERNA. The remaining authors declare that the research was conducted in the absence of any commercial or financial relationships that could be construed as a potential conflict of interest. The handling editor “CFO” declared a past co-authorship with the authors “NK & MOW”. The author(s) declared that they were an editorial board member of Frontiers, at the time of submission. This had no impact on the peer review process and the final decision.
Figures
References
-
- Sharrow D, Hug L, You D, Alkema L, Black R, Cousens S, et al. Global, regional, and national trends in under-5 mortality between 1990 and 2019 with scenario-based projections until 2030: a systematic analysis by the un inter-agency group for child mortality estimation. Lancet Glob Health. (2022) 10(2):e195–206. 10.1016/s2214-109x(21)00515-5 - DOI - PMC - PubMed
-
- United Nations. Global Indicator Framework for the Sustainable Development Goals and Targets of the 2030 Agenda for Sustainable Development Geneva. United Nations: Council EaS; (2018).
-
- Reiner RC, Jr., Olsen HE, Ikeda CT, Echko MM, Ballestreros KE, Manguerra H, et al. Diseases, injuries, and risk factors in child and adolescent health, 1990–2017: findings from the global burden of diseases, injuries, and risk factors 2017 study. JAMA Pediatr. (2019) 173(6):e190337. 10.1001/jamapediatrics.2019.0337 - DOI - PMC - PubMed