

A meta-analysis: elucidating diagnostic thresholds of peak systolic flow velocities in thyroid arteries for the discrimination of Graves' disease and destructive thyrotoxicosis
- PMID: 38911037
- PMCID: PMC11190173
- DOI: 10.3389/fendo.2024.1393126
A meta-analysis: elucidating diagnostic thresholds of peak systolic flow velocities in thyroid arteries for the discrimination of Graves' disease and destructive thyrotoxicosis
Abstract
Objective: This meta-analysis examines peak systolic velocities (PSVs) in thyroid arteries as potential biomarkers for thyroid disorders, which includes treated and untreated Graves' disease(GD) and destructive thyrotoxicosis(DT).
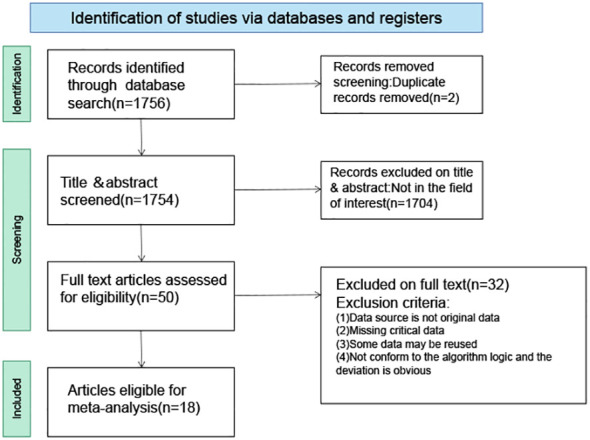
Methods: A search across databases including PubMed, Google Scholar, Embase, and Web of Science identified studies assessing peak systolic flow velocity in the inferior thyroid artery (ITA-PSV) and superior thyroid artery (STA-PSV) diagnostic efficacy in GD and DT.And the search was restricted to publications in the English language.The analysis compared STA-PSV and ITA-PSV across patient groups, evaluating intra-group variances and synthesizing sensitivity and specificity data.
Results: The analysis covered 18 studies with 1276 GD, 564 DT patients, and 544 controls. The difference of STA-PSV between GD group, DT group and normal group and the difference of ITA-PSV were analyzed in subgroups, and there was no statistical significance between subgroups when comparing any two groups. Normal subjects displayed intra-group ITA-PSV and STA-PSV differences with established cut-off values of 20.33 cm/s (95% CI, 17.48-23.18) for ITA-PSV and 25.61 cm/s (95% CI, 20.37-30.85) for STA-PSV. However, no significant intra-group differences were observed in the STA-PSV and ITA-PSV cut-off values among groups with GD or DT. The combined cut-off values for these patient groups and normal subjects were 68.63 cm/s (95% CI, 59.12-78.13), 32.08 cm/s (95% CI, 25.90-38.27), and 23.18 cm/s (95% CI, 20.09-26.28), respectively. The diagnostic odds ratio(DOR) for these values was 35.86 (95% CI, 18.21-70.60), and the area under the summary receiver operating characteristic (SROC) curve was 0.91, with a sensitivity estimate of 0.842 (95% CI, 0.772-0.866).
Conclusion: PSVs in thyroid arteries are useful diagnostic tools in distinguishing DT from GD. A PSV above 68.63 cm/s significantly improves GD diagnosis with up to 91% efficacy. No notable differences were found between superior and inferior thyroid arteries in these conditions.
Keywords: destructive thyrotoxicosis; graves’ disease; inferior thyroid artery; peak systolic velocities; superior thyroid artery.
Copyright © 2024 Li, Ding, Li, Fu, Sang, Yang, Tang, Gu and Sang.
Conflict of interest statement
The authors declare that the research was conducted in the absence of any commercial or financial relationships that could be construed as a potential conflict of interest.
Figures


Similar articles
-
Mean peak systolic velocity of superior thyroid artery for the differential diagnosis of thyrotoxicosis: a diagnostic meta-analysis.BMC Endocr Disord. 2019 Jun 6;19(1):56. doi: 10.1186/s12902-019-0388-x. BMC Endocr Disord. 2019. PMID: 31170960 Free PMC article.
-
Superior thyroid artery mean peak systolic velocity for the diagnosis of thyrotoxicosis in Japanese patients.Endocr J. 2010;57(5):439-43. doi: 10.1507/endocrj.k09e-263. Endocr J. 2010. PMID: 20513982 Clinical Trial.
-
Mean peak systolic velocity of the superior thyroid artery is correlated with radioactive iodine uptake in untreated thyrotoxicosis.J Int Med Res. 2012;40(2):640-7. doi: 10.1177/147323001204000226. J Int Med Res. 2012. PMID: 22613425
-
Advances in the differential diagnosis of transient hyperthyroidism in pregnancy and Graves' disease.Arch Gynecol Obstet. 2023 Aug;308(2):403-411. doi: 10.1007/s00404-022-06774-z. Epub 2022 Sep 16. Arch Gynecol Obstet. 2023. PMID: 36112207 Review.
-
Diagnostic imaging in thyrotoxicosis.Rays. 1999 Apr-Jun;24(2):273-300. Rays. 1999. PMID: 10509131 Review. English, Italian.
References
-
- Trebillod M, Petignot S, Pétrossians P. [Thyroiditis]. Rev medicale Liege. (2022) 77:361–9. - PubMed
-
- Malik SA, Choh NA, Misgar RA, Khan SH, Shah ZA, Rather TA, et al. . Comparison between peak systolic velocity of the inferior thyroid artery and technetium-99m pertechnetate thyroid uptake in differentiating Graves' disease from thyroiditis. Arch Endocrinol Metab. (2019) 63:495–500. doi: 10.20945/2359-3997000000165 - DOI - PMC - PubMed
Publication types
MeSH terms
LinkOut - more resources
Full Text Sources