. 2024 Apr:35:241-256.
doi: 10.1016/j.eng.2023.06.007. Epub 2023 Jul 25.

Intestinal Epithelial Axin1 Deficiency Protects Against Colitis via Altered Gut Microbiota

Affiliations

Intestinal Epithelial Axin1 Deficiency Protects Against Colitis via Altered Gut Microbiota

Shari Garrett et al. Engineering (Beijing). 2024 Apr.

Abstract

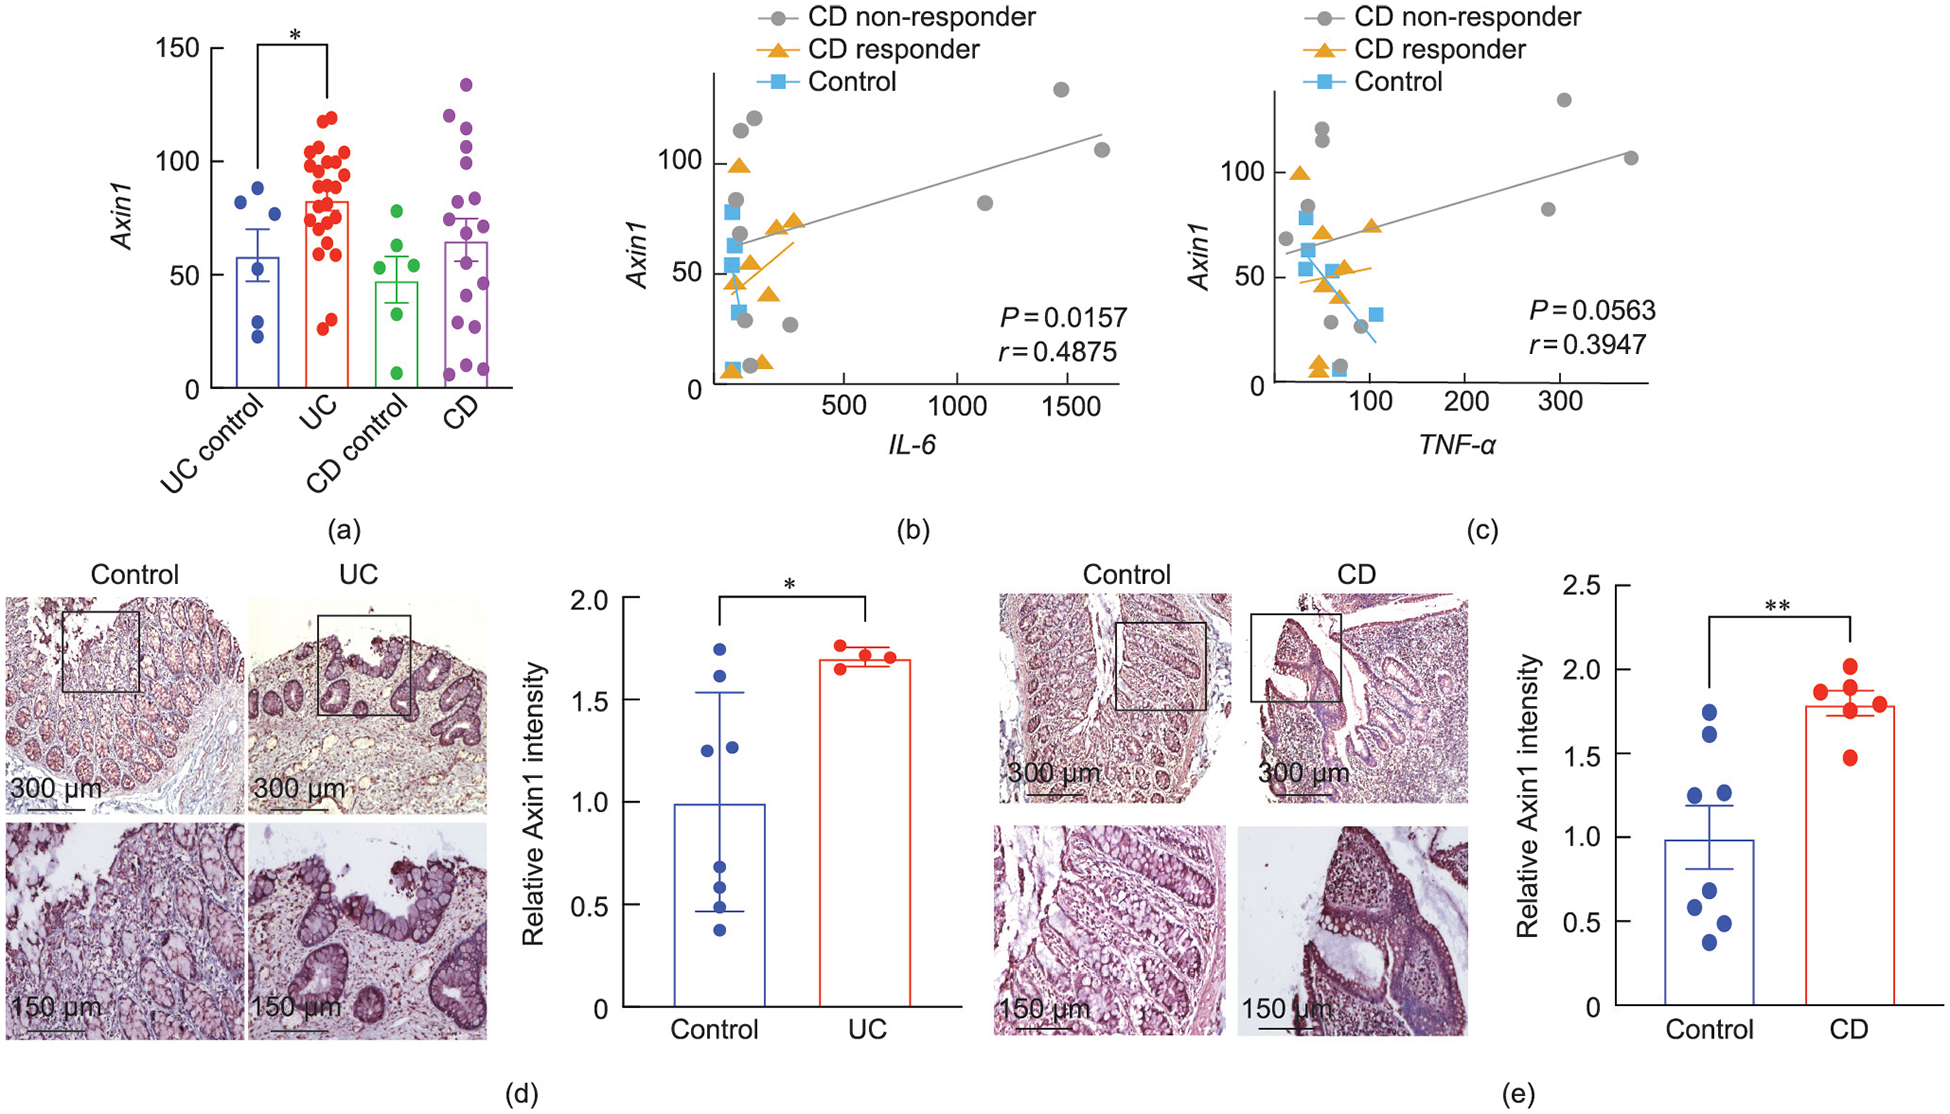
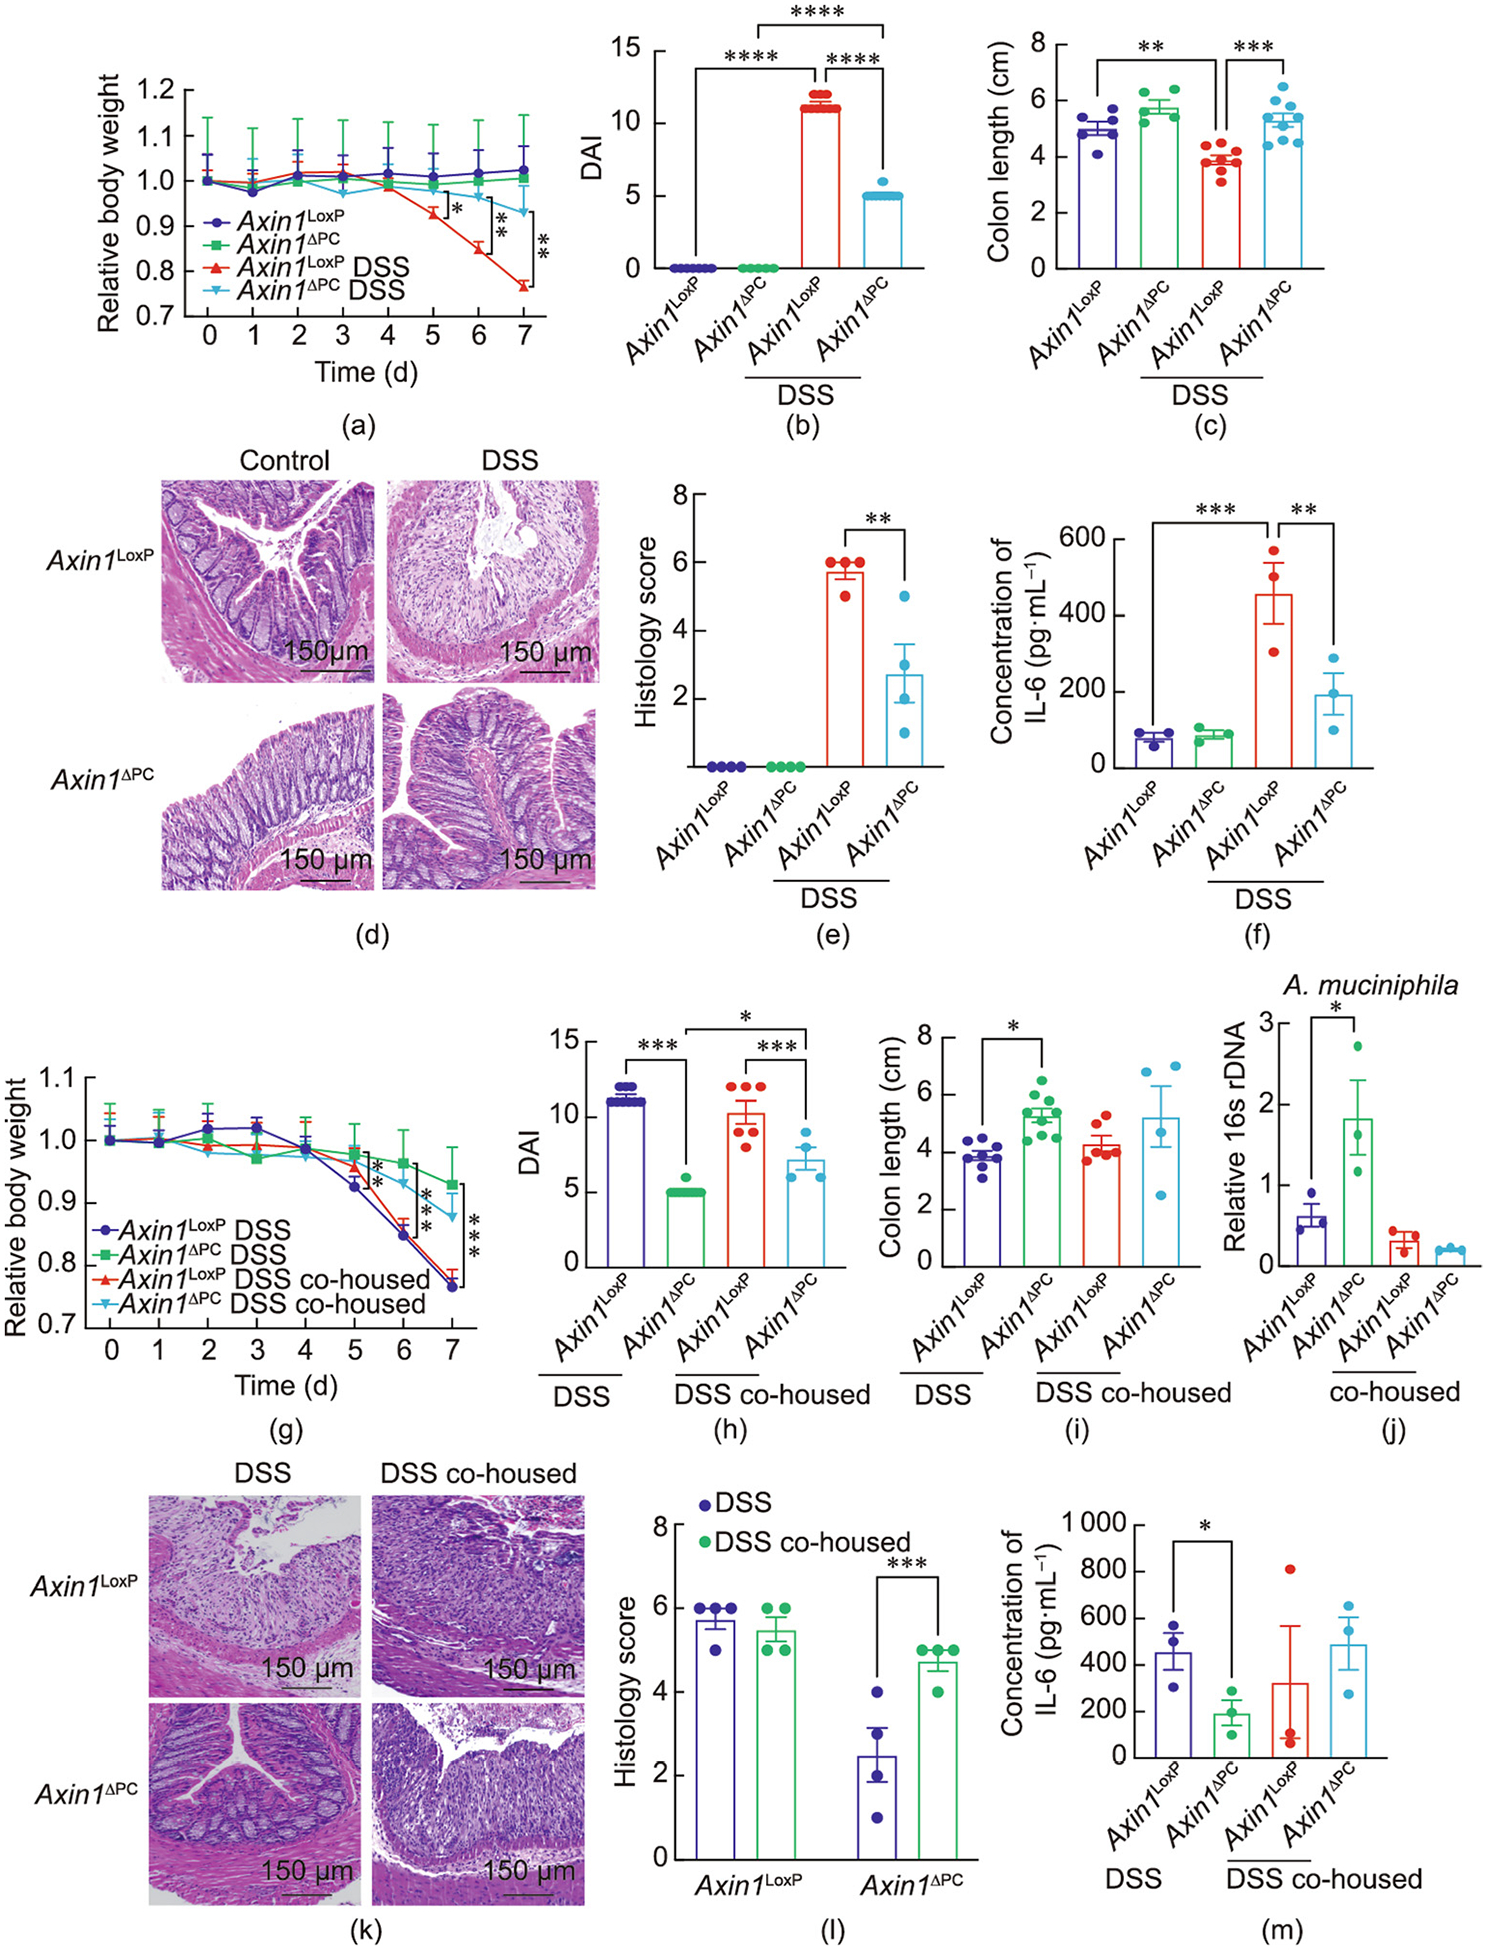
Intestinal homeostasis is maintained by specialized host cells and the gut microbiota. Wnt/β-catenin signaling is essential for gastrointestinal development and homeostasis, and its dysregulation has been implicated in inflammation and colorectal cancer. Axin1 negatively regulates activated Wnt/β-catenin signaling, but little is known regarding its role in regulating host-microbial interactions in health and disease. Here, we aim to demonstrate that intestinal Axin1 determines gut homeostasis and host response to inflammation. Axin1 expression was analyzed in human inflammatory bowel disease datasets. To explore the effects and mechanism of intestinal Axin1 in regulating intestinal homeostasis and colitis, we generated new mouse models with Axin1 conditional knockout in intestinal epithelial cell (IEC; Axin1 ΔIEC) and Paneth cell (PC; Axin1 ΔPC) to compare with control (Axin1 LoxP; LoxP: locus of X-over, P1) mice. We found increased Axin1 expression in the colonic epithelium of human inflammatory bowel disease (IBD). Axin1 ΔIEC mice exhibited altered goblet cell spatial distribution, PC morphology, reduced lysozyme expression, and enriched Akkermansia muciniphila (A. muciniphila). The absence of intestinal epithelial and PC Axin1 decreased susceptibility to dextran sulfate sodium (DSS)-induced colitis in vivo. Axin1 ΔIEC and Axin1 ΔPC mice became more susceptible to DSS-colitis after cohousing with control mice. Treatment with A. muciniphila reduced DSS-colitis severity. Antibiotic treatment did not change the IEC proliferation in the Axin1 Loxp mice. However, the intestinal proliferative cells in Axin1 ΔIEC mice with antibiotic treatment were reduced compared with those in Axin1 ΔIEC mice without treatment. These data suggest non-colitogenic effects driven by the gut microbiome. In conclusion, we found that the loss of intestinal Axin1 protects against colitis, likely driven by epithelial Axin1 and Axin1-associated A. muciniphila. Our study demonstrates a novel role of Axin1 in mediating intestinal homeostasis and the microbiota. Further mechanistic studies using specific Axin1 mutations elucidating how Axin1 modulates the microbiome and host inflammatory response will provide new therapeutic strategies for human IBD.

Keywords: Akkermansia muciniphila; Axin1; Bacteria; Immunity; Inflammatory bowel disease; Microbiome; Microbiome inflammation; Paneth cells; Wnt.


Conflict of interest statement

Compliance with ethics guidelines Shari declare Garrett, Yongguo Zhang, Yinglin Xia, and Jun Sun that they have no conflict of interest.

Figures

Fig. 1.
Fig. 1.
Expression of Axin1 is upregulated in human IBD. (a) Axin1 mRNA expression in patients with UC and CD. Values for healthy control, CD, and UC patients were obtained from GEO database GSE 16879. Data are expressed as mean ± SEM; UC controls (n = 6), UC (n = 24), CD controls (n = 6), CD (n = 18); one-way ANOVA; *P < 0.05. (b, c) Significantly coordinated expression of Axin1 and (b) IL-6 or (c) TNF-α in CD patients. We performed a correlation analysis of Axin1 against IL-6 or TNF-α in GEO database GSE 16879 of patients who responded (CD responder) and did not respond (CD non-responder) to the IBD drug infliximab prior to treatment. Control (n = 6), CD responder (n = 8), CD non-responder (n = 10), P = 0.0157, r = 0.4875 (IL-6); and control (n = 6), CD responder (n = 8), CD non-responder (n = 10), P = 0.0563, r = 0.3947 (TNF-α). (d) IHC staining of Axin1 protein in the colon of UC patients (n = 4) and healthy controls (n = 8). (e) IHC staining of Axin1 protein in the colon of CD patients (n = 6) and healthy controls (n = 8). Student’s unpaired t test, *P < 0.05, **P < 0.01.
Fig. 2.
Fig. 2.
Establishment of an Axin1ΔIEC mouse model. Axin1ΔIEC mice, which have Axin1 conditionally knocked out of IECs, were generated by crossing Axin1LoxP with villin-cre expressing mice. Villin is expressed only in IECs. (a) Real-time qPCR of Axin1 mRNA expression in small intestine and colon. (b) Axin1 Western blot analysis of intestinal Axin1 with villin as a marker for IECs. (c, d) IHC staining of Axin1 in the (c) small intestine and (d) colon of Axin1LoxP and Axin1ΔIEC mice. (e, f) FISH staining and indirect quantification of mucus thickness of (e) small intestine (n = 3) and (f) colon (n = 4) using general bacterial probe EUB388 (green). White dotted lines show the indirect thickness of mucus barrier. All data are expressed as mean ± SEM; n = 3 per group; Welch’s two-sample t test used for the colon in (a); all other figures analyzed using unpaired Student’s t test. *P < 0.05, **P < 0.01.
Fig. 3.
Fig. 3.
Intestinal epithelial Axin1 regulates GC distribution and PC morphology in the small intestine. (a) Alcian blue staining of GCs in villus of small intestine (n = 4, > 15 villus·mouse−1). (b) qRT-PCR mRNA expression of MUC2 in small intestine (n = 5). (c) Axin1LoxP and Axin1ΔIEC GC granules, by means of TEM. GCs were identified by the presence of cytoplasmic granules and their apical location (n = 3). (d) Average size of mucin granules in Axin1LoxP and Axin1ΔIEC mice (n = 3, > 15 cells·mouse−1). (e) IF staining of lysozyme in crypts of small intestine of Axin1LoxP and Axin1ΔIEC mice. (f) Percentage of PCs displaying normal (D0) and abnormal (D1–D3) lysozyme morphology (n = 6, > 15 crypts·mouse−1). (g) Lysozyme (Lyz1) mRNA in Axin1 mice (n = 6). (h) Abnormal PC granules in Axin1 by TEM. PCs were identified by the presence of cytoplasmic granules and basal location (n = 3, > 50 granules·mouse−1). (i) Lysozyme protein expression by Western blot in Axin1 mice (n = 4). (j) Shannon diversity index of fecal bacteria between Axin1LoxP and Axin1ΔIEC mice. Data is presented as mean ± SEM; n = 10–12 per group; Welch’s t test. (k) PCA plot visualizing the difference in fecal bacteria between Axin1LoxP (light blue) and Axin1ΔIEC mice (red). The axes explain 27.3% of variation of the separation between the two groups (n = 10–12 per group). (l) Percent abundance of top genera in feces of Axin1LoxP and Axin1ΔIEC mice. All unidentified or other identified species are grouped in “other” as indicated. Genera are color coordinated, as indicated by the legend. Multiple bars indicate one mouse per bar. All aforementioned data is expressed as mean ± SEM; two-way ANOVA with Tukey’s method for adjusting multiple comparisons was used (f) and Wilcoxon rank sum test was used in (b) and (h); all the analyses in other figures were analyzed using unpaired Student’s t test. *P < 0.05, **P < 0.01, ****P < 0.0001. PC1: the first principal component; PC2: the second principal component.
Fig. 4.
Fig. 4.
Loss of intestinal epithelial Axin1 confers protection in DSS-induced colitis. (a) Relative body weight changes in mice administered 5% DSS for 7 days. Each dot represents a minimum of six mice. Data presented as mean ± SEM; n = 6–9; two-way ANOVA; **P < 0.01. (b) Colitis severity, (c) colon length, and (d) cecum length at day 7 in Axin1 mice. (e) H&E histology of distal colons at day 7. (f) Histology score of control and DSS-treated mice (n = 3). (g–l) Serum cytokine levels of (g) TNF-α, (h) IL-6, (i) IL-18, (j) IL-5, (k) eotaxin, and (l) IL-27 in Axin1 mice (n = 3). Aforementioned data are expressed as mean ± SEM; two-way ANOVA; *P < 0.05, ***P < 0.001, ****P < 0.0001.
Fig. 5.
Fig. 5.
Increased susceptibility to DSS-induced colitis in Axin1ΔIEC mice after cohousing with Axin1LoxP mice. Axin1LoxP and Axin1ΔIEC mice were co-housed for 4 weeks and then treated with 5% DSS for 7 days. (a) Relative body weight changes in mice with DSS. Each dot represents a minimum of four mice. Data expressed as mean ± SEM; n = 4–8; two-way ANOVA; *P < 0.05. (b) Colitis severity, (c) colon length, and (d) cecum length at day 7 in Axin1 mice. Aforementioned data are expressed as mean ± SEM; n = 4–8; two-way ANOVA; *P < 0.05, ***P < 0.001, ****P < 0.0001. (e) qRT-PCR of A. muciniphila rDNA expression in Axin1 mice housed alone and co-housed (mean ± SEM; n = 3; one-way ANOVA; **P < 0.01). (f) H&E histology of distal colons at day 7. (g) Histology score of Axin1 DSS mice (mean ± SEM; n = 3; one-way ANOVA; ***P < 0.001). (h) TNF-α, (i) IL-6, and (j) IL-18 serum cytokines in DSS Axin1LoxP and DSS Axin1ΔIEC DSS mice (mean ± SEM; n = 3; unpaired Student’s t test comparing Axin1LoxP and Axin1ΔPC mice; *P < 0.05).
Fig. 6.
Fig. 6.
Decreased susceptibility to DSS-induced colitis in Axin1LoxP mice with A. muciniphila treatment (AKK). Axin1LoxP and Axin1ΔIEC mice were treated with AKK during 7-day 5% DSS challenge. (a) Relative body weight changes in mice challenged with DSS and mice challenged with DSS + AKK. Each dot represents a minimum of eight mice. Data expressed as mean ± SEM; n = 8–10; unpaired Student’s t test compared between Axin1LoxP and Axin1ΔPC mice; *P < 0.05. (b) Colitis severity, (c) colon length, and (d) cecum length at day 7 in Axin1 mice. Aforementioned data are expressed as mean ± SEM; n = 8; two-way ANOVA; *P < 0.05, **P < 0.01, ****P < 0.0001. (e) Expression levels of A. muciniphila rDNA in fecal samples of Axin1LoxP and Axin1ΔIEC mice with DSS + AKK treated groups, via qRT-PCR. Data are expressed as mean ± SD; n = 3; one-way ANOVA; **P < 0.01, ***P < 0.001.
Fig. 7.
Fig. 7.
Generation of Axin1ΔPC mice with altered PC morphology and GC distribution. Crossing Axin1LoxP mice with Defa6-cre mice generates a PC-specific knockout of Axin1 (Axin1ΔPC). Defa6 is only expressed in PCs. (a) Small IECs were digested into single cells, then stained with anti-CD24 antibody and sorted by flow cytometry (n = pool of three mice). (b) PC Axin1 knockdown was confirmed by qRT-PCR from CD24+ cells (n = pool of three mice). (c) Lysozyme (Lyz1) mRNA expression of Axin1LoxP and Axin1ΔIEC isolated PCs (n = pool of three mice). (d) IF staining of lysozyme in crypts of small intestine of Axin1LoxP and Axin1ΔPC mice. (e) Increased number of abnormal (D1–D3) lysozyme morphology in PCs of Axin1ΔPC mice (n = 4, > 15 crypts·mouse−1). (f) Alcian blue staining of GCs in villus of small intestine in Axin1LoxP and Axin1ΔPC mice (n = 4). All aforementioned data are expressed as mean ± SEM; two-way ANOVA with Tukey’s method for adjusting multiple comparisons was used to analyze the two factors among four groups in (f) and unpaired Student’s t test was used to compare the differences between two groups in all other figures. *P < 0.05, **P < 0.01, ***P < 0.001. FSC: forward scatter.
Fig. 8.
Fig. 8.
Axin1ΔPC mice are resistant to DSS-induced colitis and susceptible after co-housing with Axin1LoxP mice. Axin1LoxP and Axin1ΔPC mice were co-housed for 4 weeks and then treated with 5% DSS for 7 days. (a) Relative body weight change during DSS administration, Axin1LoxP mice. Each dot represents a minimum of five mice; two-way ANOVA, *P < 0.05, **P < 0.01. (b) Colitis severity and (c) colon length at day 7 in Axin1 mice. One-way ANOVA, **P < 0.01, ***P < 0.01, ****P < 0.01. (d) H&E histology of distal colons at day 7. (e) Histology score of distal colons at day 7. Data expressed as mean ± SEM; n = 4; one-way ANOVA, **P < 0.01. (f) IL-6 serum cytokine levels in Axin1 mice. Data presented as mean ± SEM; n = 3; two-way ANOVA, **P < 0.01, ***P < 0.001. (g) Axin1LoxP and Axin1ΔIEC mice were co-housed for 4 weeks and then treated with 5% DSS for 7 days. Relative body weight changes in mice with DSS. Each dot represents a minimum of five mice; two-way ANOVA, **P < 0.01, ***P < 0.01. (h) Colitis severity and (i) colon length at day 7. Aforementioned data is expressed as mean ± SEM; n = 4–9; two-way ANOVA, *P < 0.05, ***P < 0.001. (j) qRT-PCR of A. muciniphila rDNA level in Axin1 mice housed alone and co-housed. Data expressed as mean ± SEM; n = 3; one-way ANOVA, *P < 0.05. (k) H&E histology and (l) histology score at day 7 of DSS administration. Data expressed as mean ± SEM; n = 4; two-way ANOVA, ***P < 0.001. (m) Serum IL-6 levels in Axin1 mice housed alone and co-housed. Data presented as mean ± SEM; n = 3; unpaired Student’s t test comparison between Axin1LoxP and Axin1ΔPC mice, *P < 0.05, **P < 0.01.
Fig. 9.
Fig. 9.
Antibiotic treatment reduced the proliferation marker PCNA in the ileum and colon of Axin1ΔIEC mice. (a) Schematic overview of mice treated with antibiotics. Axin1LoxP or Axin1ΔIEC mice were treated with or without antibiotics (1.0 mg·mL−1 metronidazole and 0.3 mg·mL−1 clindamycin) in their drinking water for 3 weeks. (b) Decreased PCNA expression in ileum of Axin1ΔIEC mice with antibiotics, via IF staining. Images are from a single experiment and are representative of three mice per group. PCNA positive count number of three crypts were randomly selected for measurement per mouse. Data are expressed as mean ± SD; n = 9; one-way ANOVA, *P < 0.05, ****P < 0.0001. (c) Decreased PCNA expression in the colon of Axin1ΔIEC mice treated with antibiotics, via IF staining. Images are from a single experiment and are representative of three mice per group. Three crypts were randomly selected for measurement per mouse. Data are expressed as mean ± SD; n = 9; one-way ANOVA, **P < 0.01, ***P < 0.001. (d, e) Decreased expression of PCNA protein in the (d) ileum and (e) colon of Axin1ΔIEC mice treated with antibiotics, via Western blots. Data are expressed as mean ± SD; n = 3; one-way ANOVA, **P < 0.01, ***P < 0.001.
Fig. 10.
Fig. 10.
Proposed model of Axin1 protection against colitis via gut microbiota alterations. Deletion of intestinal epithelial and PC Axin1 results in altered goblet and PC morphology, increased MUC2, and decreased lysozyme expression. In addition, loss of Axin1 results in increased A. muciniphila and reduced thickness of the mucus border. The presence of A. muciniphila in Axin1 knockout mice is the driver of protection against DSS-induced intestinal inflammation.

References

    1. Alatab S, Sepanlou SG, Ikuta K, Vahedi H, Bisignano C, Safiri S, et al. GBD 2017 Inflammatory Bowel Disease Collaborators. The global, regional, and national burden of inflammatory bowel disease in 195 countries and territories, 1990–2017: a systematic analysis for the Global Burden of Disease Study 2017. Lancet Gastroenterol Hepatol 2020;5(1):17–30. - PMC - PubMed
    1. Alshehri D, Saadah O, Mosli M, Edris S, Alhindi R, Bahieldin A. Dysbiosis of gut microbiota in inflammatory bowel disease: current therapies and potential for microbiota-modulating therapeutic approaches. Bosn J Basic Med Sci 2021;21 (3):270–83. - PMC - PubMed
    1. Schatoff EM, Leach BI, Dow LE. Wnt signaling and colorectal cancer. Curr Colorectal Cancer Rep 2017;13(2):101–10. - PMC - PubMed
    1. Moparthi L, Koch S. Wnt signaling in intestinal inflammation. Differentiation 2019;108:24–32. - PubMed
    1. Gujral TS, Karp ES, Chan M, Chang BH, MacBeath G. Family-wide investigation of PDZ domain-mediated protein–protein interactions implicates β-catenin in maintaining the integrity of tight junctions. Chem Biol 2013;20(6):816–27. - PMC - PubMed

LinkOut - more resources