. 2024 Jun 8;4(1):vbae085.
doi: 10.1093/bioadv/vbae085. eCollection 2024.

Demultiplexing of single-cell RNA-sequencing data using interindividual variation in gene expression

Affiliations

Demultiplexing of single-cell RNA-sequencing data using interindividual variation in gene expression

Isar Nassiri et al. Bioinform Adv. .

Abstract

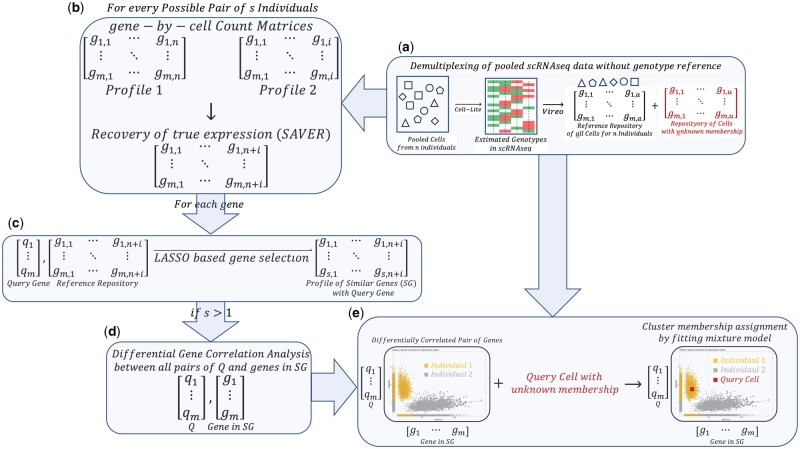
Motivation: Pooled designs for single-cell RNA sequencing, where many cells from distinct samples are processed jointly, offer increased throughput and reduced batch variation. This study describes expression-aware demultiplexing (EAD), a computational method that employs differential co-expression patterns between individuals to demultiplex pooled samples without any extra experimental steps.

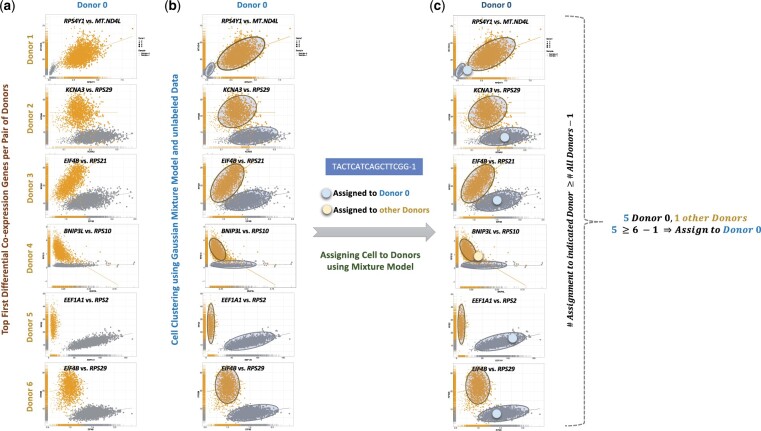
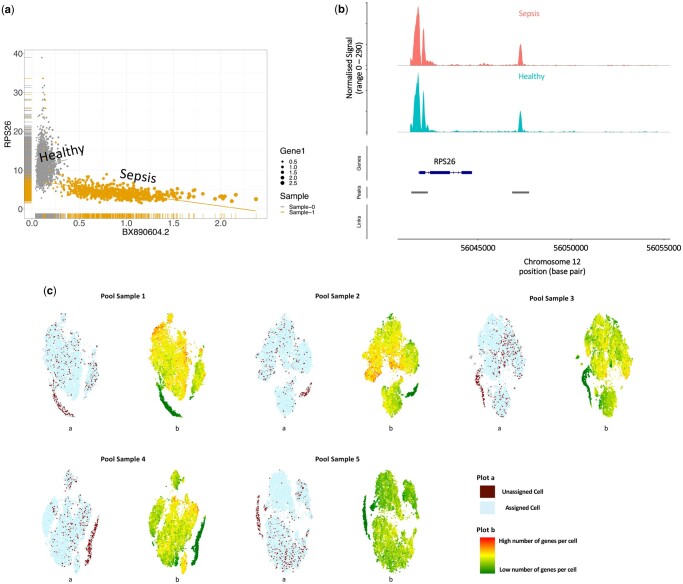
Results: We use synthetic sample pools and show that the top interindividual differentially co-expressed genes provide a distinct cluster of cells per individual, significantly enriching the regulation of metabolism. Our application of EAD to samples of six isogenic inbred mice demonstrated that controlling genetic and environmental effects can solve interindividual variations related to metabolic pathways. We utilized 30 samples from both sepsis and healthy individuals in six batches to assess the performance of classification approaches. The results indicate that combining genetic and EAD results can enhance the accuracy of assignments (Min. 0.94, Mean 0.98, Max. 1). The results were enhanced by an average of 1.4% when EAD and barcoding techniques were combined (Min. 1.25%, Median 1.33%, Max. 1.74%). Furthermore, we demonstrate that interindividual differential co-expression analysis within the same cell type can be used to identify cells from the same donor in different activation states. By analysing single-nuclei transcriptome profiles from the brain, we demonstrate that our method can be applied to nonimmune cells.

Availability and implementation: EAD workflow is available at https://isarnassiri.github.io/scDIV/ as an R package called scDIV (acronym for single-cell RNA-sequencing data demultiplexing using interindividual variations).


Conflict of interest statement

None declared.

Figures

Figure 1.
Figure 1.
Workflow for computational demultiplexing of unrelated individuals in scRNA-seq. (a) First, we demultiplex pooled samples (vireo) (Huang et al. 2019) using genetic differences inferred from scRNA-seq data (cellsnp-lite) (Huang and Huang 2021). (b) Next, for each pair of individuals in the output of genetic demultiplexing, we estimate accurate gene expression values for all genes. (g) per cell using the gene expression recovery for single-cell RNA sequencing (SAVER) (Huang et al. 2018). (c) We apply the LASSO to obtain the most representative subset of genes (s) (Nassiri and McCall 2018) related to query gene (q). (d) We apply differential gene correlation analysis between pairs of query gene (q) and related genes selected by LASSO (SG), to identify the top first DCE genes interindividual (see section 2). (e) The co-expression patterns of the top first DCE genes (q and g) are used to fit a mixture model and reconstruct the sample identity of each cell.
Figure 2.
Figure 2.
An example of EAD is to assign an indicated cell to one of seven individuals using a mixture model. Genetic-based demultiplexing already suggested that the cell most likely belongs to donor-0 using the partial genotypic data from state of the individuals in a pool of donors. Now, using the gene expression profiles, we want to check the best-guess assignment obtained from genetic-based demultiplexing. (a) We select the top first pair of DCE genes per donor-0 compared to other donors. The expression pattern of a pair of DCE genes is used to create distinct clusters of cells across individuals. (b) We use a mixture model to predict a cluster of unlabelled cells and reconstruct their sample identity. (c) For an indicated cell (TACTCATCAGCTTCGG-1), we consider all possibilities and most of the time the cell is assigned to donor 0. We confirm that the cell belongs to donor 0 if we successfully assign it to donor 0 for an equal or greater number of pairs of donors, minus 1.
Figure 3.
Figure 3.
(a) The results of quality control and the number of called variants for two single-cell sample pools made of 16 samples. (b) Example of top DCE genes (EEF1A and RPS4X) in PBMCs, distinguishes clusters of cells per individual. Pairwise correlations can be visualized as a network. The result shows that EEF1A and RPS4X display co-expression only in donor 1 (red arrow), which could not have been detected based on all individual cells or donor 2. (c) The results of ontology gene set enrichment analysis show a significant association of interindividual DCE genes with the regulation of metabolic processes. The enrichment analysis of cellular components in the dot plot shows associations with mitochondria, ribosomes, cellular macromolecular super complexes, or organelles related to metabolism. (d) Comparison between the methods in terms of prevalence (abbreviations: EAD, expression-aware demultiplexing; GD, genetic-based demultiplexing; mixed, a combination of ED and GD results). According to prevalence, a combination (mixed) of GD and EAD leads to better results for Monocytes and T cells. The colour density reflects the continuous data range to compare values. Lower values are shown to be the most profitable. The range of prevalence values is between 0 and 1.0.
Figure 4.
Figure 4.
(a, b) The knee, quantification, and UMAP plots show the location of unassigned cells in two sample pools. We ensure that the background red-coloured cells appear on top by dividing the points into different layers and plotting the red points after the black points (Nassiri et al. 2023). Number of detected gene plots shows an association between cell assignment and the number of genes per cell. (c) Boxplots show a significant difference in the mean number of genes per cell across the classes of assigned and unassigned cells using EAD.
Figure 5.
Figure 5.
(a) Confounding variables influence the variation in gene expression between individuals. We stratified melanoma patients based on the type of treatment with immune checkpoint blockades (Ipilimumab + Nivolumab (Ipi + Nivo) or Pembrolizumab (Pembro)) and sex (male or female). If these factors cause DCE patterns among individuals, we expect the appearance and disappearance of the top first examples of DCE genes across classes. We found no such an accumulation. For example, the expression of EEF1A1 and RPS4X represent individual 7 and we do not see a similar DCE pattern for matched pairs of individuals based on treatment or sex (e.g. Male and Female). (b) The results of quality control and the number of called variants per cell for a single-cell pool sample made of 6 isogenic mice. We applied the scater package to filter out single-cell profiles that were outliers for any metrics, as they are considered low-quality libraries (McCarthy et al. 2017). (c) A pool of six samples with known cell labels from isogenic individuals was used as input for an EAD workflow. DCE patterns across pairs of donors could not distinguish interindividual differences in the gene expression including genes related to the metabolic pathway (e.g. ugp2 and Miox genes), and we only see differences related to the treatment (e.g. sample 4 versus sample 2).
Figure 6.
Figure 6.
Demultiplexing with genotype reference (Demuxlet) provides a source of ground truth for benchmarking the performance of demultiplexing algorithms. (a and b) The results of quality control including the percentage of filter-out cells as a doublet and the number of called variants per cell for five single-cell pool samples (10× lanes) made of 23 sepsis and seven healthy individuals. (c) Percentage of correct (TP and TN), and incorrect assigned cells (FP and FN) using EAD, GD demultiplexing (vireo), and the combination of genetic-based and expression-aware approaches (Mixed). The outcomes are given for each 10× lane and for all 10× lanes. (d) The confusion matrices were utilized to generate the key metrics and give a comprehensive assessment of demultiplexing methods that do not require a reference genome. Abbreviations: EAD, expression-aware demultiplexing; GD, genetic-based demultiplexing; Mixed-D, mixed demultiplexing; NPV, negative predictive value; CSI, critical success index.
Figure 7.
Figure 7.
(a) Example of the top interindividual DCE genes provide a distinct cluster of cells per individual. (b) There are no significant differences in chromatin accessibility across states observed in the case of the top DCE gene. (c) Association between cell assignment and the number of genes per cell. Some unassigned cells show a low number of genes per cell, which means filtering out unassigned cells can improve the accuracy of cell calls.
Figure 8.
Figure 8.
(a) A distinct cluster of cells from the same donor but a different stimulation condition is present in an example of the top DCE genes. (b) Summaries of cell hashing demultiplexing results showing the number of singlets called per 10× lane along with the percentage of doublets and negative cells (both filtered out). (c–e) Evaluating the impact of different thresholds for EA sample demultiplexing on accuracy, percentage of assigned cells, and percentage of genetic-based demultiplexing doublets in EAD assignments by specifying various thresholds (T).
Figure 9.
Figure 9.
A few examples of the many interindividual DCE genes that have been identified in the substantia nigra and cortex. These genes play important roles in a variety of neurological processes, and their dysregulation can contribute to the development of neurological disorders. More investigation is required to fully comprehend the roles of these genes in the brain and their potential as therapeutic targets for neurological disorders. (a, b) Examples of interindividual DCE pattern in the substantia nigra and cortex. (c) The t-SNE project of transcriptionally and functionally distinct clusters, highlighting microglia and neuron cell type groups, is presented. Pink/Red cells have passed the threshold of cell type enrichment (Nassiri et al. 2023). (d) Examples of DCE patterns between cell types in the substantia nigra and cortex. (e) A pair of genes that exhibit differential co-expression but not differential expression. The analyses were carried out by employing single-cell expression profiles across the SN and cortex regions of a donor. In each region, the single-cell expression distributions of CTNNA3 and FAM221A genes are visualized by a violin plot. The expression levels of both genes decrease from SN to cortex, but only CTNNA3 has a significant differential expression. (f) The CTNNA3 and FAM221A gene pairs exhibit DCE patterns in the SN and cortex.

References

    1. Agarwal D, Sandor C, Volpato V. et al. A single-cell atlas of the human substantia nigra reveals cell-specific pathways associated with neurological disorders. Nat Commun 2020;11:4183. - PMC - PubMed
    1. Almeida A, Loy A, Hofmann H.. ggplot2 compatible quantile-quantile plots in R. R J 2018;10:248–61.
    1. Apostolidou S, Harbauer T, Lasch P. et al. Fatal COVID-19 in a child with persistence of SARS-CoV-2 despite extensive multidisciplinary treatment: a case report. Children (Basel) 2021;8:564. - PMC - PubMed
    1. Auerbach BJ, Hu J, Reilly MP. et al. Applications of single-cell genomics and computational strategies to study common disease and population-level variation. Genome Res 2021;31:1728–41. - PMC - PubMed
    1. Badia-I-Mompel P, Wessels L, Müller-Dott S. et al. Gene regulatory network inference in the era of single-cell multi-omics. Nat Rev Genet 2023;24:739–54. - PubMed

LinkOut - more resources