. 2024 Jun 20:19:11772719241257739.
doi: 10.1177/11772719241257739. eCollection 2024.

Mass Spectrometry Proteomics Characterization of Plasma Biomarkers for Colorectal Cancer Associated With Inflammation

Affiliations

Mass Spectrometry Proteomics Characterization of Plasma Biomarkers for Colorectal Cancer Associated With Inflammation

Víctor Urbiola-Salvador et al. Biomark Insights. .

Abstract

Background: Colorectal cancer (CRC) prognosis is determined by the disease stage with low survival rates for advanced stages. Current CRC screening programs are mainly using colonoscopy, limited by its invasiveness and high cost. Therefore, non-invasive, cost-effective, and accurate alternatives are urgently needed.

Objective and design: This retrospective multi-center plasma proteomics study was performed to identify potential blood-based biomarkers in 36 CRC patients and 26 healthy volunteers by high-resolution mass spectrometry proteomics followed by the validation in an independent CRC cohort (60 CRC patients and 44 healthy subjects) of identified selected biomarkers.

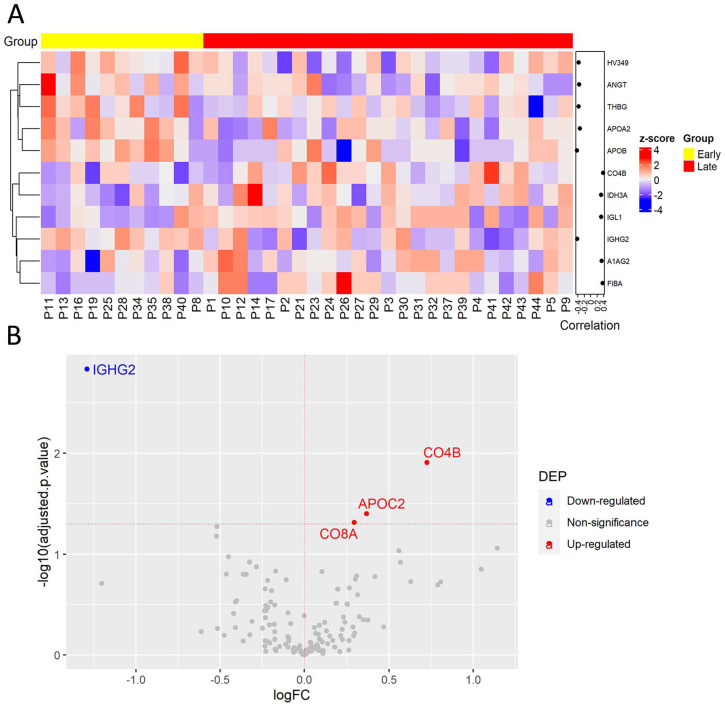
Results: Among the 322 identified plasma proteins, 37 were changed between CRC patients and healthy volunteers and were associated with the complement cascade, cholesterol metabolism, and SERPIN family members. Increased levels in CRC patients of the complement proteins C1QB, C4B, and C5 as well as pro-inflammatory proteins, lipopolysaccharide-binding protein (LBP) and serum amyloid A4, constitutive (SAA4) were revealed for first time. Importantly, increased level of C5 was verified in an independent validation CRC cohort. Increased C4B and C8A levels were correlated with cancer-associated inflammation and CRC progression, while cancer-associated inflammation was linked to the acute-phase reactant leucine-rich alpha-2-glycoprotein 1 (LRG1) and ceruloplasmin. Moreover, a 4-protein signature including C4B, C8A, apolipoprotein C2 (APO) C2, and immunoglobulin heavy constant gamma 2 was changed between early and late CRC stages.

Conclusion: Our results suggest that C5 could be a potential biomarker for CRC diagnosis. Further validation studies will aid the application of these new potential biomarkers to improve CRC diagnosis and patient care.

Keywords: Plasma proteomics; biomarker; cancer progression; colorectal cancer; complement cascade; diagnosis; inflammation; mass spectrometry.


Conflict of interest statement

The author(s) declared no potential conflicts of interest with respect to the research, authorship, and/or publication of this article.

Figures

Figure 1.
Figure 1.
LC-MS/MS analysis of plasma proteome from CRC patients and healthy controls. (A) Venn diagram of identified proteins in CRC patients and healthy individuals. (B) Representative scatter plots of log-transformed areas for the 3 technical replicates from a CRC patient (P1) with their corresponding Pearson correlation coefficients and P values. (C) Abundance protein ranking plot with the mean of log-transformed areas from healthy subjects (red) and CRC patients (blue).
Figure 2.
Figure 2.
Functional annotation of the identified plasma proteins. (A) Interaction network of over-represented cellular component Gene Ontology (GO) terms with an organic l1ayout. (B) Interaction network of over-represented GO terms of biological processes with an organic layout. (C) Amplification of the subnetwork of GO terms from immune and defense responses with a tree layout.
Figure 3.
Figure 3.
Colorectal cancer (CRC) development causes plasma protein changes involved in complement cascades and cholesterol metabolism. (A) Principal Component Analysis of CRC patients and healthy subjects using the relative abundances of all quantified proteins. (B) Volcano plot of statistical significance against fold-change of proteins between CRC patients and healthy individuals. Colored dots indicate statistically differentially expressed proteins (DEPs) calculated by the general linear model approach. (C) Dot plot of KEGG pathway enrichment combined with STRING protein-protein interaction network analysis from DEPs between CRC patients and healthy subjects. (D) Protein-protein interaction network of DEPs between CRC patients and healthy individuals from STRING database query with a 0.7 confidence cut-off. The size of nodes indicates the degree of connectivity of the nodes. The red and blue dots/nodes represent up-regulation and down-regulation in CRC patients, respectively. FC, Fold Change; p, p-value; PC, Principal Component.
Figure 4.
Figure 4.
Plasma protein changes induced by cancer-associated inflammation in CRC patients. (A) Heatmap of proteins with significant correlation with inflammatory status. Protein expression is transformed with a z-score by row normalization and distributed by hierarchical clustering. The correlation coefficients (right) indicate a positive/negative correlation for each protein. (B) Volcano plot of statistical significance against fold-change of proteins between CRC patients with inflammation and without inflammation. Dots indicate individual proteins and the red and blue dots represent significant up-regulation and down-regulation in CRC patients with inflammation, respectively.
Figure 5.
Figure 5.
Plasma protein expression differences between early and late stages of CRC. (A) Heatmap of proteins with significant correlation with tumor stage. Protein expression is transformed with a z-score by row normalization and distributed by hierarchical clustering. The correlation coefficients (right) indicate a positive/negative correlation for each protein. (B) Volcano plot of statistical significance against fold-change of proteins between CRC patients with early tumor stage and with late tumor stage. Dots indicate individual proteins and the red and blue dots represent significant up-regulation and down-regulation in CRC patients with late tumor stage, respectively.
Figure 6.
Figure 6.
Complement protein C5 is a potential diagnostic biomarker for CRC. Box and whisker plots of (A) log-transformed areas of C5 in the discovery cohort calculated the significance by general linear model approach, (B) C5 concentrations measured by ELISA in the validation cohort calculated by Student t-test, and (C) log-transformed areas of a quantified peptide from C5a with the sequence AFTECCVVASQLR in the discovery cohort for CRC patients and healthy subjects calculated by Student t-test. * indicates statistical significance with a P value < .05, and *** indicates a P value < .001.

References

    1. Sung H, Ferlay J, Siegel RL, et al. Global Cancer Statistics 2020: GLOBOCAN estimates of incidence and mortality worldwide for 36 cancers in 185 countries. CA Cancer J Clin. 2021;71:209-249. - PubMed
    1. Cervantes A, Adam R, Roselló S, et al. Metastatic colorectal cancer: ESMO Clinical Practice Guideline for diagnosis, treatment and follow-up. Ann Oncol. 2023;34:10-32. - PubMed
    1. Xi Y, Xu P. Global colorectal cancer burden in 2020 and projections to 2040. Transl Oncol. 2021;14:101174. - PMC - PubMed
    1. Martins BAA, de Bulhões GF, Cavalcanti IN, et al. Biomarkers in colorectal cancer: the role of translational proteomics research. Front Oncol. 2019;9:1284. - PMC - PubMed
    1. Jenkins RW, Barbie DA, Flaherty KT. Mechanisms of resistance to immune checkpoint inhibitors. Br J Cancer. 2018;118:9-16. - PMC - PubMed

LinkOut - more resources