. 2024 Jun 5:15:1349456.
doi: 10.3389/fpls.2024.1349456. eCollection 2024.

Metabolomics and physio-chemical analyses of mulberry plants leaves response to manganese deficiency and toxicity reveal key metabolites and their pathways in manganese tolerance

Affiliations

Metabolomics and physio-chemical analyses of mulberry plants leaves response to manganese deficiency and toxicity reveal key metabolites and their pathways in manganese tolerance

Jianbin Li et al. Front Plant Sci. .

Abstract

Introduction: Manganese (Mn) plays a pivotal role in plant growth and development. Aside aiding in plant growth and development, Mn as heavy metal (HM) can be toxic in soil when applied in excess. Morus alba is an economically significant plant, capable of adapting to a range of environmental conditions and possessing the potential for phytoremediation of contaminated soil by HMs. The mechanism by which M. alba tolerates Mn stresses remains obscure.

Methods: In this study, Mn concentrations comprising sufficiency (0.15 mM), higher regimes (1.5 mM and 3 mM), and deficiency (0 mM and 0.03 mM), were applied to M. alba in pot treatment for 21 days to understand M. alba Mn tolerance. Mn stress effects on the net photosynthetic rate (Pn), stomatal conductance (Gs), transpiration rate (Tr), intercellular CO2 concentration (Ci), chlorophyll content, plant morphological traits, enzymatic and non-enzymatic parameters were analyzed as well as metabolome signatures via non-targeted LC-MS technique.

Results: Mn deficiency and toxicity decrease plant biomass, Pn, Ci, Gs, Tr, and chlorophyll content. Mn stresses induced a decline in the activities of catalase (CAT) and superoxide dismutase (SOD), while peroxidase (POD) activity, and leaf Mn content, increased. Soluble sugars, soluble proteins, malondialdehyde (MDA) and proline exhibited an elevation in Mn deficiency and toxicity concentrations. Metabolomic analysis indicates that Mn concentrations induced 1031 differentially expressed metabolites (DEMs), particularly amino acids, lipids, carbohydrates, benzene and derivatives and secondary metabolites. The DEMs are significantly enriched in alpha-linolenic acid metabolism, biosynthesis of unsaturated fatty acids, galactose metabolism, pantothenate and CoA biosynthesis, pentose phosphate pathway, carbon metabolism, etc.

Discussion and conclusion: The upregulation of Galactinol, Myo-inositol, Jasmonic acid, L-aspartic acid, Coproporphyrin I, Trigonelline, Pantothenol, and Pantothenate and their significance in the metabolic pathways makes them Mn stress tolerance metabolites in M. alba. Our findings reveal the fundamental understanding of DEMs in M. alba's response to Mn nutrition and the metabolic mechanisms involved, which may hold potential significance for the advancement of M. alba genetic improvement initiatives and phytoremediation programs.

Keywords: LC-MS; Manganese stress; enzymatic activities; metabolic pathways; metabolomics; mulberry; physio-chemical; plant biomass.


Conflict of interest statement

The authors declare that the research was conducted in the absence of any commercial or financial relationships that could be construed as a potential conflict of interest.

Figures

Figure 1
Figure 1
Morphological and determination of photosynthetic parameters of M. alba Yu-711 under different concentrations of Mn (MnSO4) treatment. (A) fresh leaf and dry leaf weight. (B) root length. (C) manganese content in leaves and root. (D) net photosynthetic rate (Pn). (E) transpiration rate (Tr). (F) stomatal conductance (Gs). (G) intercellular CO2 concentration (Ci). (H) Chlorophyll content. (I) Chlorophyll ratio. Values are means of three replicates of leaf samples. Different letters above the bar represent significant differences (Tukey’s HSD, p < 0.05). T0: 0 mM; T1: 0.03 mM; CK: 0.15 mM; T2: 1.5 mM; T3: 3 mM of MnSO4.
Figure 2
Figure 2
Pearson correlation heatmap for morphological, physiological, and biochemical parameters in M. alba (Yu-711) grown in a pot (40 cm) experiment for 21 days under different levels of MnSO4 treatments. The numbers in the circle represent the Pearson correlation coefficient. The red color indicates a positive correlation (positive value), and the blue color represents a negative correlation (negative value). From -1 to 1 represent the correlation (r) coefficient value. R= 0.5 or more is significant value either positive or negatively correlated.
Figure 3
Figure 3
Stomatal conductance (Stomatal opening) of M. alba Yu-711 leaves under different concentrations of Mn treatment. T0: 0 mM MnSO4 treatment; T1: 0.03 mM MnSO4 treatment; CK: 0.15 mM MnSO4 treatment; T2: 1.5 mM MnSO4 treatment; T3: 3 mM MnSO4 treatment.
Figure 4
Figure 4
Physiological and biochemical indicators of M. alba Yu-711 under different concentrations of Mn (MnSO4) treatment. (A) CAT and SOD and activity. (B) POD activity. (C) PRO content. (D) MDA content. (E) soluble protein and soluble sugar content. Values are means of three replicates of leaf samples. Different letters above the bar represent significant differences (Tukey’s HSD, p < 0.05).
Figure 5
Figure 5
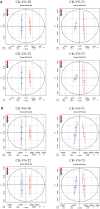
Orthogonal partial least-squares-discriminant analysis (OPLS-DA). (A) OPLS-DA score plot in POS ion mode. (B) OPLS-DA score plot in NEG ion mode. T0: 0 mM MnSO4 treatment; T1: 0.03 mM MnSO4 treatment; CK: 0.15 mM MnSO4 treatment; T2: 1.5 mM MnSO4 treatment; T3:3 mM MnSO4 treatment.
Figure 6
Figure 6
Statistics of the differential metabolites (DEMs) from group comparison. (A) number of differential metabolites from the POS ion mode (B) number of differential metabolites from the NEG ion mode. (C) DEMs distribution comparison in treatment groups. (D–G) DEMs classification in T0: 0 mM MnSO4 treatment; T1: 0.03 mM MnSO4 treatment; T2: 1.5 mM MnSO4 treatment; T3: 3 mM MnSO4 treatment, respectively. N = number of each metabolite in each class. The Red and blue color in the bar plot indicates upregulated and downregulated metabolites from group comparison.
Figure 7
Figure 7
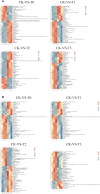
Hierarchical clustering analysis of differential metabolites. (A) pattern heat map of differential metabolites in POS ion mode. (B) pattern heat map of differential metabolites in NEG ion mode. The red color indicates high concentration, and the blue color indicates low concentration. T0: 0 mM MnSO4 treatment; T1: 0.03 mM MnSO4 treatment; CK: 0.15 mM MnSO4 treatment; T2:1.5 mM MnSO4 treatment; T3: 3 mM MnSO4 treatment.
Figure 8
Figure 8
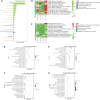
KEGG pathway enrichment analysis of the differential metabolites. (A) Statistical chart of metabolite KEGG annotations. The x-axis indicates the number of metabolites. (B) Significant enrichment pathways in each group comparison. (C) Pathway based on enrichment factor. Different colors represent classes of pathway. (D–G) Bubble plot showing the 20 KEGG pathways in T0: 0 mM; T1: 0.03 mM; CK:0.15 mM; T2: 1.5 mM; T3:3 mM of MnSO4 respectively. Bubble size indicates the number of metabolites. The bubble color from blue to red indicates an increase in significance (q-value).
Figure 9
Figure 9
Molecular mechanisms of M. alba Mn deficiency and toxicity stress based on significant (p ≤ 0.05) KEGG pathways. Metabolites in red and blue colors are up- and down-regulated DEMs, respectively.

Similar articles

Cited by

References

    1. Ackah M., Shi Y., Wu M., Wang L., Guo P., Guo L., et al. . (2021). Metabolomics response to drought stress in Morus alba L. variety Yu-711. Plants 10, 1636. doi: 10.3390/plants10081636 - DOI - PMC - PubMed
    1. Arora A., Sairam R., Srivastava G. (2002). Oxidative stress and antioxidative system in plants. Curr. Sci. 82 (10), 1227–1238.
    1. Ashraf M. A., Iqbal M., Rasheed R., Hussain I., Riaz M., Arif M. S. (2018). Environmental stress and secondary metabolites in plants: an overview. Plant Metabolites Regul. Under Environ. Stress, 153–167. doi: 10.1016/B978-0-12-812689-9.00008-X - DOI
    1. Bai Y., Zhou Y., Gong J. (2021). Physiological mechanisms of the tolerance response to manganese stress exhibited by Pinus massoniana, a candidate plant for the phytoremediation of Mn-contaminated soil. Environ. Sci. pollut. Res. 28, 45422–45433. doi: 10.1007/s11356-021-13912-8 - DOI - PubMed
    1. Benstein R. M., Ludewig K., Wulfert S., Wittek S., Gigolashvili T., Frerigmann H., et al. . (2013). Arabidopsis phosphoglycerate dehydrogenase1 of the phosphoserine pathway is essential for development and required for ammonium assimilation and tryptophan biosynthesis. Plant Cell. 25, 5011–5029. doi: 10.1105/tpc.113.118992 - DOI - PMC - PubMed