. 2024 Jun 24;9(12):e174153.
doi: 10.1172/jci.insight.174153.

Preanalytical considerations in quantifying circulating miRNAs that predict end-stage kidney disease in diabetes

Affiliations

Preanalytical considerations in quantifying circulating miRNAs that predict end-stage kidney disease in diabetes

Eiichiro Satake et al. JCI Insight. .

Abstract

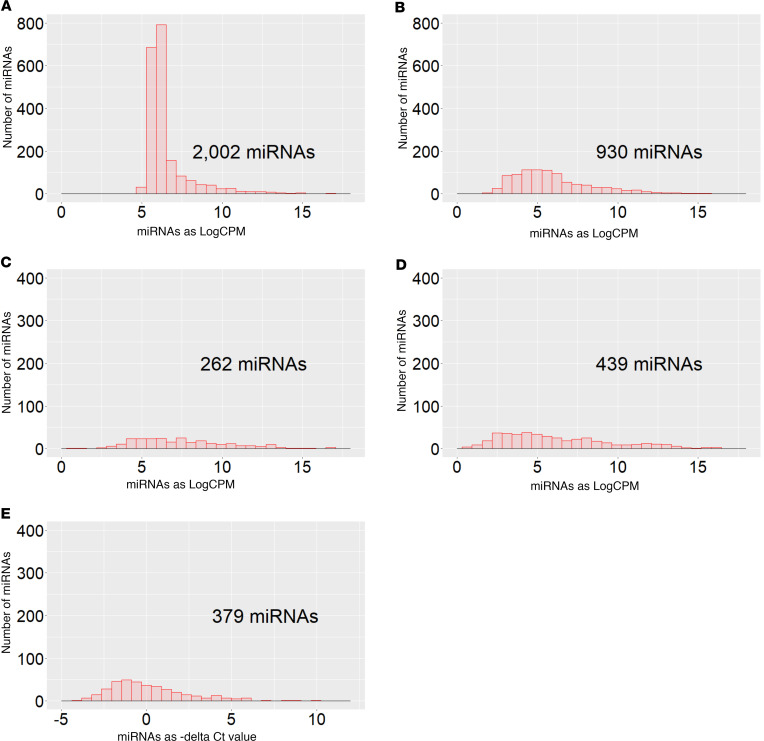
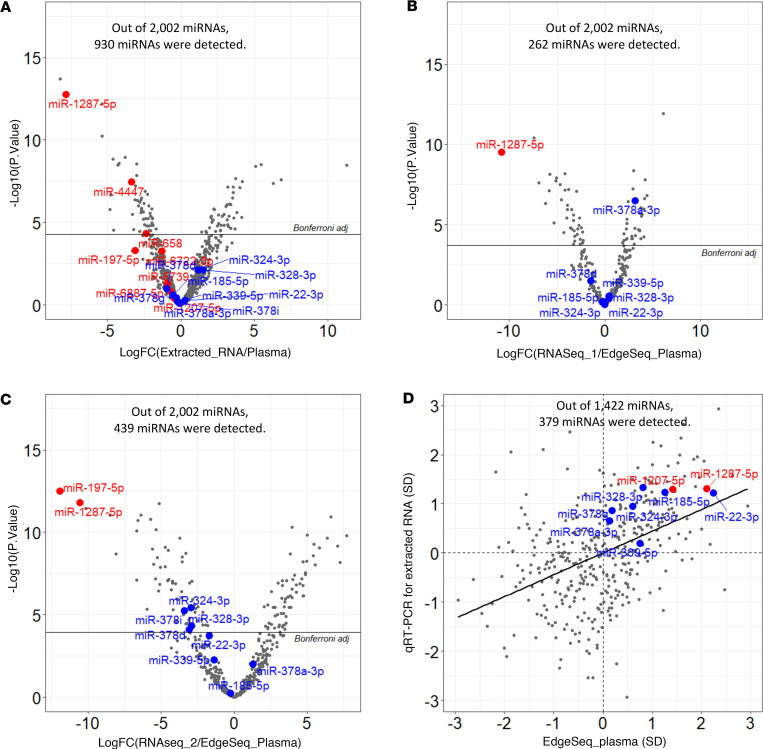
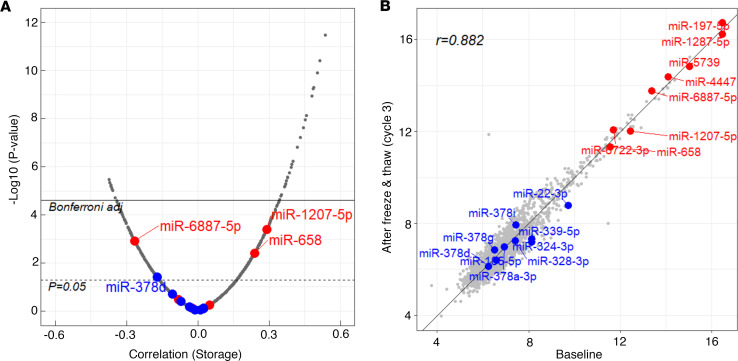
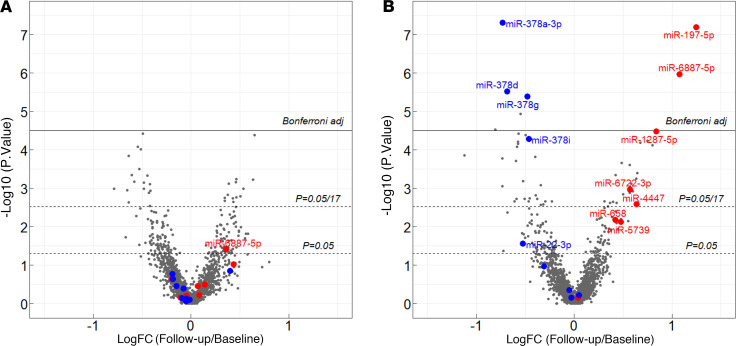
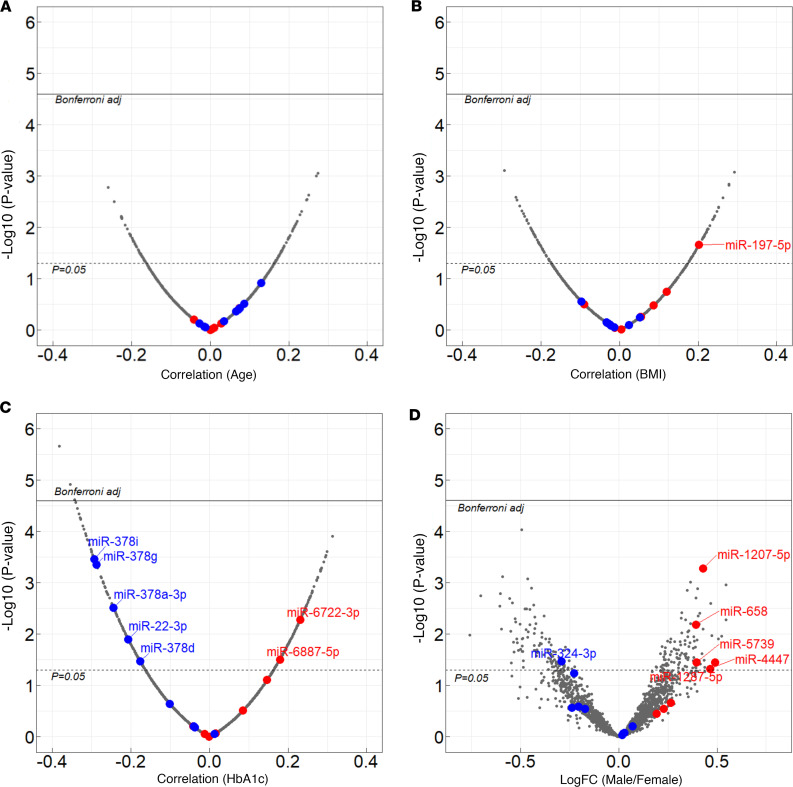
Our previous study identified 8 risk and 9 protective plasma miRNAs associated with progression to end-stage kidney disease (ESKD) in diabetes. This study aimed to elucidate preanalytical factors that influence the quantification of circulating miRNAs. Using the EdgeSeq platform, which quantifies 2,002 miRNAs in plasma, including ESKD-associated miRNAs, we compared miRNA profiles in whole plasma versus miRNA profiles in RNA extracted from the same plasma specimens. Less than half of the miRNAs were detected in standard RNA extraction from plasma. Detection of individual and concentrations of miRNAs were much lower when RNA extracted from plasma was quantified by RNA sequencing (RNA-Seq) or quantitative reverse transcription PCR (qRT-PCR) platforms compared with EdgeSeq. Plasma profiles of miRNAs determined by the EdgeSeq platform had excellent reproducibility in assessment and had no variation with age, sex, hemoglobin A1c, BMI, and cryostorage time. The risk ESKD-associated miRNAs were detected and measured accurately only in whole plasma and using the EdgeSeq platform. Protective ESKD-associated miRNAs were detected by all platforms except qRT-PCR; however, correlations among concentrations obtained with different platforms were weak or nonexistent. In conclusion, preanalytical factors have a profound effect on detection and quantification of circulating miRNAs in ESKD in diabetes. Quantification of miRNAs in whole plasma and using the EdgeSeq platform may be the preferable method to study profiles of circulating cell-free miRNAs associated with ESKD and possibly other diseases.

Keywords: Chronic kidney disease; Diabetes; Nephrology; Noncoding RNAs.


Conflict of interest statement

Conflict of interest: JMW and KLD are employees and stockholders of Eli Lilly and Company.

Figures

Figure 1
Figure 1. Distributions of number of detected cfmiRNAs according to raw read count of miRNAs in study panels, according to used platforms for quantification of cfmiRNAs.
(A) cfmiRNAs in plasma quantified by the HTG EdgeSeq platform. (B) cfmiRNAs in RNA extracted from plasma quantified by EdgeSeq. (C) cfmiRNAs in RNA extracted from plasma and quantified by RNASeq_1 (SeqMatic). (D) cfmiRNAs in RNA extracted from plasma and quantified by RNASeq_2 (LC Sciences). (E) miRNAs in RNA extracted from pooled plasma and quantified by qRT-PCR. The cfmiRNAs were considered detectable if they had concentrations of more than 1 CPM in more than 80% of the samples (7 or more samples out of 8) in EdgeSeq or in more than 50% of the samples in RNA-Seq or Ct values less than 30 in qRT-PCR.
Figure 2
Figure 2. Fold-changes of concentration of cfmiRNAs in extracted RNA from plasma over concentration of cfmiRNAs in whole plasma, according to different platforms used.
(A) RNA extracted from plasma over concentration of miRNAs in whole plasma measured by EdgeSeq, (B) miRNAs in RNA extracted from plasma measured by RNA-Seq (SeqMatic) over concentration of cfmiRNAs in whole plasma measured by EdgeSeq, and (C) cfmiRNAs in RNA extracted from plasma measured by RNA-Seq (LC Sciences) over concentration of cfmiRNAs in whole plasma measured by EdgeSeq analyzed using the voom, lmFit, and eBayes functions in the limma package. FC, fold-change. (D) Spearman correlation coefficients between concentration of cfmiRNAs in RNA extracted from plasma measured by qRT-PCR and concentration of miRNAs in whole plasma measured by EdgeSeq. Red dots indicate risk ESKD-associated cfmiRNAs. Blue dots indicate protective ESKD-associated miRNAs. Detailed comparisons are shown in Table 3.
Figure 3
Figure 3. Stability of miRNAs in plasma and duration of storage and freeze/thaw cycles.
(A) Volcano plot of Spearman correlation coefficients between miRNA concentrations in whole plasma and duration of plasma storage in individuals in panel 3 (N = 145). Red dots indicate risk ESKD-associated miRNAs, and blue dots indicate protective ESKD-associated miRNAs. The mean ± SD of storage duration (years) was 9.3 ± 2.3 years. (B) Comparison of plasma miRNA concentrations between baseline and after 3 cycles of freeze and thaw using Spearman correlation.
Figure 4
Figure 4. FCs of concentration of cfmiRNAs measured with EdgeSeq platform in whole plasma obtained at follow-up over concentration of miRNAs in whole plasma obtained at baseline, from individuals in panel 4 (N = 96).
(A) Results obtained for 52 T1D individuals who did not progress to ESKD during 7–15 years of follow-up. Median (25th % and 75th %) of duration between baseline and follow-up measurements was 3.7 (2.2, 5.3) years. (B) Results obtained for 44 T1D individuals who progressed to ESKD during 7–15 years of follow-up. Median (25th % and 75th %) of duration between baseline and follow-up measurements was 4.1 (2.5, 6.3) years. Red dots indicate risk miRNAs and blue dots indicate protective cfmiRNAs. A paired nonparametric analysis using the Wilcoxon rank sum test was used for comparison.
Figure 5
Figure 5. Relationship among demographic/clinical variables and concentration of cfmiRNAs in plasma measured with EdgeSeq platform in 145 T2D individuals in panel 3.
Red dots indicate risk ESKD-associated cfmiRNAs and blue dots indicate protective ESKD-associated miRNAs. (AC) Volcano plots for Spearman correlation coefficients between cfmiRNA concentrations in plasma and age, HbA1c (N = 145), and BMI (N = 128). (D) Volcano plots for FCs in plasma concentration of cfmiRNAs in men over plasma concentration of miRNAs in women. Data were analyzed using the voom, lmFit, and eBayes functions in the limma package.

References

    1. Mori MA, et al. Extracellular miRNAs: from biomarkers to mediators of physiology and disease. Cell Metab. 2019;30(4):656–673. doi: 10.1016/j.cmet.2019.07.011. - DOI - PMC - PubMed
    1. Kozomara A, et al. miRBase: from microRNA sequences to function. Nucleic Acids Res. 2019;47(d1):D155–D162. doi: 10.1093/nar/gky1141. - DOI - PMC - PubMed
    1. Bartel DP. Metazoan microRNAs. Cell. 2018;173(1):20–51. doi: 10.1016/j.cell.2018.03.006. - DOI - PMC - PubMed
    1. Filipowicz W, et al. Mechanisms of posttranscriptional regulation by microRNAs: are the answers in sight? Nat Rev Genet. 2008;9(2):102–114. doi: 10.1038/nrg2290. - DOI - PubMed
    1. Kim VN. MicroRNA biogenesis: coordinated cropping and dicing. Nat Rev Mol Cell Biol. 2005;6(5):376–385. doi: 10.1038/nrm1644. - DOI - PubMed

MeSH terms