. 2024 May 23;9(12):e178804.
doi: 10.1172/jci.insight.178804.

N-glycosylation by Mgat5 imposes a targetable constraint on immune-mediated tumor clearance

Affiliations

N-glycosylation by Mgat5 imposes a targetable constraint on immune-mediated tumor clearance

Erin E Hollander et al. JCI Insight. .

Abstract

The regulated glycosylation of the proteome has widespread effects on biological processes that cancer cells can exploit. Expression of N-acetylglucosaminyltransferase V (encoded by Mgat5 or GnT-V), which catalyzes the addition of β1,6-linked N-acetylglucosamine to form complex N-glycans, has been linked to tumor growth and metastasis across tumor types. Using a panel of murine pancreatic ductal adenocarcinoma (PDAC) clonal cell lines that recapitulate the immune heterogeneity of PDAC, we found that Mgat5 is required for tumor growth in vivo but not in vitro. Loss of Mgat5 results in tumor clearance that is dependent on T cells and dendritic cells, with NK cells playing an early role. Analysis of extrinsic cell death pathways revealed Mgat5-deficient cells have increased sensitivity to cell death mediated by the TNF superfamily, a property that was shared with other non-PDAC Mgat5-deficient cell lines. Finally, Mgat5 knockout in an immunotherapy-resistant PDAC line significantly decreased tumor growth and increased survival upon immune checkpoint blockade. These findings demonstrate a role for N-glycosylation in regulating the sensitivity of cancer cells to T cell killing through classical cell death pathways.

Keywords: Apoptosis; Cell biology; Glycobiology; Oncology; T cells.


Conflict of interest statement

Conflict of interest: The authors have declared that no conflict of interest exists.

Figures

Figure 1
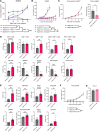
Figure 1. Mgat5 loss sensitizes cancer cells to immune clearance.
(A) Mgat5 expression in human pancreatic cancer (left, n = 179) and normal pancreas (right, n = 171) from GEPIA2. In the box-and-whisker plot, the lower and upper bounds of the box represent the 25th and 75th percentiles of the data, respectively, with the line within the box set at the median. Whiskers are set at the lowest and greatest values in the data set, excluding the outliers plotted beyond the whiskers. (B) Histogram of PHA-L binding to 2838c3 EV and Mgat5-KO cell lines. (C) Relative growth of T cell–inflamed (2838c3) EV and Mgat5-KO cell lines in vitro. Statistical analysis done using 2-way ANOVA with n = 3 replicates per data point. (D) Growth (mm3) of 2838c3 EV (n = 6), Mgat5-KO-A (n = 7), and Mgat5-KO-B (n = 7) subcutaneous tumors in C57BL/6 mice over time. Statistical analysis done using 2-way ANOVA for this and all following tumor growth curves. Data representative of 2 independent experiments. (E) Tumor weights in T cell–inflamed (2838c3) WT (n = 4) and Mgat5-KO-A (n = 4) cells implanted orthotopically into mouse pancreas. Data represent mean ± SEM. Statistical analysis using unpaired, 2-tailed Student’s t test. (F) Quantification of immunofluorescent staining for PHA-L, CD8+ T cells, granzyme B (GZMB), FOXP3, aSMA, and cleaved caspase 3 (CC3) by percentage area per high-power field (HPF) using ImageJ. Three mice per condition (EV, KO) with 3–5 HPF per tumor. Statistics using unpaired, 2-tailed Student’s t test. (G) Growth (mm3) and weights (mg) of 2838c3 EV (n = 8) and Mgat5-KO-A (n = 10) subcutaneous tumors in NOD/SCID mice. Data represent mean ± SEM. (H) Growth (mm3, left) of 6694c2 EV (n = 8), Mgat5-KO-A (n = 10), and Mgat5-KO-B (n = 10) subcutaneous tumors in C57BL/6 mice. Data represent mean ± SEM. (I) Subcutaneous tumor growth over time of 6419c5 EV (n = 6) and Mgat5-KO (n = 6) tumors in C57BL/6 mice. Data representative of 2 independent experiments. Data represent mean ± SEM. *P < 0.05; **P < 0.01; ***P < 0.001; ****P < 0.0001.
Figure 2
Figure 2. Mgat5 glycans help cancer cells evade clearance by T cells in a cell-autonomous manner.
(A) Tumor volumes (mm3) over time of 2838c3 EV (n = 5) and Mgat5-KO-A subcutaneous tumors in the setting of either NK cell depletion (n = 10), CD4+/CD8+ T cell depletion (n = 10), or isotype control (n = 5). Data represent mean ± SEM. Statistical analysis done using 2-way ANOVA for this and all further tumor growth curves. (B) Growth (mm3) of 2838c3 EV and Mgat5-KO-A subcutaneous tumors in the setting of either CD4+ T cell depletion, CD8+ T cell depletion, or isotype control (n = 5 mice/group). Statistical analysis done on day 19. (C) Growth (mm3, left) and weights (right) of 2838c3 EV (n = 5) and Mgat5-KO-A (n = 6) subcutaneous tumors in Batf3–/– mice. Statistical analysis done using unpaired, 2-tailed Student t test for tumor weights. Data representative of 2 independent experiments. (D) Flow cytometric analysis of the indicated immune cell subsets in 2838c3 EV (n = 6) and Mgat5-KO-A tumors (n = 8) harvested on day 12 after subcutaneous injection. Data represent mean ± SEM. Statistical analysis using unpaired, 2-tailed Student’s t test. Data representative of 2 independent experiments. (E) Flow cytometric analysis of T cell cytotoxicity in draining lymph nodes (inguinal, axillary) from 2838c3 EV and Mgat5-KO subcutaneous flank tumor. Data represent mean ± SEM. Statistical analysis using unpaired, 2-tailed Student’s t test. Data representative of 2 independent experiments. (F) Growth (mm3) tumors following the injection of 2838c3 WT cells (n = 6), Mgat5-KO-A cells (n = 4), or a 1:1 mix of WT and KO cells (n = 7). (G) PHA-L staining by flow cytometry of the WT and 1:1 mixed WT + KO tumors. Statistical analysis done using unpaired, 2-tailed Student’s t test. *P < 0.05; **P < 0.01; ***P < 0.001; ****P < 0.0001.
Figure 3
Figure 3. Mgat5 loss increases the immunogenicity of existing tumor antigens.
(A) Vβ repertoire analysis of CD4+ and CD8+ T cells in the spleens of naive mice (n = 5, combined from 2 independent experiments), mice bearing 2838c3 WT tumors (n = 3), or mice that had cleared Mgat5-KO-A tumors (n = 5). Data represent mean ± SEM. Statistical analysis by 2-way ANOVA for this and all further tumor growth curves. (B) Growth (mm3) of subcutaneous tumors arising from 2838c3 WT cells injected into either naive mice or mice previously immunized (4 weeks earlier) with 2838c3 Mgat5-KO-A cells (n = 6 mice/group). Data represent mean ± SEM. (C) Growth (mm3, left) and weights (right) of 6694c2 WT cells subcutaneous injected into either naive mice or mice previously immunized (4 weeks earlier) with 2838c3 Mgat5-KO-A cells (n = 6 mice/group). Data represent mean ± SEM. Statistical analysis by unpaired, 2-tailed Student t test for tumor weights. (D) Growth (mm3) of 2838c3 WT cells subcutaneously injected into naive mice, mice previously immunized with irradiated, dead 2838c3 EV cells (dEV immunization), or mice previously immunized with dead 2838c3 KO-A cells (dKO immunization) (n = 7 mice/group). Data represent mean ± SEM. (E) Vβ repertoire analysis of CD4+ and CD8+ T cells in the spleens of naive mice (n = 5, from A), immunized mice challenged with 2838c3 WT tumor cells day 3 after subcutaneous injection (n = 3), or immunized mice challenged with 2838c3 WT tumor cells on day 10 after subcutaneous injection (n = 3). Data represent mean ± SEM. Statistical analysis by 2-way ANOVA. *P < 0.05; **P < 0.01; ***P < 0.001; ****P < 0.0001.
Figure 4
Figure 4. Mgat5 glycans impede cell killing via extrinsic cell death pathways.
(A) Viability of 2838c3 EV and Mgat5-KO cells in vitro following exposure to varying concentrations of TNF-α, TRAIL, or Fas ligand (FasL). Statistics from 2 μg/mL TNF-α, 16 ng/mL TRAIL, and 0.4 μg/mL FasL. Analysis using 2-way ANOVA for this and all further cell death figures at specified concentrations. (B) Viability of 6694c2 EV and Mgat5-KO cells in vitro following exposure to varying concentrations of TNF-α. Statistics from 400 ng/mL TNF-α. (C) Viability of 6499c4 EV and Mgat5-KO cells in vitro following exposure to varying concentrations of TNF-α or TRAIL. Statistics from 2 μg/mL TNF-α and 80 ng/mL TRAIL. (D) Viability of 6419c5 EV and Mgat5-KO cells in vitro following exposure to varying concentrations of TNF-α or TRAIL. Statistics from 2 μg/mL TNF-α and 500 ng/mL TRAIL. All previous data representative of at least 2 independent experiments. (E) Viability of 2838c3 EV and Mgat5-KO-A cells in vitro following exposure to varying concentrations of TNF-α with or without the pan-caspase inhibitor z-VAD (left) or the necroptosis inhibitor necrostatin-1 (right). Statistics from 16 ng/mL TNF-α. (F) Viability of 6499c4 EV and Mgat5-KO-A cells in vitro following exposure to varying concentrations of TRAIL with or without the pan-caspase inhibitor z-VAD (left) or the necroptosis inhibitor necrostatin-1 (right). Statistics from 10 ng/mL TRAIL. *P < 0.05; ****P < 0.0001.
Figure 5
Figure 5. Mgat5 glycans protect some non–pancreatic cancer cells against TNF-α–mediated cell death.
(A) Histogram of PHA-L binding, in vitro growth, in vitro cell death assays using TNF-α, and subcutaneous tumor growth of Hep55 EV and Mgat5-KO cells in C57BL/6 mice. For in vitro growth assays, statistical analysis done using 2-way ANOVA with n = 3 replicates per data point for this and all further in vitro growth assays. In vivo growth representative of 2 independent experiments. Analysis for TNF-α death assay done using 2-way ANOVA at 400 ng/mL for this and all further TNF-α death assays at the specified concentration, and representative of 2 independent experiments. Analysis for tumor growth using 2-way ANOVA for this and all further tumor growth curves. Data represent mean ± SEM. (B) Histogram of PHA-L binding, in vitro growth, in vitro cell death assays using TNF-α, and subcutaneous tumor growth of LLC EV and Mgat5-KO cells in C57BL/6 mice. Statistics for TNF-α death assay done at 3.2 ng/mL. (C) Histogram of PHA-L binding, in vitro growth, in vitro cell death assays using TNF-α, and subcutaneous tumor growth of MC38 EV and Mgat5-KO cells in C57BL/6 mice. For in vitro growth assay, n = 6 replicates per data point. Statistics for TNF-α death assay done at 3.2 ng/mL. (D) Histogram of PHA-L binding, in vitro growth, in vitro cell death assays using TNF-α, and subcutaneous tumor growth of B16-F10 EV and Mgat5-KO cells in C57BL/6 mice. Statistics for TNF-α death assay done at 80 ng/mL. *P < 0.05; **P < 0.01; ***P < 0.001; ****P < 0.0001.
Figure 6
Figure 6. Mgat5 loss augments the antitumor effects immune checkpoint blockade (ICB).
(A) Schematic illustrating the ICB experimental design. (B) Growth of 6694c2 EV under isotype control (n = 9), EV treated with ICB (n = 8), Mgat5-KO under isotype control (n = 8), and Mgat5-KO treated with ICB (n = 9). Spaghetti plots showing the growth of individual tumors are presented on the right. Data represent mean ± SEM. Statistical analysis by 2-way ANOVA at day 9. Not shown is significance (****) of EV + isotype ctrl and KO + ICB groups. EV + isotype ctrl and EV + ICB groups are not significantly different (P = 0.4095). (C) Survival of mice from the experiment in B. Statistical analysis by log-rank (Mantel-Cox) test. (D) Microscopic evaluation of immunofluorescent PHA-L binding in 2838c3 WT tumors treated with 1 or 2 weeks of 0 mg/kg, 1 mg/kg, or 4 mg/kg swainsonine. Quantification of immunofluorescent staining for PHA-L using ImageJ. Two mice per condition per week (EV, KO) with with 3–5 HPF per tumor. Statistical analysis done using unpaired, 2-tailed Student’s t test. (E) Growth of 2838c3 WT subcutaneous tumors in mice treated with 0 mg/kg (n = 5), 1 mg/kg (n = 4), or 4 mg/kg (n = 5) of swainsonine administered once daily i.p. for 7 days. Mice with tumors sized 20–60mm3 were enrolled in treatment. Data represent mean ± SEM. Statistical analysis by 2-way ANOVA at day 14. *P < 0.05; **P < 0.01; ****P < 0.0001.

References

    1. Gagneux P, Hennet T, Varki A. Biological Functions of Glycans. In: Varki A, Cummings RD, Esko JD, et al., editors. Essentials of Glycobiology [Internet]. 4th edition. Cold Spring Harbor (NY): Cold Spring Harbor Laboratory Press; 2022. Chapter 7. Available from: https://www.ncbi.nlm.nih.gov/books/NBK579984/
    1. Schjoldager KT, et al. Global view of human protein glycosylation pathways and functions. Nat Rev Mol Cell Biol. 2020;21(12):729–749. doi: 10.1038/s41580-020-00294-x. - DOI - PubMed
    1. Gu J, Taniguchi N. Potential of N-glycan in cell adhesion and migration as either a positive or negative regulator. Cell Adh Migr. 2008;2(4):243–245. doi: 10.4161/cam.2.4.6748. - DOI - PMC - PubMed
    1. Pucci M, et al. Glycobiology of the epithelial to mesenchymal transition. Biomedicines. 2021;9(7):770. doi: 10.3390/biomedicines9070770. - DOI - PMC - PubMed
    1. Pereira MS, et al. Glycans as key checkpoints of T cell activity and function. Front Immunol. 2018;9:2754. doi: 10.3389/fimmu.2018.02754. - DOI - PMC - PubMed

MeSH terms

Substances