. 2024 Jun 24;9(12):e178650.
doi: 10.1172/jci.insight.178650.

Loss of microRNA-15a/16-1 function promotes neuropathological and functional recovery in experimental traumatic brain injury

Affiliations

Loss of microRNA-15a/16-1 function promotes neuropathological and functional recovery in experimental traumatic brain injury

Chao Zhou et al. JCI Insight. .

Abstract

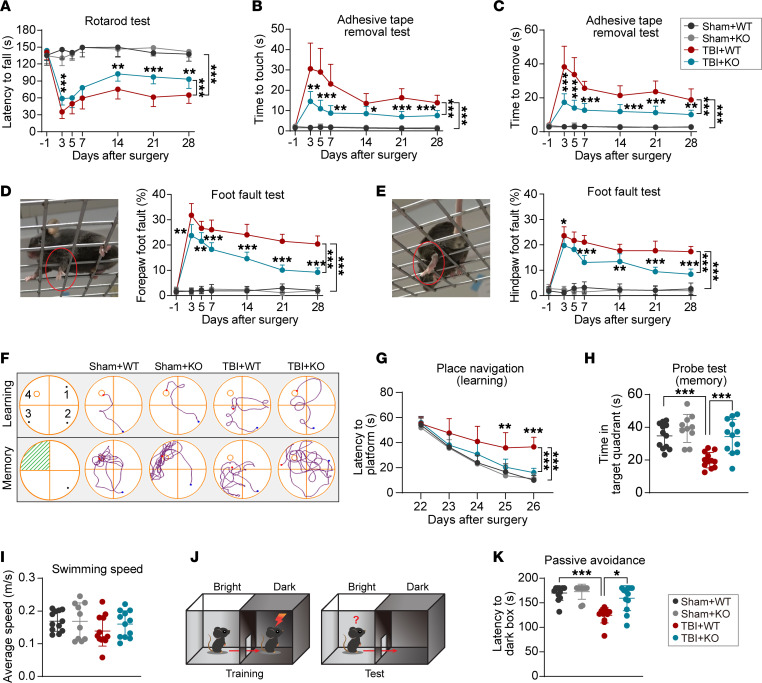
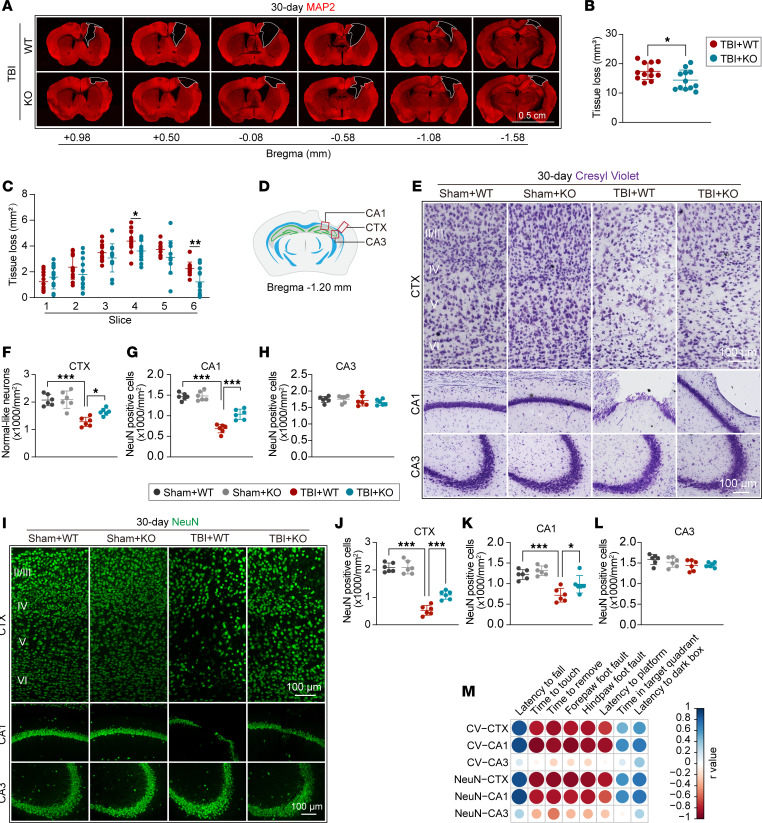
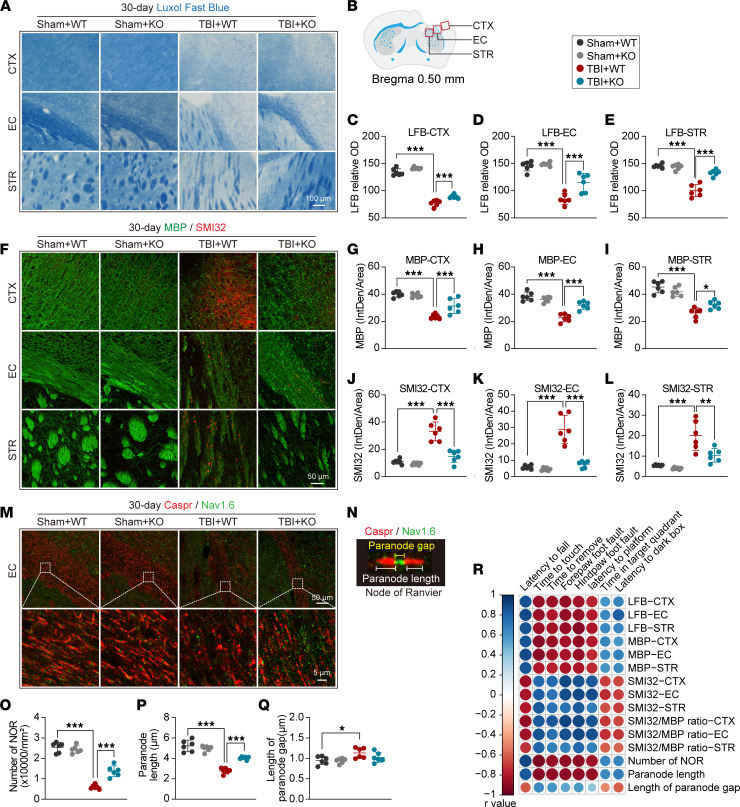
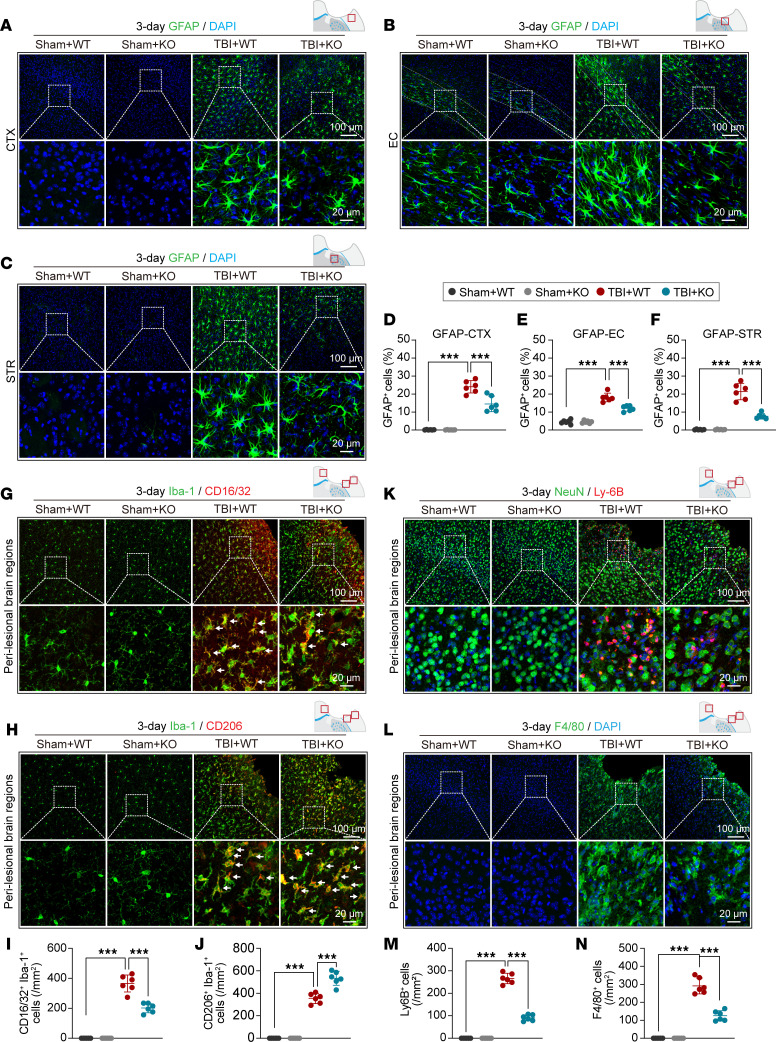
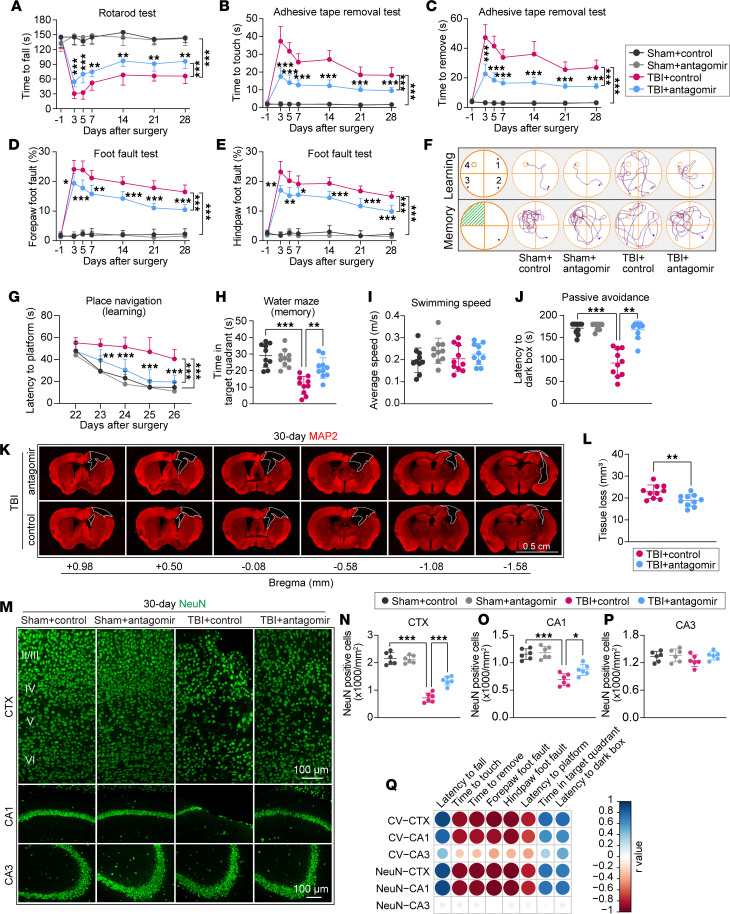
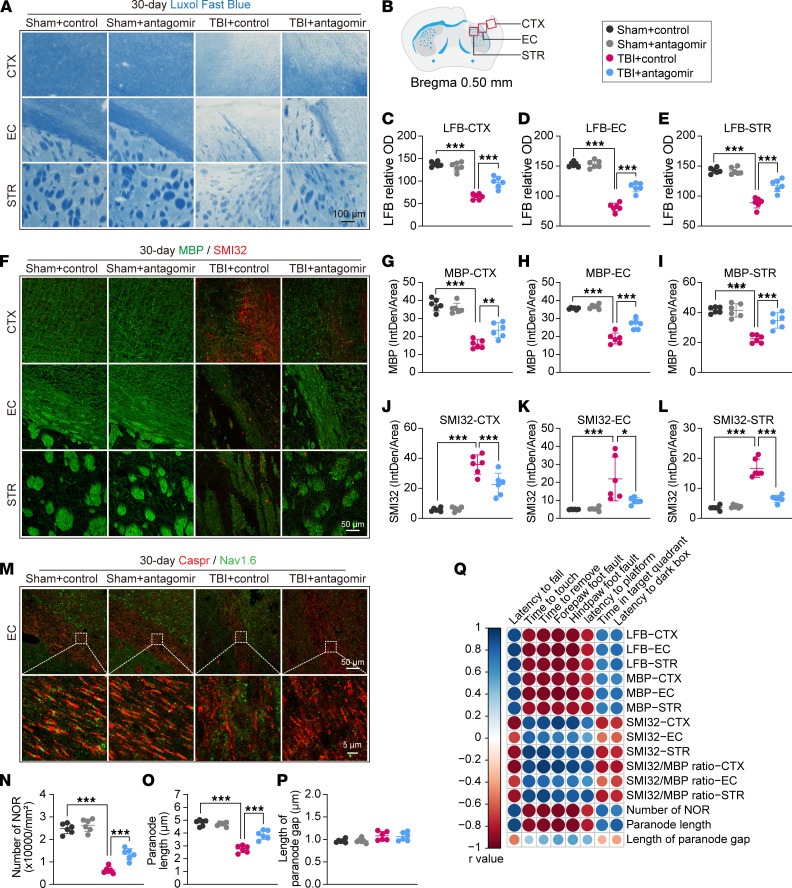
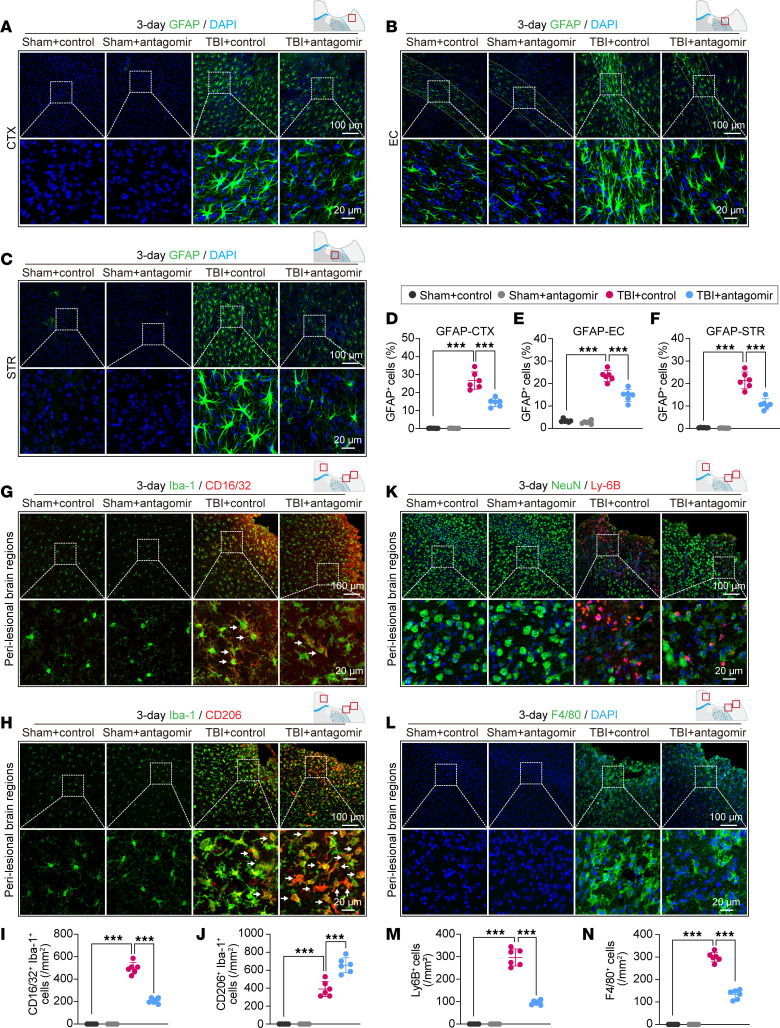
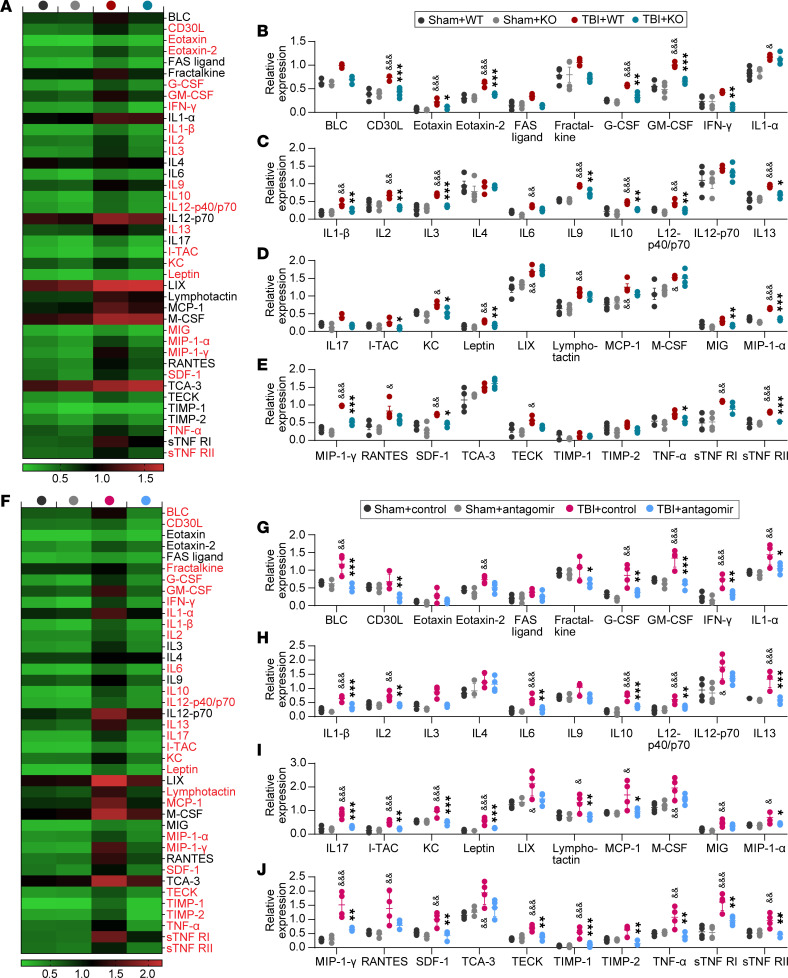
The diffuse axonal damage in white matter and neuronal loss, along with excessive neuroinflammation, hinder long-term functional recovery after traumatic brain injury (TBI). MicroRNAs (miRs) are small noncoding RNAs that negatively regulate protein-coding target genes in a posttranscriptional manner. Recent studies have shown that loss of function of the miR-15a/16-1 cluster reduced neurovascular damage and improved functional recovery in ischemic stroke and vascular dementia. However, the role of the miR-15a/16-1 cluster in neurotrauma is poorly explored. Here, we report that genetic deletion of the miR-15a/16-1 cluster facilitated the recovery of sensorimotor and cognitive functions, alleviated white matter/gray matter lesions, reduced cerebral glial cell activation, and inhibited infiltration of peripheral blood immune cells to brain parenchyma in a murine model of TBI when compared with WT controls. Moreover, intranasal delivery of the miR-15a/16-1 antagomir provided similar brain-protective effects conferred by genetic deletion of the miR-15a/16-1 cluster after experimental TBI, as evidenced by showing improved sensorimotor and cognitive outcomes, better white/gray matter integrity, and less inflammatory responses than the control antagomir-treated mice after brain trauma. miR-15a/16-1 genetic deficiency and miR-15a/16-1 antagomir also significantly suppressed inflammatory mediators in posttrauma brains. These results suggest miR-15a/16-1 as a potential therapeutic target for TBI.

Keywords: Behavior; Demyelinating disorders; Drug therapy; Inflammation; Therapeutics.


Conflict of interest statement

Conflict of interest: The authors have declared that no conflict of interest exists.

Figures

Figure 1
Figure 1. Genetic deletion of the miR-15a/16-1 cluster partially preserves sensorimotor and cognitive functions in mice after TBI.
Experimental TBI was induced in miR-15a/16-1–KO and WT mice by unilateral controlled cortical impact, followed by a 30 days survival period. Long-term sensorimotor function was evaluated in TBI mice and sham controls at the indicated time points (–1, 3, 5, 7, 14, 21, and 28 days after operation). (A) Time to fall in the rotarod test. (B and C) The time to touch and time to remove the tape in the adhesive tape–removal test. (D and E) Representative forepaw/hindpaw foot-fault images and the forepaw/hindpaw foot-fault rate in the foot-fault test (red circle: foot fault). Long-term cognitive function was examined in TBI mice and sham controls by the Morris water maze (MWM) test (22–27 days) and the passive avoidance test (29–30 days). (F) Representative swimming track plots. (G) Latency to find platform in the learning phase. (H) Time spent in the target quadrant in the memory phase. (I) Average swimming speed in MWM test. (J) Graphic schedule of the passive avoidance test. (K) Latency to enter the dark box. Data are presented as mean ± SD, n = 10–12/group. Statistical analyses were performed by 1-way/2-way ANOVA and Tukey’s post hoc test. *P < 0.05, **P < 0.01, and ***P < 0.001 versus TBI + WT group.
Figure 2
Figure 2. Genetic deficiency of the miR-15a/16–1 cluster reduces brain tissue loss and neuronal death in mice after TBI.
MAP2 immunostaining was conducted in miR-15a/16-1–KO and WT mice 30 days after TBI to measure brain tissue loss. (A) Representative images of MAP2 immunostaining. Scale bar: 0.5 cm. (B and C) Quantitative analysis of volume or cross-sectional areas in brain tissue loss. Neuronal loss was examined by CV histological staining and NeuN immunofluorescence staining 30 days after TBI. (D) Coordinates and perilesional brain regions for CV and NeuN staining. (E) Representative images of CV staining in the pericontusional CTX, CA1, and CA3 regions. Scale bars: 100 μm. (FH) Quantitative analysis of CV-stained cells in the pericontusional CTX, CA1, and CA3 regions. (I) Representative images of NeuN immunostaining in the pericontusional CTX, CA1, and CA3 regions. (JL) Quantitative analysis of NeuN-immunopositive cells in the pericontusional CTX, CA1, and CA3 regions. Data are presented as mean ± SD, n = 6/group. Statistical analyses were performed by 1-way ANOVA and Tukey’s post hoc test. *P < 0.05, **P < 0.01, and ***P < 0.001 versus TBI + WT group. (M) Correlation analysis between sensorimotor or cognitive outcomes and CV-stained/NeuN+ neurons in the pericontusional CTX, CA1, and CA3 regions (n = 6/group, Pearson correlation analysis).
Figure 3
Figure 3. miR-15a/16–1 genetic deletion partially preserves long-term white matter integrity in mice after TBI.
Luxol fast blue (LFB) histological staining and MBP (green)/SMI32 (red) double-immunofluorescence staining were used to evaluate white matter integrity in miR-15a/16-1–KO and WT mice 30 days after TBI. (A) Representative images of LFB staining in the pericontusional CTX, EC, and STR regions. Scale bars: 100 μm. (B) Coordinates and brain regions for LFB, MBP/SMI32, and Caspr/Nav1.6 staining. (CE) Quantitative analysis of relative OD values from LFB staining in the pericontusional CTX, EC, and STR regions. (F) Representative images of MBP/SMI32 immunostaining in the pericontusional CTX, EC, and STR regions. Scale bar: 50 μm. (GI) Quantitative analysis of MBP fluorescence intensity in the pericontusional CTX, EC, and STR regions. (JL) Quantitative analysis of SMI32 fluorescence intensity in the pericontusional CTX, EC, and STR regions. (M) The node of Ranvier (NOR) was examined by Caspr (red)/Nav1.6 (green) double-immunofluorescence staining. Representative images of Caspr/Nav1.6 immunostaining in the pericontusional EC area. Scale bars: 50 μm (top), 5 μm (bottom). (N) A representative image showing the composition and normal structure of the NOR. (OP) Quantitative analysis of the number of NOR (O), paranode length (P), and the length of the paranode gap (Q). Data are presented as mean ± SD, n = 6/group. Statistical analyses were performed by 1-way ANOVA and Tukey’s post hoc test. *P < 0.05, **P < 0.01, and ***P < 0.001 versus TBI + WT group. (R) Correlation analysis of sensorimotor or cognitive outcome and white matter integrity (n = 6/group, Pearson correlation analysis).
Figure 4
Figure 4. miR-15a/16–1 genetic deletion alleviates TBI-induced glial activation and infiltration of peripheral immune cells in mouse brains.
Experimental TBI was induced in miR-15a/16-1–KO and WT mice, and then astrocytic activation and microglial polarization were examined in brain sections at 3 days after surgery. (AC) Representative images of GFAP (green, an astrocyte marker)/DAPI (blue) immunofluorescence staining in the perilesional CTX, EC, and STR regions. (DF) Quantitative analysis of GFAP+ cells in the perilesional CTX, EC, and STR areas. (G and H) Representative images of Iba-1 (green)/CD16/32 (red) and Iba-1 (green)/CD206 (red) double-immunofluorescence staining in the perilesional brain regions. (I and J) Quantitative analysis of Iba-1+CD16/32+ and Iba-1+CD206+ cells. The infiltration of peripheral neutrophils and macrophages was examined in perilesional brain regions. (K and L) Representative images of NeuN (green)/Ly-6B (red) and F4/80 (green)/DAPI (blue) immunostaining in the perilesional brain regions. (M and N) Quantitative analysis of Ly-6B+ neutrophils and F4/80+ macrophages in perilesional brain regions. Data are presented as mean ± SD, n = 6/group. Statistical analyses were performed by 1-way ANOVA and Tukey’s post hoc test. ***P < 0.001 versus TBI + WT group. Scale bars: 100 μm (top), 20 μm (bottom).
Figure 5
Figure 5. Long-term intranasal delivery of the miR-15a/16–1 antagomir promotes neurobehavioral recovery and reduces brain tissue loss and neuronal death in mice after TBI.
C57BL/6J mice were subjected to experimental TBI and intranasal treatment of the miR-15a/16-1 antagomir or control antagomir at 2 hours, 5 days, 10 days, 15 days, 20 days, and 25 days after CCI surgery. Sensorimotor function was examined in experimental mice at the indicated time points (–1, 3, 5, 7, 14, 21, and 28 days after surgery). (A) Time to fall in the rotarod test. (B and C) The time to touch and time to remove the tape in the adhesive tape–removal test. (D and E) The forepaw foot-fault rate and hindpaw foot-fault rate in the foot-fault test. Cognitive function was evaluated by the MWM test (22–27 days) and the passive avoidance test (29–30 days). (F) Representative swimming track plots. (G) Latency to find platform in the learning phase. (H) Time spent in the target quadrant in the memory phase. (I) Average swimming speed in the MWM test. (J) Latency to enter the dark box. Data are presented as mean ± SD, n = 10/group. Statistical analyses were performed by 1-way/2-way ANOVA and Tukey’s post hoc test. MAP2 and NeuN immunostaining were performed to examine brain tissue/neuronal loss. (K and L) Representative images of MAP2 immunostaining and quantitative analysis of brain tissue loss volume (n = 10/group, unpaired t test). (M) Representative images of NeuN immunostaining in the pericontusional CTX, CA1, and CA3 regions. Scale bar: 100 μm. (NP) Quantitative analysis of NeuN+ cells in the pericontusional CTX, CA1, and CA3 regions (n = 6/group, 1-way ANOVA & Tukey’s test). *P < 0.05 and ***P < 0.001 versus TBI + control antagomir group. (Q) Correlation analysis between sensorimotor or cognitive outcome and CV-stained or NeuN+ neurons in the pericontusional CTX, CA1, and CA3 regions (n = 6/group, Pearson correlation analysis).
Figure 6
Figure 6. Long-term intranasal delivery of the miR-15a/16–1 antagomir partially preserves white matter integrity in mice after TBI.
C57BL/6J mice were subjected to experimental TBI and intranasally treated with the miR-15a/16-1 antagomir or control antagomir at 2 hours, 5 days, 10 days, 15 days, 20 days, and 25 days after CCI surgery. White matter integrity was examined by LFB staining and MBP/SMI32 immunostaining 30 days after surgery. (A) Representative images of LFB staining in the perilesional CTX, EC, and STR regions. Scale bar: 100 μm. (B) Coordinates and brain regions for LFB, MBP/SMI32, and Caspr/Nav1.6 staining. (CE) Quantitative analysis of relative OD values from LFB staining in the pericontusional CTX, EC, and STR regions. (F) Representative images of MBP/SMI32 immunostaining in the pericontusional CTX, EC, and STR regions. Scale bar: 50 μm. (GI) Quantitative analysis of MBP fluorescence intensity in the pericontusional CTX, EC, and STR regions. (JL) Quantitative analysis of SMI32 fluorescence intensity in the pericontusional CTX, EC, and STR regions. (M) The node of Ranvier (NOR) was examined by Caspr (red)/Nav1.6 (green) double-immunofluorescence staining. Representative images of Caspr/Nav1.6 immunostaining in the pericontusional EC area. Scale bars: 50 μm (top), 5 μm (bottom). (NP) Quantitative analysis of the number of NOR (N), paranode length (O), and the length of the paranode gap (P). Data are presented as mean ± SD, n = 6/group. Statistical analyses were performed by 1-way ANOVA and Tukey’s post hoc test. *P < 0.05, **P < 0.01, and ***P < 0.001 versus TBI + control antagomir group. (Q) Correlation analysis of sensorimotor or cognitive outcome and white matter integrity (n = 6/group, Pearson correlation analysis).
Figure 7
Figure 7. miR-15a/16–1 antagomir alleviates TBI-induced glial activation and infiltration of peripheral immune cells in mouse brains.
C57BL/6J mice were subjected to experimental TBI and intranasally treated with the miR-15a/16-1 antagomir or control antagomir at 2 hours after surgery. Astrocytic activation and microglial polarization were examined in brain sections at 3 days after CCI surgery. (AC) Representative images of GFAP (green, an astrocyte marker)/DAPI (blue) immunofluorescence staining in the perilesional CTX, EC, and STR regions. (DF) Quantitative analysis of GFAP+ cells in the perilesional CTX, EC, and STR areas. (G and H) Representative images of Iba-1 (green)/CD16/32 (red) and Iba-1 (green)/CD206 (red) double-immunofluorescence staining in the perilesional brain regions. (I and J) Quantitative analysis of Iba-1+CD16/32+ and Iba-1+CD206+ cells. (K and L) The infiltration of peripheral neutrophils and macrophages was examined in perilesional brain regions. Representative images of NeuN (green)/Ly-6B (red) and F4/80 (green)/DAPI (blue) immunostaining in perilesional brain regions. (M and N) Quantitative analysis of Ly-6B+ neutrophils and F4/80+ macrophages in perilesional brain regions. Data are presented as mean ± SD, n = 6/group. Statistical analyses were performed by 1-way ANOVA and Tukey’s post hoc test. ***P < 0.001 versus TBI + control antagomir group. Scale bars: 100 μm (top), 20 μm (bottom).
Figure 8
Figure 8. Genetic deletion and pharmacological inhibition of miR-15a/16–1 function reduces the inflammatory burden in posttrauma brains.
(AE) miR-15a/16-1–KO and WT mice were subjected to experimental TBI or sham operation. A panel of 40 inflammatory mediators was examined in mouse brains at 3 days after CCI surgery. (A) A heatmap showing the mean expression levels of 40 inflammatory mediators in posttrauma brains from experimental groups. (BE) Quantitative analysis of 40 brain inflammatory mediators in experimental groups. Data are presented as mean ± SD, n = 4/group. Statistical analyses were performed by 1-way ANOVA and Tukey’s test or Kruskal-Wallis test & Dunn’s test. &,*P < 0.05, &&,**P < 0.01, and &&&,***P < 0.001, where & represents TBI + WT versus Sham + WT group and * represents TBI + KO versus TBI + WT group. (FJ)C57BL/6J mice were subjected to experimental TBI and intranasally treated with the miR-15a/16–1 antagomir or control antagomir at 2 hours after surgery. A panel of 40 inflammatory mediators was measured in mouse brains at 3 days after CCI surgery. (F) A heatmap showing the mean expression levels of 40 inflammatory mediators in posttrauma brains from experimental groups. (GJ) Quantitative analysis of 40 brain inflammatory mediators in experimental groups. Data are presented as mean ± SD, n = 4/group. Statistical analyses were performed by 1-way ANOVA and Tukey’s test or Kruskal-Wallis test and Dunn’s test. &,*P < 0.05, &&,**P < 0.01, and &&&,***P < 0.001 where & represents TBI + control antagomir versus Sham + control antagomir group and * represents TBI + miR-15a/16-1 antagomir versus TBI + control antagomir group.

References

    1. Capizzi A, et al. Traumatic brain injury: an overview of epidemiology, pathophysiology, and medical management. Med Clin North Am. 2020;104(2):213–238. doi: 10.1016/j.mcna.2019.11.001. - DOI - PubMed
    1. Werner C, Engelhard K. Pathophysiology of traumatic brain injury. Br J Anaesth. 2007;99(1):4–9. doi: 10.1093/bja/aem131. - DOI - PubMed
    1. Sato M, et al. Neuronal injury and loss after traumatic brain injury: time course and regional variability. Brain Res. 2001;917(1):45–54. doi: 10.1016/S0006-8993(01)02905-5. - DOI - PubMed
    1. Kinnunen KM, et al. White matter damage and cognitive impairment after traumatic brain injury. Brain. 2011;134(pt 2):449–63. doi: 10.1093/brain/awq347. - DOI - PMC - PubMed
    1. Kumar A, Loane DJ. Neuroinflammation after traumatic brain injury: opportunities for therapeutic intervention. Brain Behav Immun. 2012;26(8):1191–1201. doi: 10.1016/j.bbi.2012.06.008. - DOI - PubMed