. 2024 May 21;9(12):e165356.
doi: 10.1172/jci.insight.165356.

Adjuvant COX inhibition augments STING signaling and cytolytic T cell infiltration in irradiated 4T1 tumors

Affiliations

Adjuvant COX inhibition augments STING signaling and cytolytic T cell infiltration in irradiated 4T1 tumors

Lisa A Ridnour et al. JCI Insight. .

Abstract

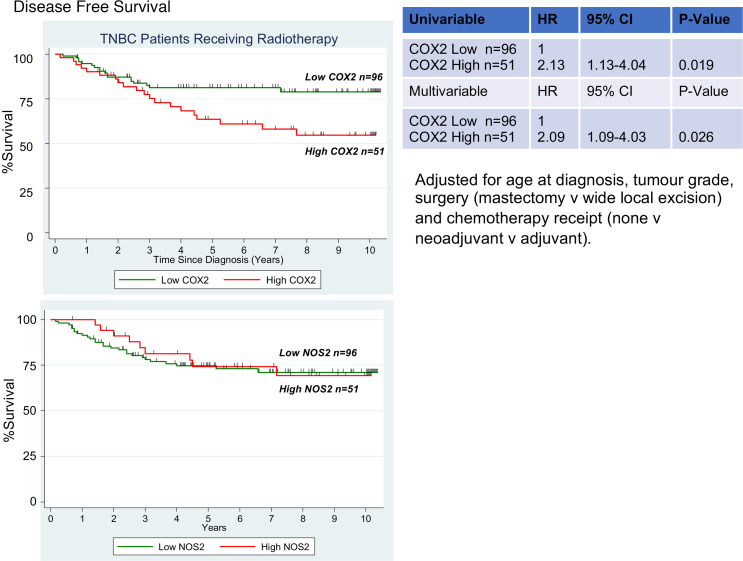
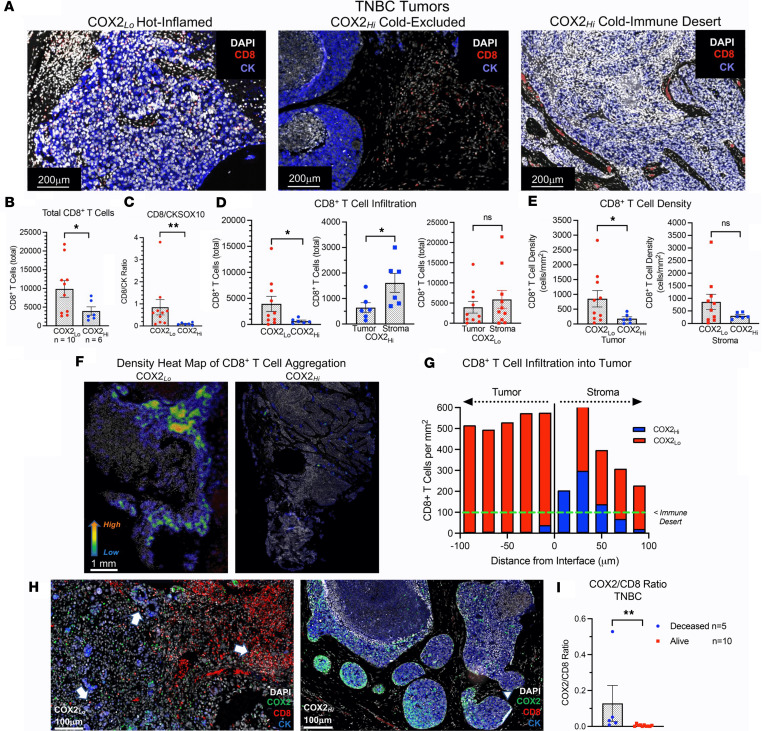
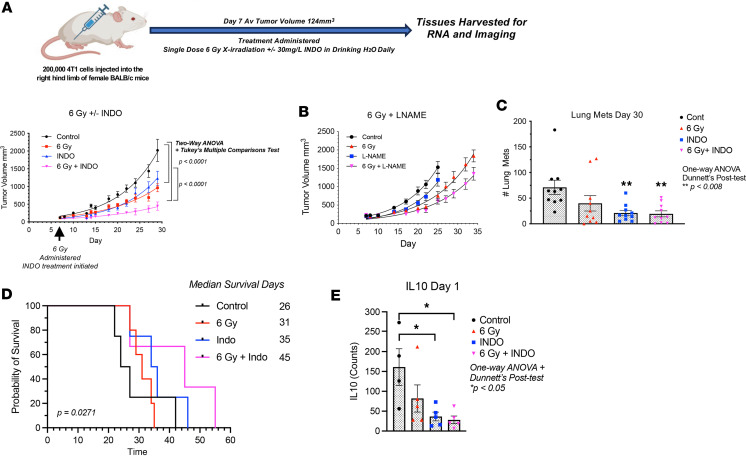
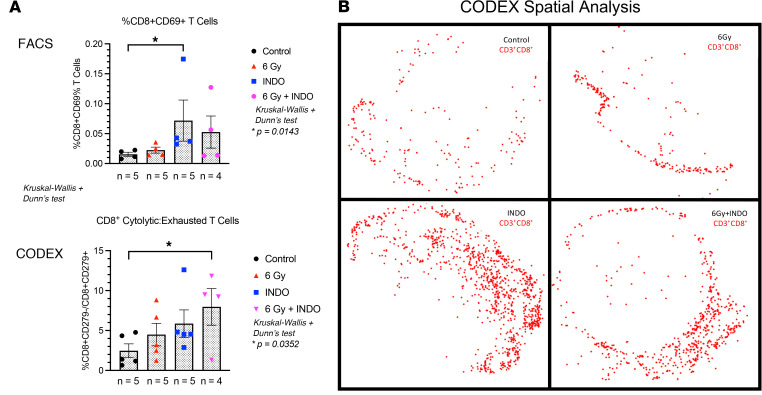
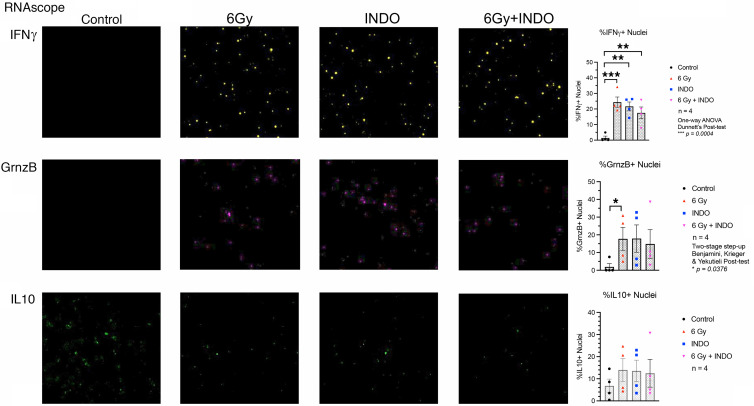
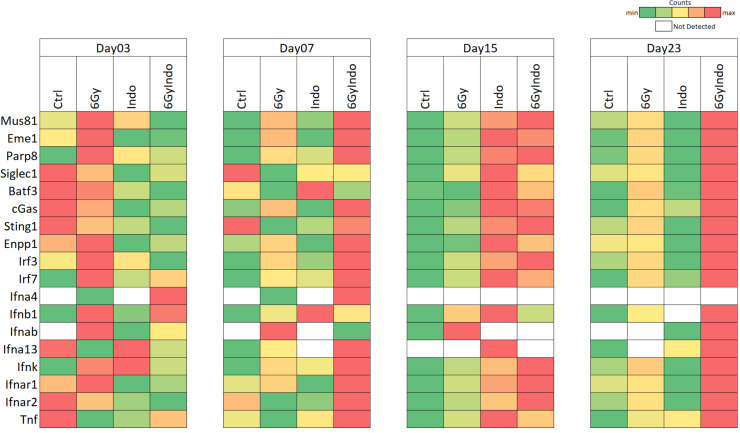
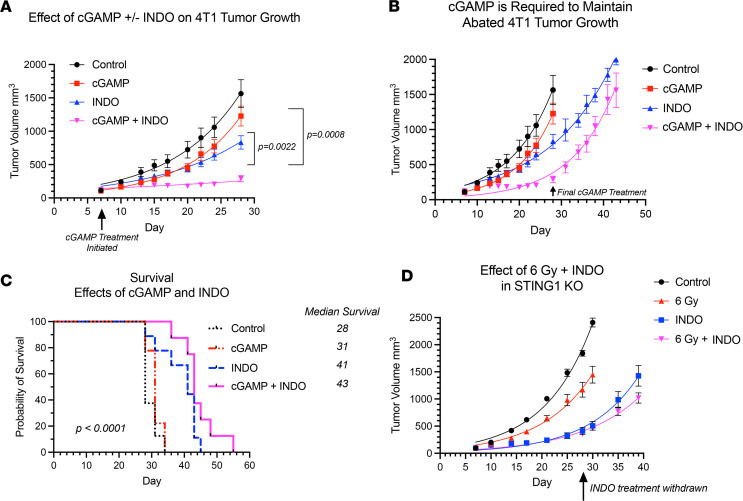
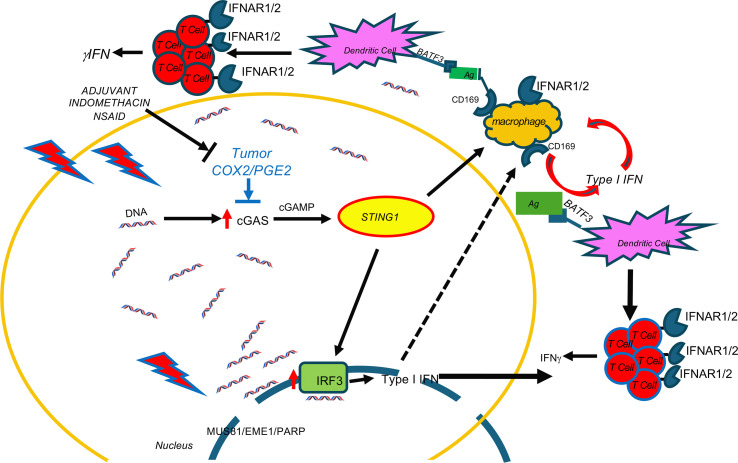
Immune therapy is the new frontier of cancer treatment. Therapeutic radiation is a known inducer of immune response and can be limited by immunosuppressive mediators including cyclooxygenase-2 (COX2) that is highly expressed in aggressive triple negative breast cancer (TNBC). A clinical cohort of TNBC tumors revealed poor radiation therapeutic efficacy in tumors expressing high COX2. Herein, we show that radiation combined with adjuvant NSAID (indomethacin) treatment provides a powerful combination to reduce both primary tumor growth and lung metastasis in aggressive 4T1 TNBC tumors, which occurs in part through increased antitumor immune response. Spatial immunological changes including augmented lymphoid infiltration into the tumor epithelium and locally increased cGAS/STING1 and type I IFN gene expression were observed in radiation-indomethacin-treated 4T1 tumors. Thus, radiation and adjuvant NSAID treatment shifts "immune desert phenotypes" toward antitumor M1/TH1 immune mediators in these immunologically challenging tumors. Importantly, radiation-indomethacin combination treatment improved local control of the primary lesion, reduced metastatic burden, and increased median survival when compared with radiation treatment alone. These results show that clinically available NSAIDs can improve radiation therapeutic efficacy through increased antitumor immune response and augmented local generation of cGAS/STING1 and type I IFNs.

Keywords: Adaptive immunity; Breast cancer; Inflammation; Oncology.


Conflict of interest statement

Conflict of interest: The authors have declared that no conflict of interest exists.

Figures

Figure 1
Figure 1. Association between tumor COX2 expression and breast cancer survival.
Kaplan-Meier and log rank test were used to determine cumulative disease-free survival curve of patients with TNBC (n = 147) by COX2 status; when compared with low COX2 tumor expression (n = 96), high COX2 (n = 51) predicted poor survival among patients who had received fractionated radiation doses totaling 50 Gy. P = 0.026. Elevated NOS2 tumor expression had no predictive value in the same patients.
Figure 2
Figure 2. CD8+ T cell spatial distribution in COX2hi and COX2lo expressing tumors.
(A) CD8+ T cells (red stain), CK tumor marker (blue stain), and DAPI (white stain) showing COX2lo “Hot-Inflamed” tumor with high CD8+ T cell penetration into tumor epithelium, COX2hi “Cold-Excluded” tumor showing CD8+ T cells restricted to stroma, and COX2hi “Cold-Immune Desert” showing few or absence of CD8+ T cells in the tumor epithelium. Scale bars: 200 μm. (B) CD8+ T cell quantification showing increased total CD8+ T cells in COX2lo (red circles n = 10) versus COX2hi (blue circles n = 6) tumors. (C) Increased CD8+ T cell/tumor CKSOX10 ratio in COX2lo (red) versus COX2hi (blue) tumors. (D) The left graph shows significantly elevated CD8+T cell infiltration in COX2lo versus COX2hi tumors. The middle graph shows significantly reduced CD8+ T cell infiltration in COX2hi annotated tumor regions where CD8+ T cells are highly stroma restricted. The right graph shows no significant difference between CD8+ T cells in tumor versus stroma regions in COX2lo tumors. (E) CD8+ T cell density per mm2 localized in tumor- (left) or stroma-annotated (right) regions in COX2lo (red) versus COX2hi (blue) tumors. (F) Density heat map showing elevated CD8+ T cell aggregation in COX2lo versus COX2hi tumors. Scale bar: 1 mm. (G) Increased number of CD8+ T cells infiltrating from tumor-stroma interface into tumor epithelium in COX2lo (red bar) versus COX2hi (blue bar) tumors. (H) COX2lo expressing tumors (left panel) exhibit dramatically increased number and penetration of CD8+ T cells into tumor epithelium (white arrows). In contrast, CD8+ T cell (white arrowhead) in COX2hi tumors (right panel) are stroma restricted. DAPI (white), COX2 (green), CD8+ T cell (red), and CKSOX10 tumor marker (blue) are shown. (I) Increased COX2/CD8+ T cell ratios in patients with TNBC who succumbed to disease versus those who survived (Deceased versus Alive) at 5 years after diagnosis. *P ≤ 0.05, **P ≤ 0.0075 using Mann-Whitney U or Welch’s test.
Figure 3
Figure 3. Antitumor effect of 6 Gy radiation ± INDO in 4T1 tumor–bearing mice.
(A) A single dose of 6 Gy irradiation as well as daily INDO treatments were given on day 7 following tumor injection. After tumor irradiation, the mice were returned to their cage and given INDO (30 mg/L) in the drinking water, which continued for the duration of the experiment. The tumor growth curve shows intermediate growth delays associated with single agent 6 Gy and INDO treatments while 6 Gy + INDO combination treatment abated tumor growth. Two-way ANOVA with Tukey’s multiple-comparison test was used to determine significant changes in tumor growth. (B) Modest enhancement of 6 Gy–induced growth delay by the pan-NOS inhibitor L-NAME. (C) INDO alone and 6 Gy + INDO treatments reduce lung metastatic burden when compared with control untreated mice. One-way ANOVA with Dunnett’s post hoc test was used was used. (D) Improved median survival associated with 6 Gy + INDO combination treatment. P = 0.0271 log rank test for trend. (E) RNA-Seq gene expression showing reduced IL-10 gene expression in INDO and 6 Gy + INDO–treated tumors. One-way ANOVA with Dunnett’s post hoc test were used *P < 0.05.
Figure 4
Figure 4. FACS and CODEX analyses show increased tumor infiltrating CD8+ T cells on day 7 after IR.
(A) FACS and CODEX analysis show increased CD8+CD69+ (active) T cells and increased cytolytic/exhausted CD8+ T cell ratios, respectively. (B) CD8+ T cell spatial distribution, where red dots represent the detection of > 1 CD8+ cell marker in a 25 μm diameter circle and the spatial location of the migrating cells. *P < 0.05 using Kruskal-Wallis with Dunn’s post hoc test.
Figure 5
Figure 5. RNAScope analysis of IFN-γ, GrnzB, and IL-10.
Increased expression of IFN-γ and GrnzB supportive of elevated cytolytic CD8+ T cell phenotypes were measured in treated tumors on day 7 after IR. No significant changes in IL-10 expression were observed. *P < 0.05, **P < 0.006, ***P = 0.0004 using 1-way ANOVA with Dunnett’s post hoc test or Kruskal-Wallis with Benjamini, Krieger, & Yekutieli 2-stage step-up post hoc test. Magnification, ×20.
Figure 6
Figure 6. Increased cGAS/STING1 in 6 Gy + INDO–treated tumors.
Heatmaps analysis of individual genes related to the cGAS/STING pathway leading to augmented type I IFN in 6 Gy–, INDO-, and 6 Gy+INDO–treated samples. The green-to-red (low-to-high) color scale indicates the number of transcript counts. White boxes indicate no transcripts were found. Prior to heatmap development in Microsoft 64-bit Excel 365, transcript counts were normalized using the default “counts per million + 0.0001” method in the Partek Flow software (Build 10.0.22.0428).
Figure 7
Figure 7. STING agonist cGAMP + INDO abates 4T1 tumor growth.
(A) The STING agonist cGAMP was administered intratumorally (5 μg/50 μL in endotoxin-free H20) 2 times per week for 3 weeks beginning on day 7 as indicated by the arrows. INDO administration in the drinking water also began on day 7 and was present continuously throughout the experiment. The cGAMP + INDO combination treatment completely abated tumor growth. Two-way ANOVA with Tukey’s multiple-comparison test was used. (B) Tumor growth in cGAMP + INDO resumed after cGAMP treatment stopped on day 29. (C) cGAMP + INDO combination treatment improved median survival when compared with cGAMP treatment alone. Statistical Log-rank (Mantel-Cox) test was used. (D) INDO treatment promoted antitumor effects independent of radiation in STING-KO mice indicating the importance of local tumor STING response versus systemic STING depletion in mice.
Figure 8
Figure 8. Indomethacin augments cytoplasmic tumor DNA accumulation and downstream induction of cGAS/STING1, and type I IFN in treated tumors.
Radiation + indomethacin for COX2 inhibition increases cytoplasmic tumor DNA accumulation through MUS81/EME1/PARP. Accumulated cytoplasmic tumor DNA then induces cGAS/STING, type I IFNs, IFNAR, and increases cytolytic T cells.

References

    1. O’Donnell JS, et al. Cancer immunoediting and resistance to T cell-based immunotherapy. Nat Rev Clin Oncol. 2019;16(3):151–167. doi: 10.1038/s41571-018-0142-8. - DOI - PubMed
    1. Gruosso T, et al. Spatially distinct tumor immune microenvironments stratify triple-negative breast cancers. J Clin Invest. 2019;129(4):1785–1800. doi: 10.1172/JCI96313. - DOI - PMC - PubMed
    1. Solinas C, et al. Targeting immune checkpoints in breast cancer: an update of early results. ESMO Open. 2017;2(5):e000255. doi: 10.1136/esmoopen-2017-000255. - DOI - PMC - PubMed
    1. Vanpouille-Box C, et al. TGFβ is a master regulator of radiation therapy-induced antitumor immunity. Cancer Res. 2015;75(11):2232–2242. doi: 10.1158/0008-5472.CAN-14-3511. - DOI - PMC - PubMed
    1. Hu Z, et al. An albumin-bound drug conjugate of paclitaxel and indoleamine-2,3-dioxygenase inhibitor for enhanced cancer chemo-immunotherapy. Nanotechnology. 2020;31(29):295101. doi: 10.1088/1361-6528/ab824d. - DOI - PubMed

MeSH terms