

Histological Hyperspectral Glioblastoma Dataset (HistologyHSI-GB)
- PMID: 38914542
- PMCID: PMC11196658
- DOI: 10.1038/s41597-024-03510-x
Histological Hyperspectral Glioblastoma Dataset (HistologyHSI-GB)
Erratum in
-
Publisher Correction: Histological Hyperspectral Glioblastoma Dataset (HistologyHSI-GB).Sci Data. 2024 Jul 29;11(1):829. doi: 10.1038/s41597-024-03654-w. Sci Data. 2024. PMID: 39075058 Free PMC article. No abstract available.
Abstract
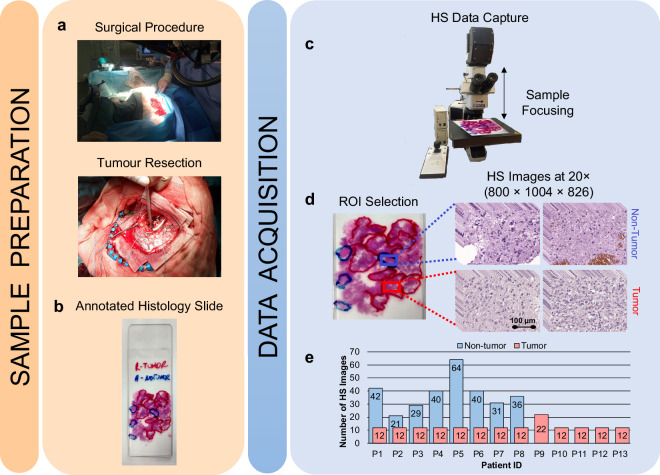
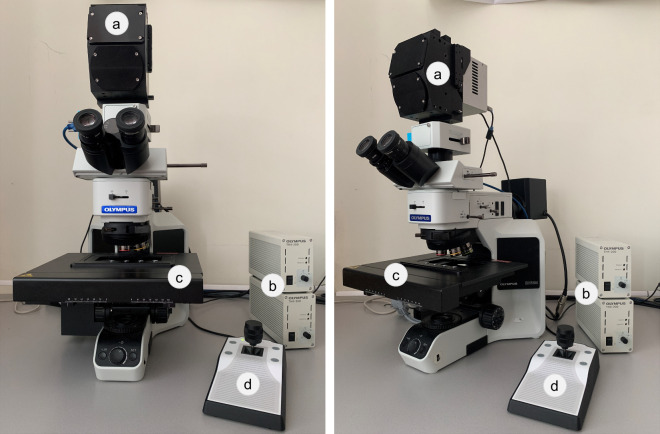
Hyperspectral (HS) imaging (HSI) technology combines the main features of two existing technologies: imaging and spectroscopy. This allows to analyse simultaneously the morphological and chemical attributes of the objects captured by a HS camera. In recent years, the use of HSI provides valuable insights into the interaction between light and biological tissues, and makes it possible to detect patterns, cells, or biomarkers, thus, being able to identify diseases. This work presents the HistologyHSI-GB dataset, which contains 469 HS images from 13 patients diagnosed with brain tumours, specifically glioblastoma. The slides were stained with haematoxylin and eosin (H&E) and captured using a microscope at 20× power magnification. Skilled histopathologists diagnosed the slides and provided image-level annotations. The dataset was acquired using custom HSI instrumentation, consisting of a microscope equipped with an HS camera covering the spectral range from 400 to 1000 nm.
© 2024. The Author(s).
Conflict of interest statement
The authors declare no competing interests.
Figures


References
-
- Goetz, A. F. H., Vane, G., Solomon, J. E. & Rock, B. N. Imaging Spectrometry for Earth Remote Sensing. Science (1979)228, 1147–1153 (1985). - PubMed
-
- Khan, A., Vibhute, A. D., Mali, S. & Patil, C. H. A systematic review on hyperspectral imaging technology with a machine and deep learning methodology for agricultural applications. Ecol Inform69, 101678 (2022).10.1016/j.ecoinf.2022.101678 - DOI
-
- Sethy, P. K., Pandey, C., Sahu, Y. K. & Behera, S. K. Hyperspectral imagery applications for precision agriculture - a systemic survey. Multimed Tools Appl81, 3005–3038 (2022).10.1007/s11042-021-11729-8 - DOI
-
- Ortega, S., Lindberg, S.-K., E. Anderssen, K. & Heia, K. Perspective Chapter: Hyperspectral Imaging for the Analysis of Seafood. in Hyperspectral Imaging - A Perspective on Recent Advances and Applications10.5772/intechopen.108726 (IntechOpen, 2023).
Publication types
MeSH terms
Grants and funding
- TESIS2021010084/Agencia Canaria de Investigación, Innovación y Sociedad de la Información (ACIISI)
- TESIS2020010078/Agencia Canaria de Investigación, Innovación y Sociedad de la Información (ACIISI)
- FJC2020-043474-I/Ministry of Economy and Competitiveness | Agencia Estatal de Investigación (Spanish Agencia Estatal de Investigación)
- PID2020-116417RB-C42 AEI/10.13039/501100011033/Ministry of Economy and Competitiveness | Agencia Estatal de Investigación (Spanish Agencia Estatal de Investigación)
LinkOut - more resources
Full Text Sources
Medical
