. 2024 Jun 24;15(1):5352.
doi: 10.1038/s41467-024-49718-8.

Cancer cell plasticity defines response to immunotherapy in cutaneous squamous cell carcinoma

Affiliations

Cancer cell plasticity defines response to immunotherapy in cutaneous squamous cell carcinoma

Laura Lorenzo-Sanz et al. Nat Commun. .

Abstract

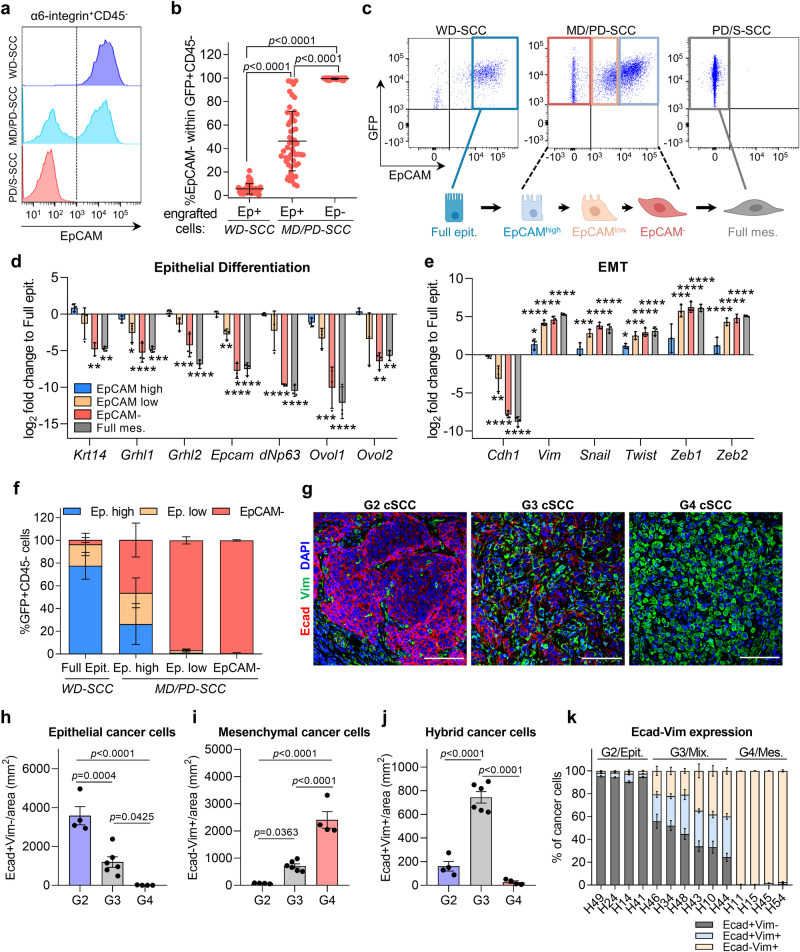
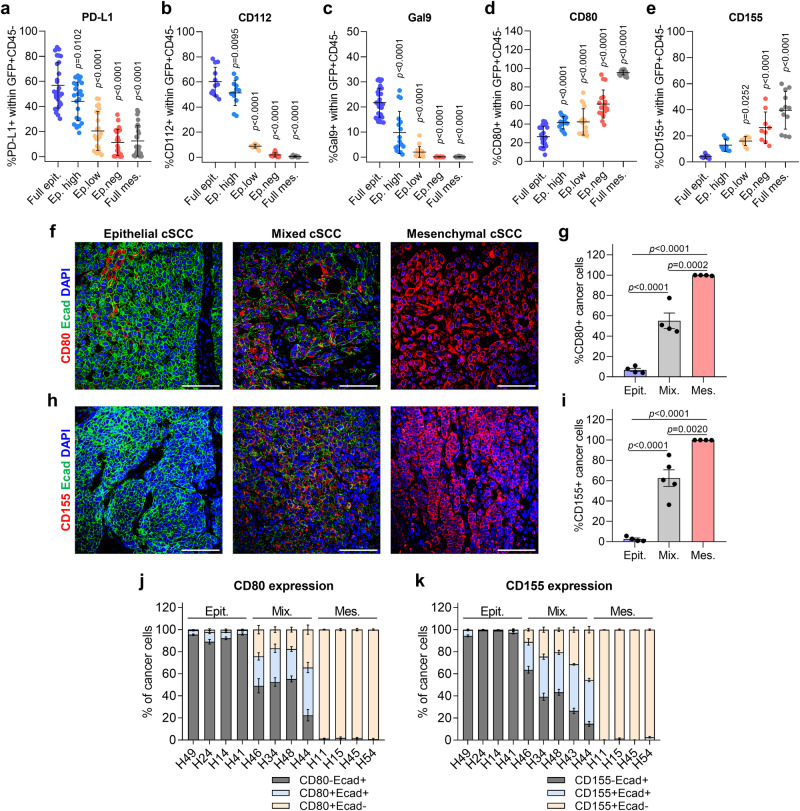
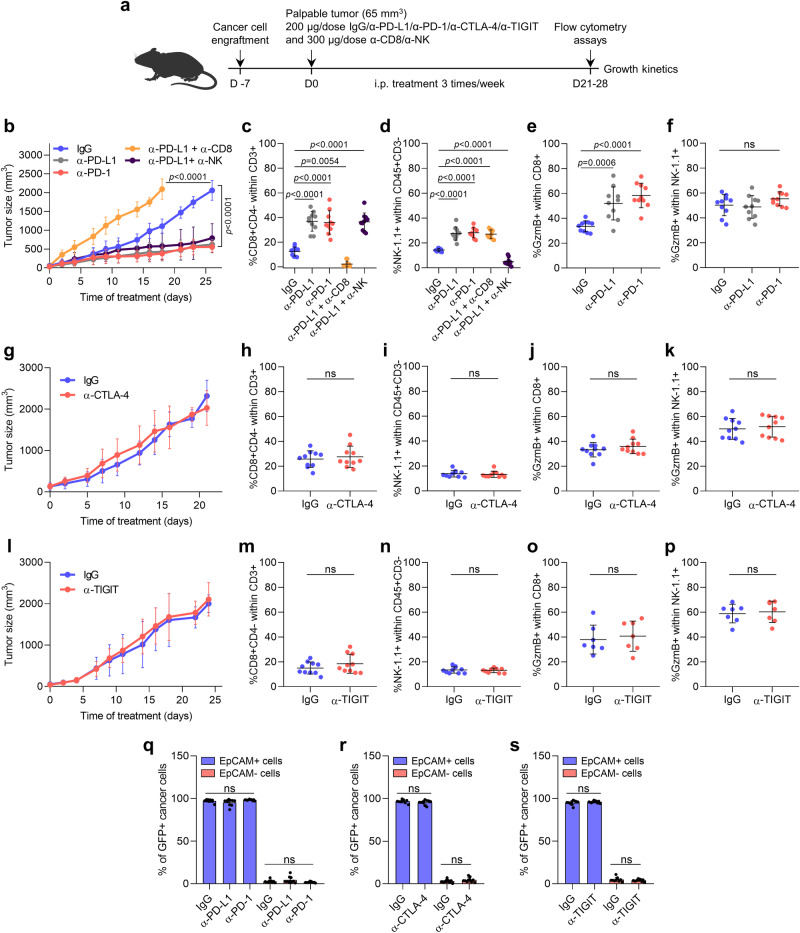
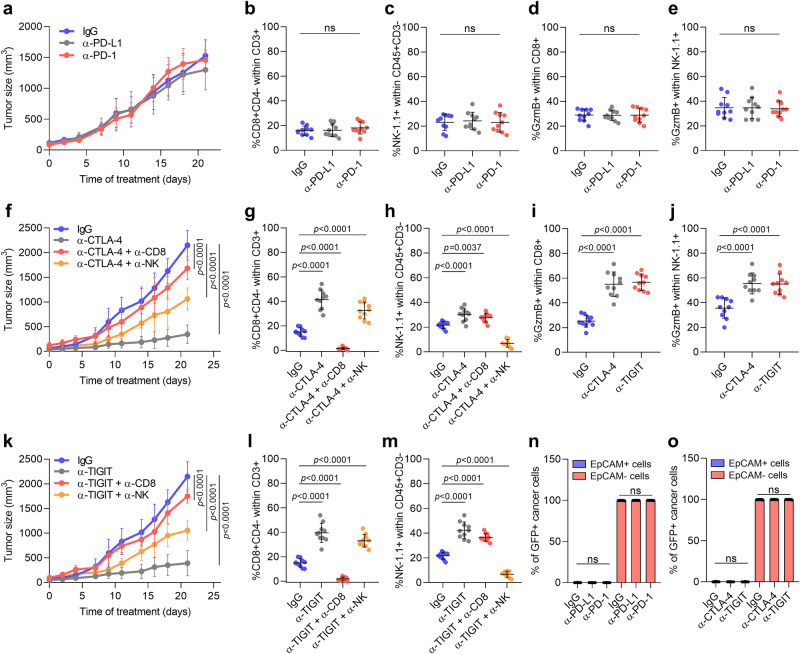
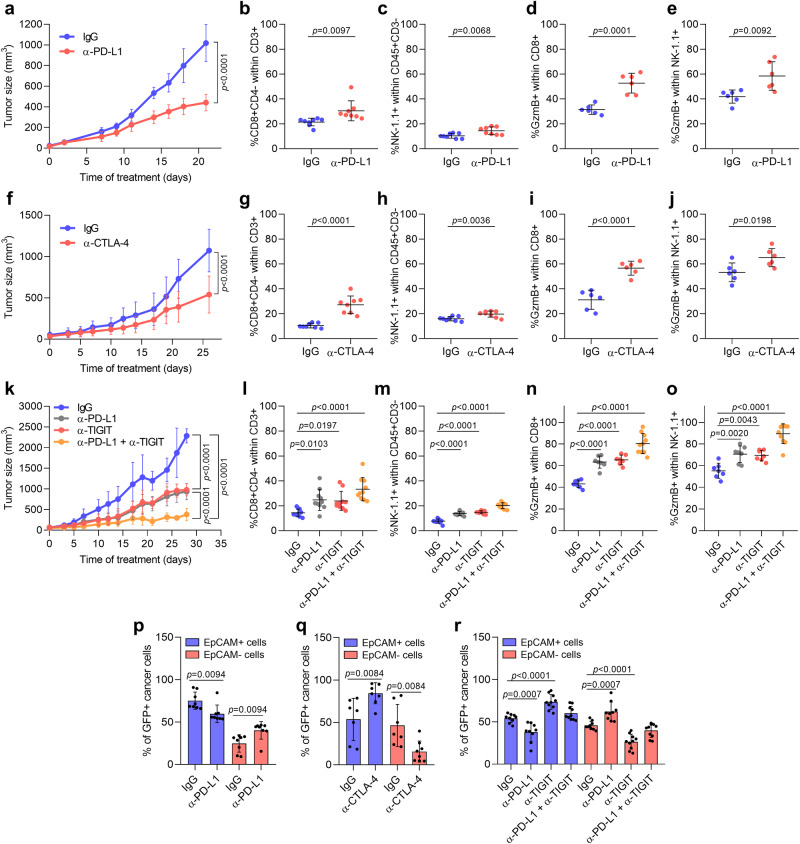
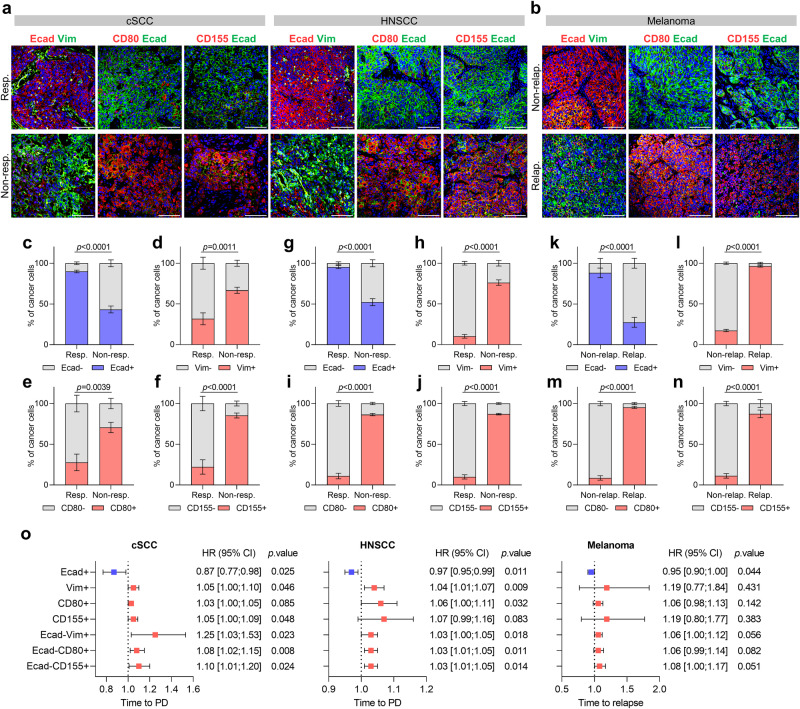
Immune checkpoint blockade (ICB) approaches have changed the therapeutic landscape for many tumor types. However, half of cutaneous squamous cell carcinoma (cSCC) patients remain unresponsive or develop resistance. Here, we show that, during cSCC progression in male mice, cancer cells acquire epithelial/mesenchymal plasticity and change their immune checkpoint (IC) ligand profile according to their features, dictating the IC pathways involved in immune evasion. Epithelial cancer cells, through the PD-1/PD-L1 pathway, and mesenchymal cancer cells, through the CTLA-4/CD80 and TIGIT/CD155 pathways, differentially block antitumor immune responses and determine the response to ICB therapies. Accordingly, the anti-PD-L1/TIGIT combination is the most effective strategy for blocking the growth of cSCCs that contain both epithelial and mesenchymal cancer cells. The expression of E-cadherin/Vimentin/CD80/CD155 proteins in cSCC, HNSCC and melanoma patient samples predicts response to anti-PD-1/PD-L1 therapy. Collectively, our findings indicate that the selection of ICB therapies should take into account the epithelial/mesenchymal features of cancer cells.


Conflict of interest statement

M.E. declares research grants from Ferrer International and Incyte, and consulting fees from Quimatryx outside of this study. M.O. declares consulting or advisory arrangements with Merck, MSD and Transgene; research support (clinical trials) from Merck and Roche; that the institution receives clinical trial support from AbbVie, Ayala Pharmaceutical, MSD, ALX Oncology, Debiopharm International, Merck, ISA Pharmaceuticals, Roche Pharmaceuticals, Boehringer Ingelheim, Seagen, Gilead; and travel accommodation expenses from MSD, Merck. J.M.P. declares consulting or advisory roles for Janssen Oncology, Astellas Pharma, VCN Biosciences, Clovis Oncology, Roche/Genentech, Bristol-Myers Squibb, Merck Sharp & Dohme, BeiGene; research funding from Bristol-Myers Squibb, AstraZeneca/MedImmune, Merck Sharp & Dohme, Pfizer/EMD Serono, Incyte, Janssen Oncology; and travel, accommodation and other expenses from Janssen Oncology, Roche, Bristol-Myers Squibb. J.M.-L. has received lecturing fees from Astellas, Bristol-Myers Squibb, MSD, Novartis, Pierre Fabre, Pfizer, Roche, and Sanofi; advisory fees from Bristol-Myers Squibb, Highlight Therapeutics, Novartis, Pierre Fabre, Roche, Sanofi; and travel grants from Bristol-Myers Squibb, Merck, MSD, Novartis, Pierre Fabre, Pfizer, Roche, Ipsen. All other authors declare no potential competing interests.

Figures

Fig. 1
Fig. 1. Epithelial, hybrid E/M, and mesenchymal cancer cells are detected in mouse and patient cSCCs.
a Representative flow cytometry profile of α6-integrin+CD45EpCAM+ and EpCAM cancer cells within WD-SCCs, MD/PD-SCCs, and PD/S-SCCs, which had previously been generated by orthotopic serial engraftments. b Percentage of mesenchymal GFP+CD45EpCAM cancer cells generated after engrafting the indicated GFP+ cancer cells into immunocompetent syngeneic mice (n = 52 tumors per group). c Flow cytometry strategy to isolate full epithelial, EpCAMhigh, EpCAMlow, EpCAM and full mesenchymal cancer cells from WD-SCCs, MD/PD-SCCs, and PD/S-SCCs based on EpCAM expression. d, e mRNA expression levels of d epithelial differentiation and e EMT genes in the indicated cancer cells relative to full epithelial cancer cells (n = 3 biologically independent samples per group). dNp63, Zeb2 (****p  <  0.0001), Krt14 (**p  =  0.0010, **p  =  0.0011), Grhl1 (*p  =  0.0156, ****p  <  0.0001, ***p  =  0.0002), Grhl2 (***p  =  0.0005, ****p  <  0.0001), Epcam (**p  =  0.0030, ****p  <  0.0001), Ovol1 (***p  =  0.0001, ****p  <  0.0001), Ovol2 (**p  =  0.0038, **p  =  0.0087), Cdh1 (**p  =  0.0034, ****p  <  0.0001), Vim (*p  =  0.0161, ****p  <  0.0001), Snail (***p  =  0.0004, ****p  <  0.0001), Twist (*p  =  0.0333, ***p  =  0.0002, ****p  <  0.0001), Zeb1 (***p  =  0.0002, ****p  <  0.0001). f Percentage of EpCAMhigh, EpCAMlow, and EpCAM cancer cells within tumors generated after engrafting full epithelial (n = 41), EpCAMhigh (n = 32), EpCAMlow (n = 10), and EpCAM (n = 49) cancer cells. g Representative immunofluorescence images of Ecad+ (red), Vim+ (green), and DAPI nuclear (blue) staining in G2, G3, and G4 patient cSCCs. Scale bar, 100 µm. hj Quantification of h epithelial Ecad+Vim, i mesenchymal EcadVim+, and j hybrid Ecad+Vim+ cancer cells per tumor area (mm2) in G2 (n = 4), G3 (n = 6), and G4 (n = 4) patient cSCCs. Each dot represents the average quantification of at least seven fields from different tumor regions. k Percentage of Ecad+Vim, Ecad+Vim+, and EcadVim+ cancer cells relative to total cancer cells in epithelial (n = 4), mixed (n = 6), and mesenchymal (n = 4) patient cSCCs. Data are represented as the mean ± SD (b, df) or ± SEM (hk), and n values indicate independent tumors (b, f, hk). P values are determined by one-way ANOVA with Tukey’s (b, hj) or Dunnett’s (d, e) multiple comparison tests. See Supplementary Fig. 2 for the gating strategy (b, f). Source data are provided as a Source Data file.
Fig. 2
Fig. 2. IC ligand repertoire differs according to the epithelial, hybrid E/M, or mesenchymal features of cancer cells in mouse and patient cSCCs.
a Percentage of PD-L1+ cells within full epithelial cancer cells from epithelial cSCCs (n = 27), EpCAMhigh, EpCAMlow, and EpCAM cancer cells from mixed cSCCs (n = 23), and full mesenchymal cancer cells from mesenchymal cSCCs (n = 27). b Percentage of CD112+ cells within the indicated cancer cells (n = 12 tumors per group). c Percentage of Gal9+ cells within full epithelial cancer cells from epithelial cSCCs (n = 27), EpCAMhigh, EpCAMlow, and EpCAM cancer cells from mixed cSCCs (n = 17), and full mesenchymal cancer cells from mesenchymal cSCCs (n = 21). d Percentage of CD80+ cells within full epithelial cancer cells from epithelial cSCCs (n = 24), EpCAMhigh, EpCAMlow, and EpCAM cancer cells from mixed cSCCs (n = 18), and full mesenchymal cancer cells from mesenchymal cSCCs (n = 21). e Percentage of CD155+ cells within full epithelial cancer cells from epithelial cSCCs (n = 10), EpCAMhigh, EpCAMlow, and EpCAM cancer cells from mixed cSCCs (n = 9), and full mesenchymal cancer cells from mesenchymal cSCCs (n = 12). f, h Representative immunofluorescence images of Ecad+ (green), f CD80+ or h CD155+ (red), and DAPI nuclear (blue) staining in the indicated patient cSCCs. Scale bar, 100 µm. g Percentage of CD80+ cancer cells relative to total cancer cells in the indicated patient cSCCs (n = 4 per group). i Percentage of CD155+ cancer cells relative to total cancer cells in epithelial (n = 4), mixed (n = 5), and mesenchymal (n = 4) patient cSCCs. Each dot indicates the average quantification of at least five fields from different tumor regions. j Percentage of CD80Ecad+, CD80+Ecad+, and CD80+Ecad cancer cells relative to total cancer cells in the indicated patient cSCCs (n = 4 per group). k Percentage of CD155Ecad+, CD155+Ecad+, and CD155+Ecad cancer cells relative to total cancer cells in epithelial (n = 4), mixed (n = 5), and mesenchymal (n = 4) patient cSCCs. Data are represented as the mean ± SD (ae) or ± SEM (g, i, j, k), and n values indicate independent tumors (ae, g, i). P values are determined by one-way ANOVA with Dunnett’s (ae) or Tukey’s (g, i) multiple comparison tests. See Supplementary Fig. 2 for the gating strategy (ae). Source data are provided as a Source Data file.
Fig. 3
Fig. 3. Mouse epithelial and mesenchymal cancer cells activate different IC pathways to attenuate CD8+ T cell activity.
a Scheme of the experimental setup for epithelial and mesenchymal cancer cell co-cultures with CD3/CD28-activated CD8+ T cells isolated from the spleens of mice bearing epithelial or mesenchymal cSCCs for 4 days. Anti-PD-L1, anti-CTLA-4, and anti-TIGIT antibodies were added to the co-culture mediums on day 2. b Percentage of PD-L1+, Gal9+, CD80+ and CD155+ cells within epithelial (n = 7) and mesenchymal (n = 5) cancer cells growing in vitro. ce Percentage of c PD-1+, d CTLA-4+, and e TIGIT+ cells within CD8+ T cells isolated from the spleens of mice bearing epithelial (Epit.) or mesenchymal (Mes.) cSCCs on days 0, 2 and 4 of in vitro culture (n = 6 per time point). f Representative CD8+ T cell proliferation as monitored by flow cytometry quantification of violet dye dilution when co-cultured with epithelial or mesenchymal cancer cells, with or without PD-L1, CTLA-4, and TIGIT-blocking antibodies. g Percentage of proliferative CD8+ T cells in the presence of epithelial cancer cells, without (n = 14) or with PD-L1, CTLA-4, and TIGIT-blocking antibodies (n = 7 per group). Percentage of CD69+ and CD25+ CD8+ T cells in the presence of epithelial cancer cells, without (n = 13) or with PD-L1, CTLA-4, and TIGIT-blocking antibodies (n = 9 per group). Percentage of GzmB + CD8+ T cells in the presence of epithelial cancer cells, without (n = 8) or with PD-L1, CTLA-4, and TIGIT-blocking antibodies (n = 7 per group). h Percentage of proliferative CD8+ T cells in the presence of mesenchymal cancer cells, without (n = 11) or with PD-L1, CTLA-4, and TIGIT-blocking antibodies (n = 7 per group). Percentage of CD69+, CD25+, and GzmB+ CD8+ T cells in the presence of mesenchymal cancer cells, without (n = 11) or with PD-L1, CTLA-4, and TIGIT-blocking antibodies (n = 9 per group). Data are represented as the mean ± SD (b) or ± SEM (ce, g, h), and n values indicate independent cancer cells (b) or experiments (ce, g, h). P values are determined by unpaired two-sided Student’s t-test (b), one-way ANOVA with Dunnett’s multiple comparison test (ce, g, and h: CD25 and GzmB), and Kruskal–Wallis with Dunn’s multiple comparison test (h: proliferation and CD69). Source data are provided as a Source Data file.
Fig. 4
Fig. 4. Anti-PD-L1/PD-1 response is mediated by CD8+ T cells in mouse epithelial cSCCs.
a Experimental scheme for the treatment of mice bearing epithelial, mixed, and mesenchymal cSCCs with 200 µg/dose of IgG isotype control, anti-PD-L1, anti-PD-1, anti-CTLA-4, and anti-TIGIT antibodies, and 300 µg/dose of anti-CD8 and anti-NK1.1 antibodies (i.p. three times/week). All treatments started when engrafted tumors reached a volume of 65 mm3. b Growth kinetics of IgG control, anti-PD-L1, anti-PD-1, anti-PD-L1 + anti-CD8, and anti-PD-L1 + anti-NK-treated epithelial cSCCs (n = 10 per group). cf Percentage of c CD8+ T cells, d NK cells, e GzmB+ CD8+ T cells, and f GzmB+ NK cells in the indicated epithelial cSCCs (n = 10 per group). g Growth kinetics of IgG control and anti-CTLA-4-treated epithelial cSCCs (n = 10 per group). hk Percentage of h CD8+ T cells, i NK cells, j GzmB+ CD8+ T cells, and k GzmB+ NK cells in IgG control and anti-CTLA-4-treated epithelial cSCCs (n = 10 per group). l Growth kinetics of IgG control and anti-TIGIT-treated epithelial cSCCs (n = 10 per group). mp Percentage of m CD8+ T cells (n = 10 per group), n NK cells (n = 10 per group), o GzmB+ CD8+ T cells (n = 7 per group), and p GzmB+ NK cells (n = 7 per group) in IgG control and anti-TIGIT-treated epithelial cSCCs. qs Percentage of GFP+EpCAM+ and GFP+EpCAM cancer cells in the indicated epithelial cSCCs (n = 10 per group). All data are represented as the mean ± SD, and n values indicate independent tumors. P values are determined by two-way ANOVA test (b, g, l), one-way ANOVA with Dunnett’s multiple comparison test (cf, q), and unpaired two-sided Student’s t-test (hk, mp, r, s). ns > 0.05: not significant. See Supplementary Fig. 2 for the gating strategy (cf, hk, ms). Source data are provided as a Source Data file.
Fig. 5
Fig. 5. Anti-CTLA-4 and anti-TIGIT responses are mediated by CD8+ and NK cells in mouse mesenchymal cSCCs.
a Growth kinetics of IgG control, anti-PD-L1, and anti-PD-1-treated mesenchymal cSCCs (n = 10 per group). be Percentage of b CD8+ T cells, c NK cells, d GzmB+ CD8+ T cells, and e GzmB+ NK cells in IgG control, anti-PD-L1, and anti-PD-1-treated mesenchymal cSCCs (n = 10 per group). f, k Growth kinetics of IgG control, (f) anti-CTLA-4, anti-CTLA-4 + anti-CD8, and anti-CTLA-4 + anti-NK or (k) anti-TIGIT, anti-TIGIT + anti-CD8, and anti-TIGIT + anti-NK-treated mesenchymal cSCCs (n = 10 per group). For better visualization, this experiment has been separated into two graphs in which the IgG control group is the same. gj, lm Percentage of g, l CD8+ T cells, hm NK cells, i GzmB+ CD8+ T cells, and j GzmB+ NK cells in the indicated mesenchymal cSCCs (n = 10 per group). n, o Percentage of GFP+EpCAM+ and GFP+EpCAM cancer cells in the indicated mesenchymal cSCCs (n = 10 per group). All data are represented as the mean ± SD, and n values indicate independent tumors. P values are determined by two-way ANOVA test (a, f, k) and one-way ANOVA with Dunnett’s multiple comparison test (be, gj, lo). ns > 0.05: not significant. See Supplementary Fig. 2 for the gating strategy (be, gj, lo). Source data are provided as a Source Data file.
Fig. 6
Fig. 6. Combined anti-PD-L1 and anti-TIGIT therapies suppress mixed mouse cSCC growth by targeting epithelial and mesenchymal cancer cells.
a Growth kinetics of IgG control and anti-PD-L1-treated mixed cSCCs (n = 8 per group). be Percentage of b CD8+ T cells (n = 8), c NK cells (n = 8), d GzmB+ CD8+ T cells (n = 6), and e GzmB+ NK cells (n = 6) in IgG control and anti-PD-L1-treated mixed cSCCs. f Growth kinetics of IgG control and anti-CTLA-4-treated mixed cSCCs (n = 8 per group). gj Percentage of g CD8+ T cells (n = 8), h NK cells (n = 8), i GzmB+ CD8+ T cells (n = 6), and j GzmB+ NK cells (n = 6) in IgG control and anti-CTLA-4-treated mixed cSCCs. k Growth kinetics of IgG control, anti-PD-L1, anti-TIGIT, and anti-PD-L1 + anti-TIGIT-treated mixed cSCCs (n = 10 per group). lo Percentage of l CD8+ T cells (n = 10), m NK cells (n = 10), n GzmB+ CD8+ T cells (n = 7), and o GzmB+ NK cells (n = 7) in the indicated mixed cSCCs. pr Percentage of GFP+EpCAM+ and GFP+EpCAM cancer cells in the indicated mixed cSCCs (PD-L1 and CTLA-4 experiments: n = 8 per group; PD-L1/TIGIT experiment: n = 10 per group). All data are represented as the mean ± SD, and n values indicate independent tumors. P values are determined by two-way ANOVA test (a, f, k), unpaired two-sided Student’s t-test (be, gj, p, q), and one-way ANOVA with Dunnett’s multiple comparison test (lo, r). See Supplementary Fig. 2 for the gating strategy (be, gj, lr). Source data are provided as a Source Data file.
Fig. 7
Fig. 7. Anti-PD-1/PD-L1 resistance in cSCC, HNSCC, and melanoma patient samples is associated with a higher frequency of hybrid E/M and mesenchymal cancer cells.
a, b Representative immunofluorescence images of Ecad+, CD80+ or CD155+ (red), Vim+ or Ecad+ (green), and DAPI nuclear (blue) staining in a anti-PD-1/PD-L1 responder and non-responder cSCCs (left panel) and HNSCCs (right panel), and b anti-PD-1 non-relapsed and relapsed melanomas. Scale bar, 100 µm. cf Percentage (mean ± SEM) of c Ecad/Ecad+, d Vim/Vim+, e CD80/CD80+, and f CD155/CD155+ cancer cells relative to total cancer cells in anti-PD-1/PD-L1 responder and non-responder cSCCs (n = 7 per group). gj Percentage (mean ± SEM) of g Ecad/Ecad+, h Vim/Vim+, i CD80/CD80+, and j CD155/CD155+ cancer cells relative to total cancer cells in anti-PD-1/PD-L1 responder and non-responder HNSCCs (n = 6 responders, n = 13 non-responders). kn Percentage (mean ± SEM) of k Ecad/Ecad+, l Vim/Vim+, m CD80/CD80+, and n CD155/CD155+ cancer cells relative to total cancer cells in anti-PD-1 non-relapsed and relapsed melanomas (n = 5 per group). o Forest plots showing the hazard ratios (HR; blue and red squares) ± 95% confidence intervals (CI; horizontal lines) of the association between the indicated variables and time to progression (PD) or time to relapse. Variables with HR < 1.00 represent protective factors, whereas HR > 1.00 indicates risk factors. Anti-PD-1/PD-L1 responder and non-responder cSCCs (n = 7 per group) and HNSCCs (n = 6 responders, n = 13 non-responders), and anti-PD-1 non-relapsed and relapsed melanomas (n = 5 per group). P values are determined by unpaired two-sided Student’s t-test (cn) and two-sided Cox proportional hazards models (o). Source data are provided as a Source Data file.

References

    1. Nehal KS, Bichakjian CK. Update on keratinocyte carcinomas. N. Engl. J. Med. 2018;379:363–374. doi: 10.1056/NEJMra1708701. - DOI - PubMed
    1. Pickering CR, et al. Mutational landscape of aggressive cutaneous squamous cell carcinoma. Clin. Cancer Res. 2014;20:6582–6592. doi: 10.1158/1078-0432.CCR-14-1768. - DOI - PMC - PubMed
    1. Cherpelis BS, Marcusen C, Lang PG. Prognostic factors for metastasis in squamous cell carcinoma of the skin. Dermatol. Surg. 2002;28:268–273. - PubMed
    1. Brantsch KD, et al. Analysis of risk factors determining prognosis of cutaneous squamous-cell carcinoma: a prospective study. Lancet Oncol. 2008;9:713–720. doi: 10.1016/S1470-2045(08)70178-5. - DOI - PubMed
    1. Gellrich FF, et al. Medical treatment of advanced cutaneous squamous-cell carcinoma. J. Eur. Acad. Dermatol. Venereol. 2019;33:38–43. doi: 10.1111/jdv.16024. - DOI - PubMed

MeSH terms