. 2024 Jun 24;14(1):14464.
doi: 10.1038/s41598-024-61211-2.

An innovative fractional-order evolutionary game theoretical study of personal protection, quarantine, and isolation policies for combating epidemic diseases

Affiliations

An innovative fractional-order evolutionary game theoretical study of personal protection, quarantine, and isolation policies for combating epidemic diseases

Masuda Akter et al. Sci Rep. .

Abstract

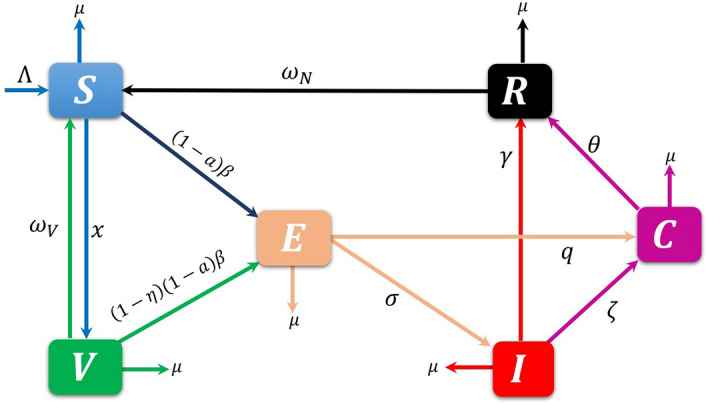
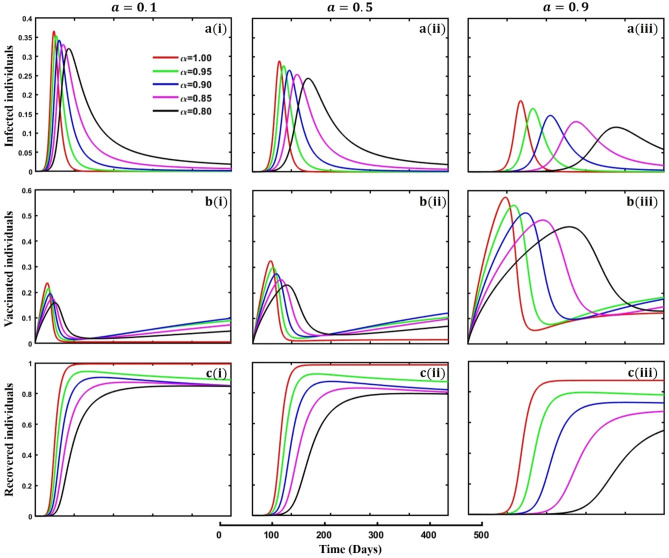
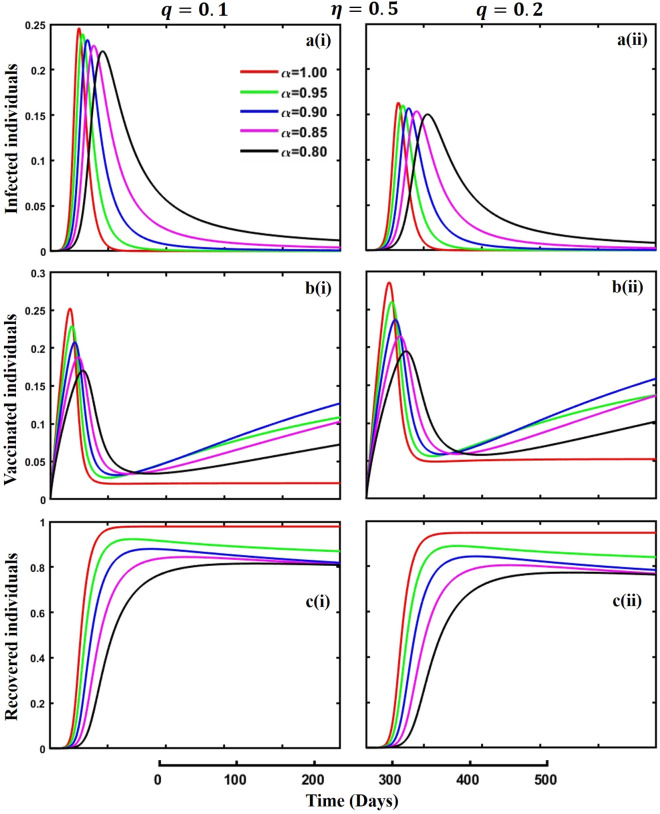
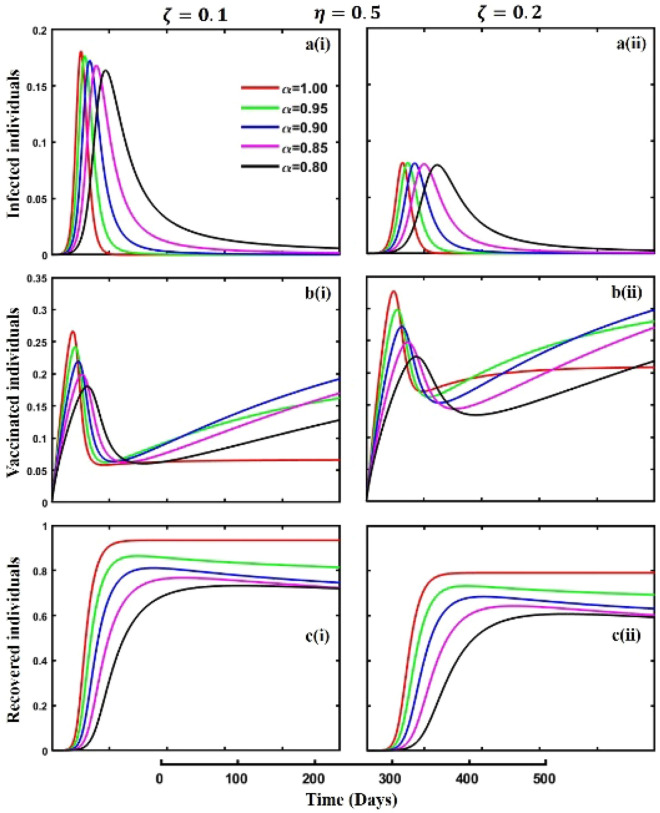
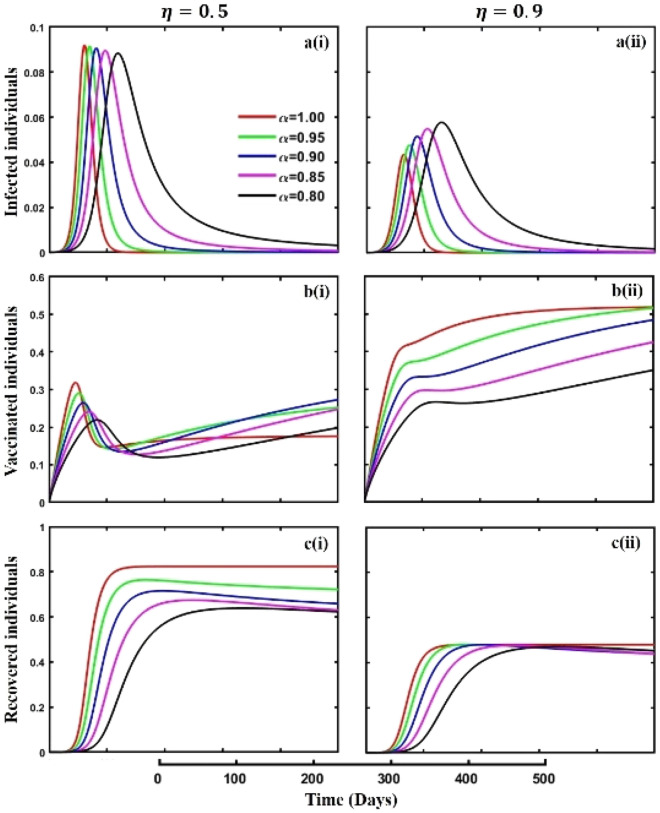
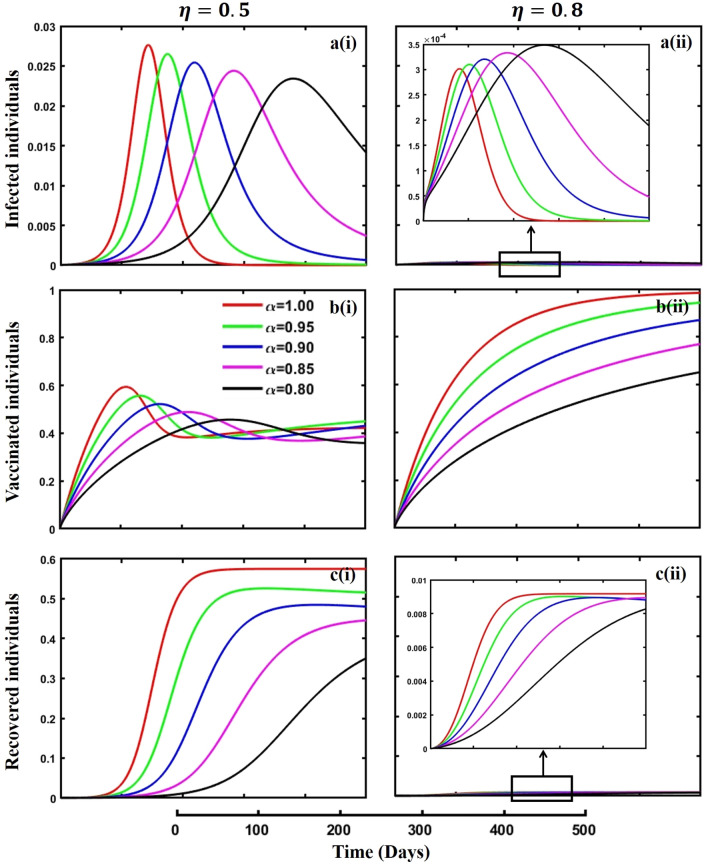
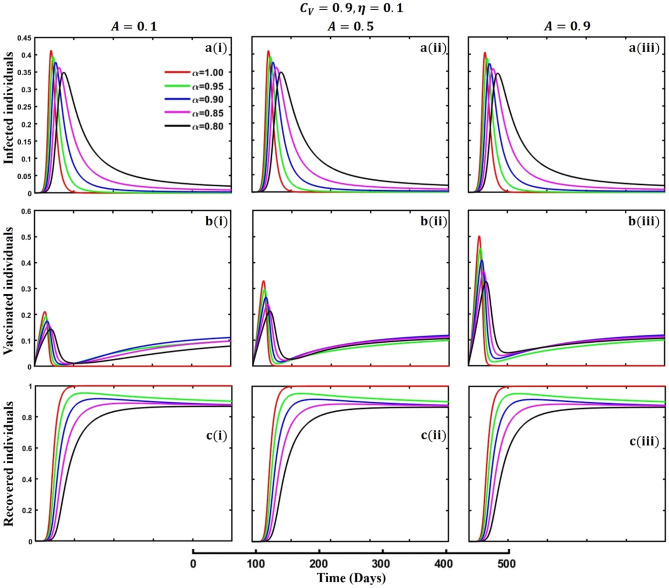
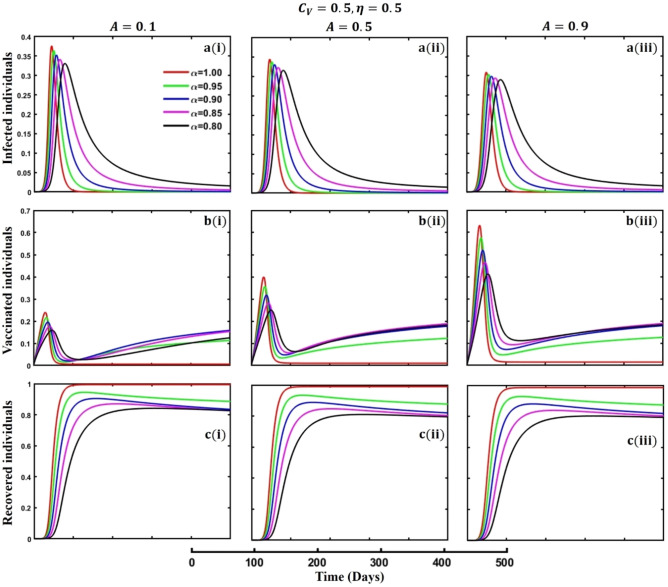
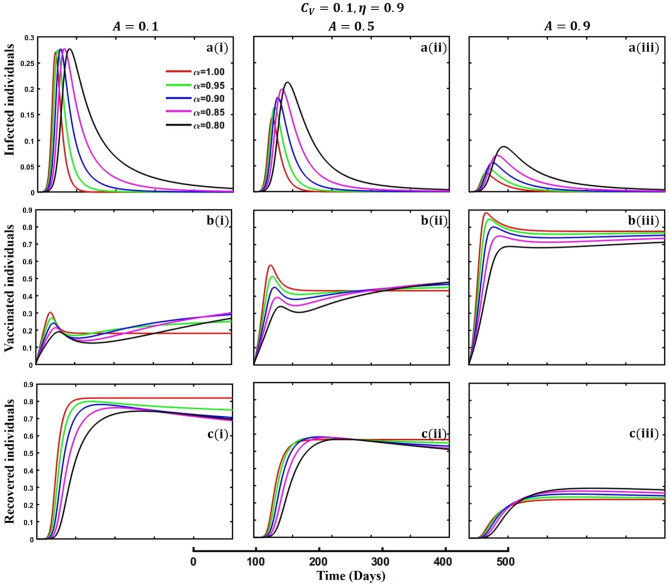
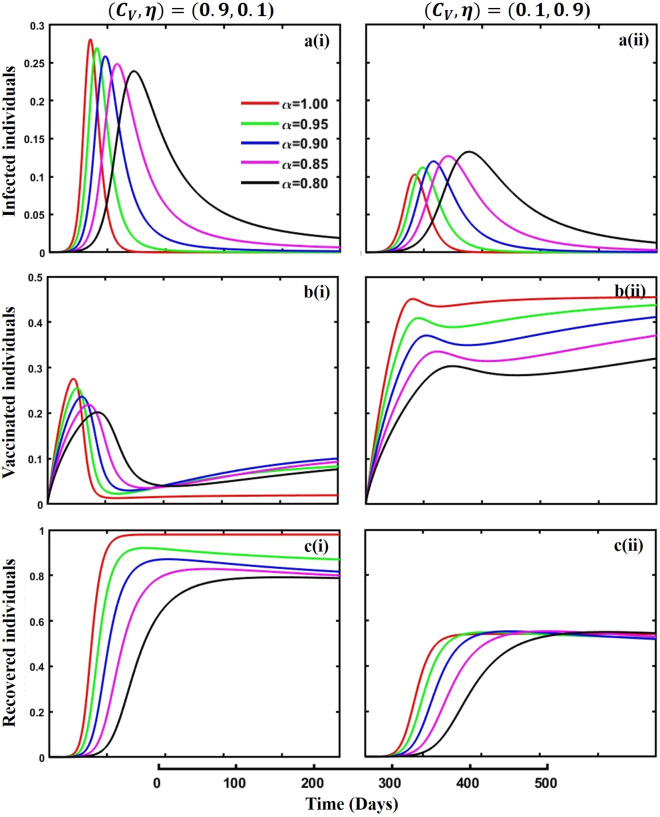
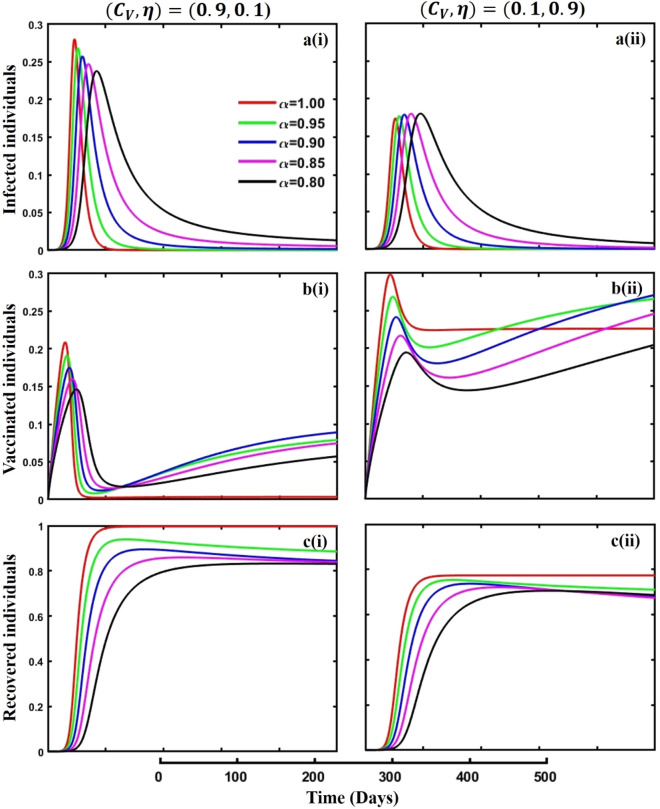
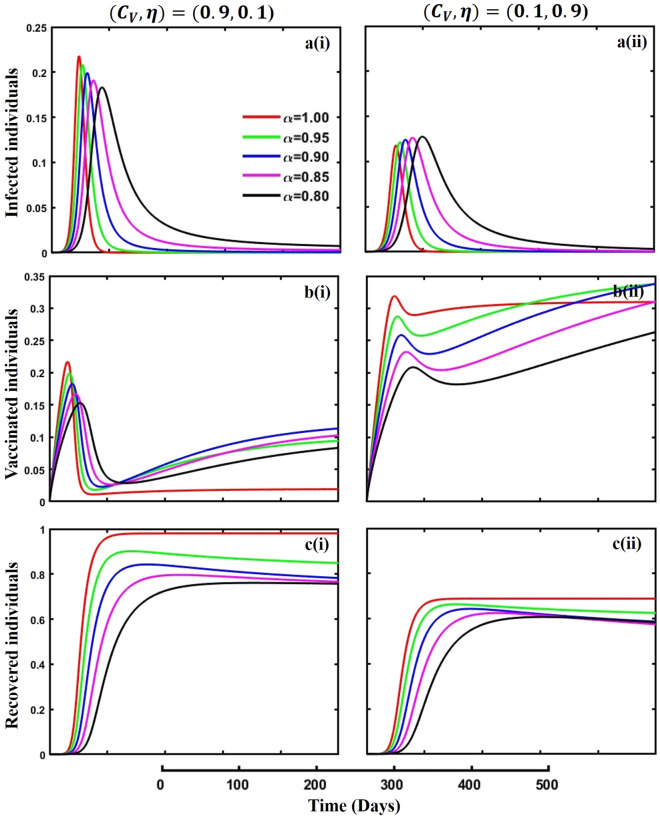
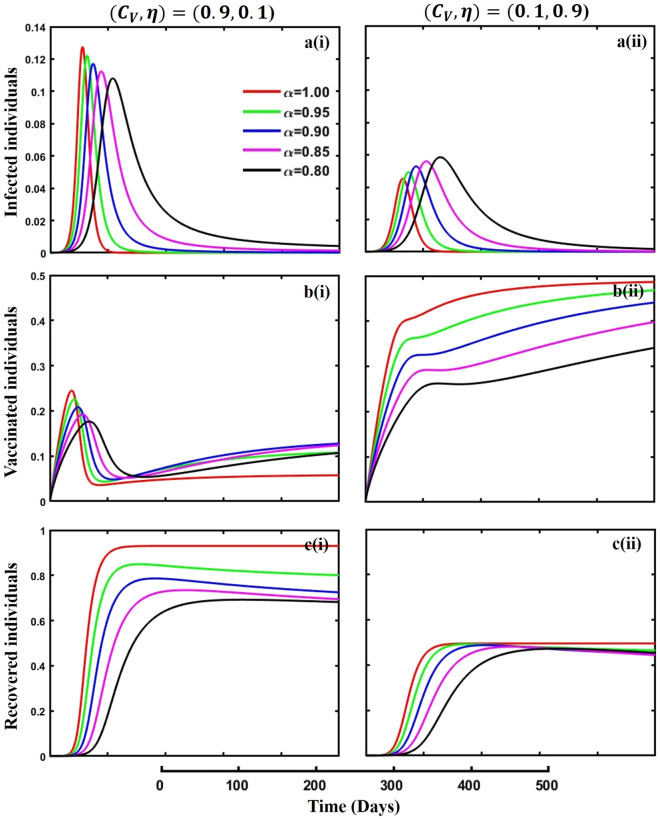
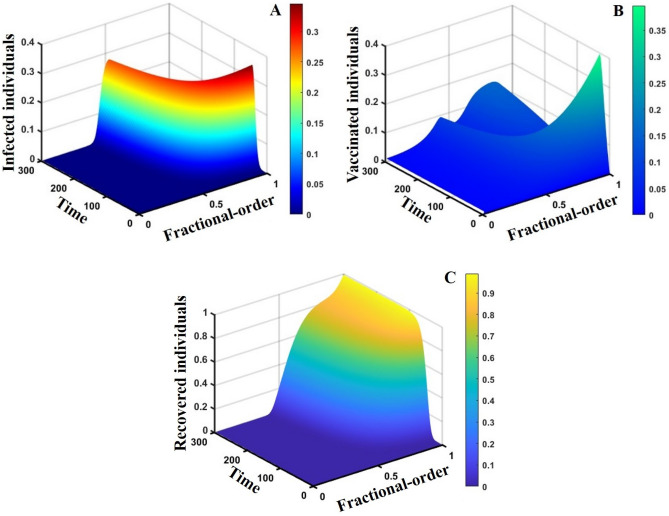
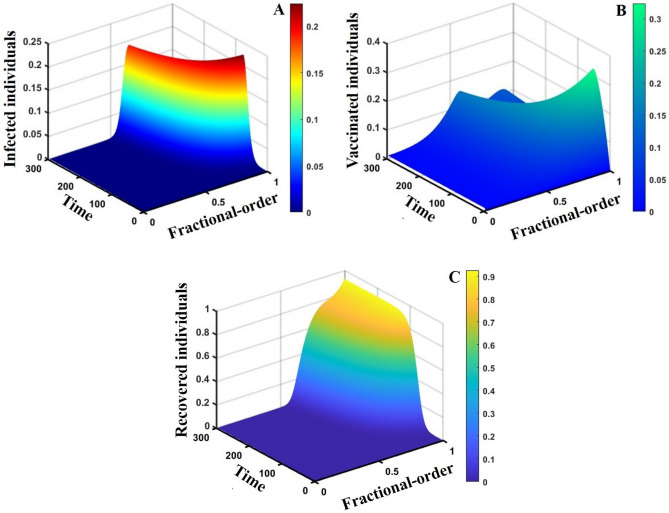
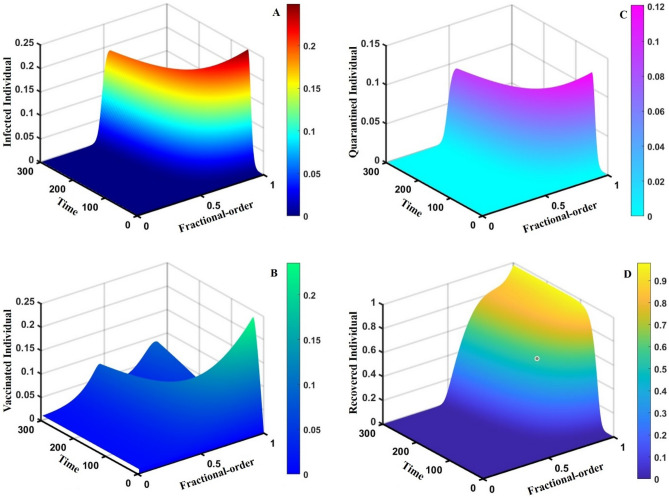
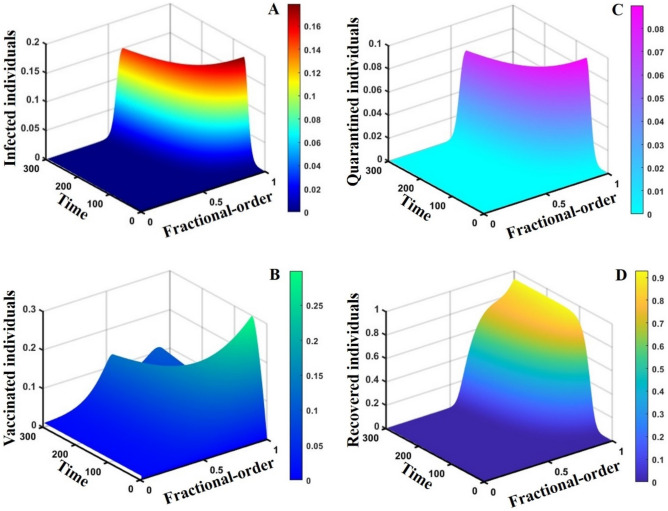
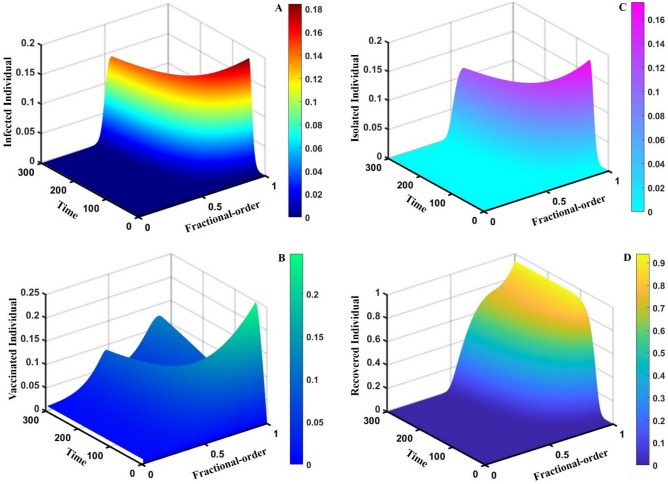
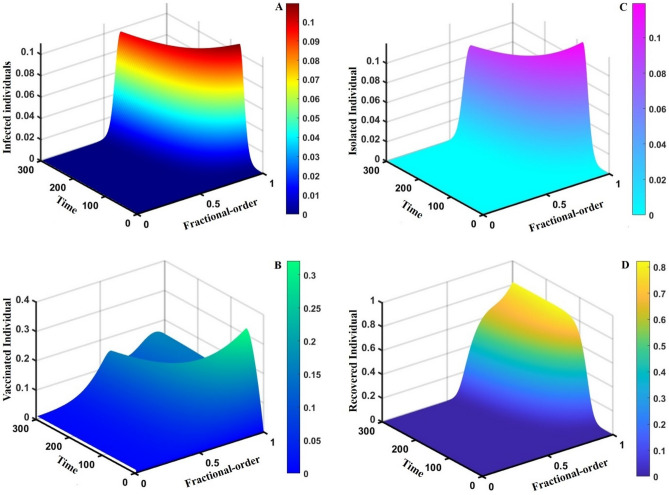
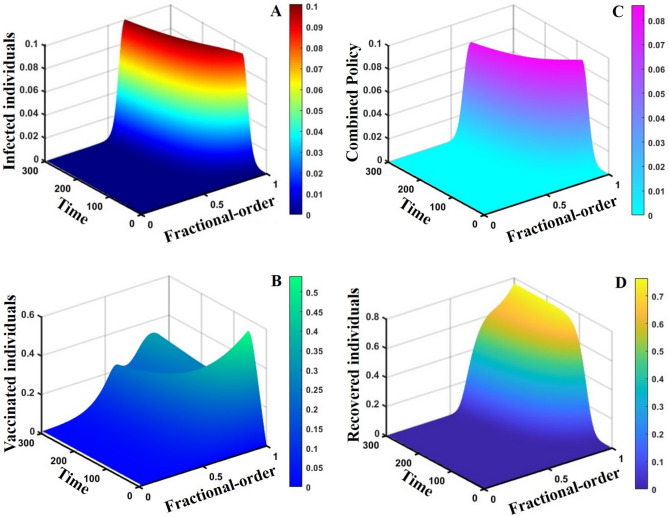
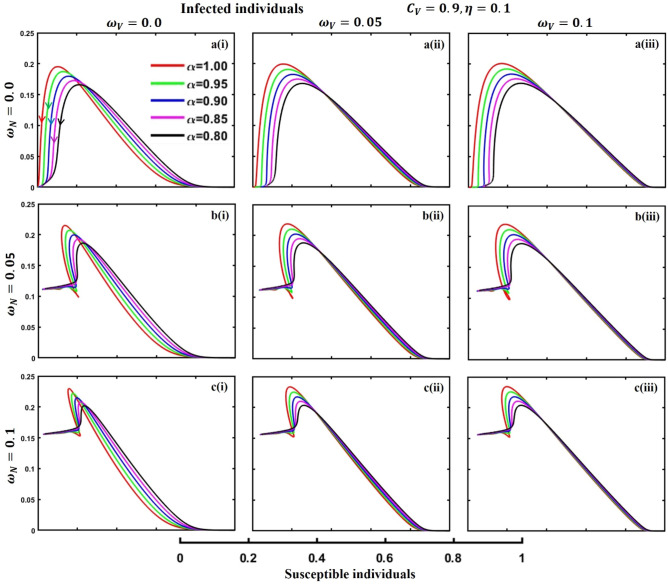
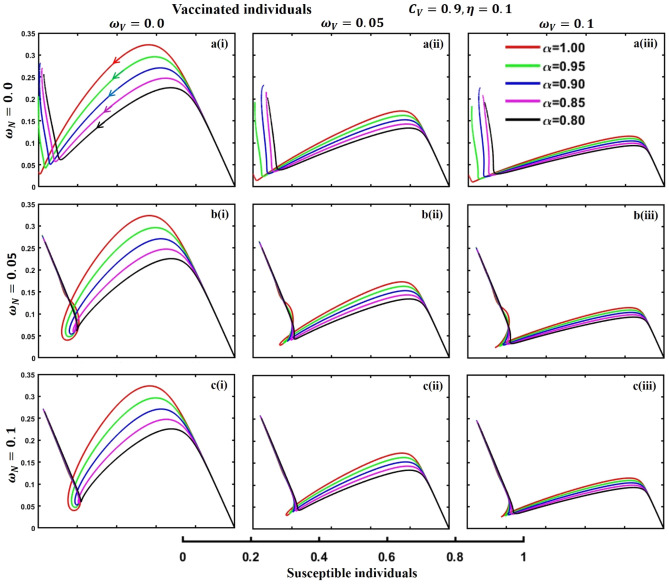
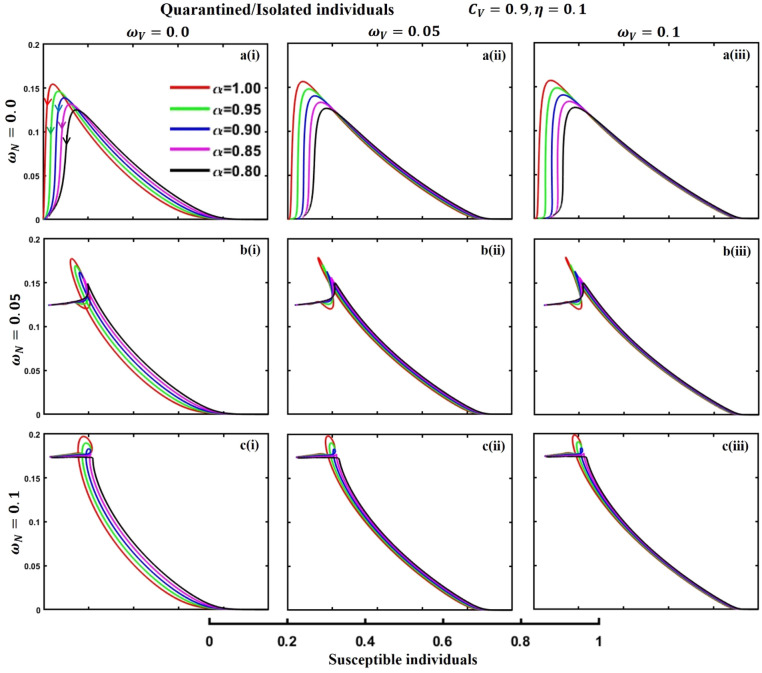
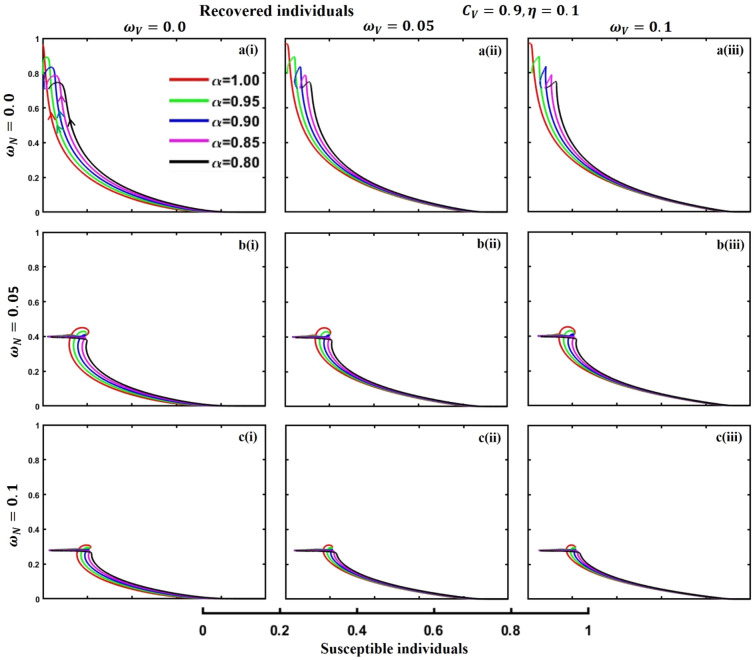
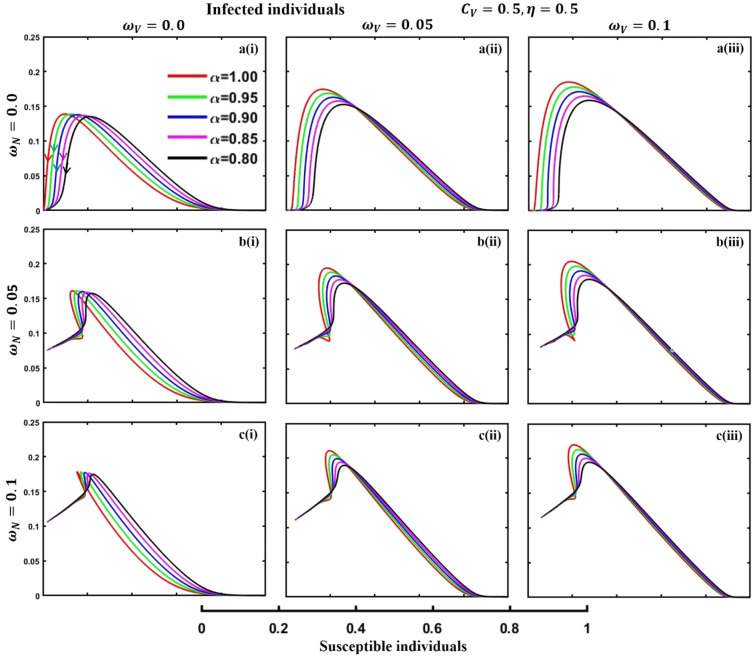
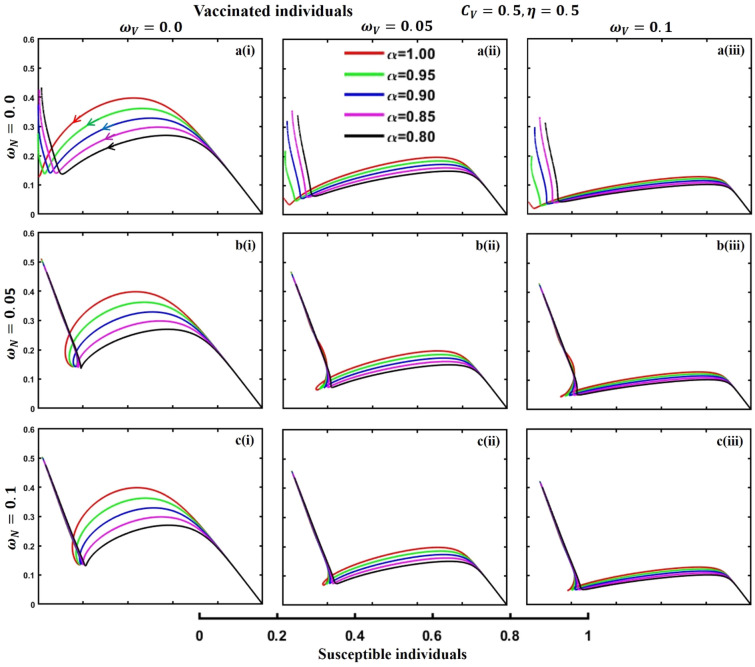
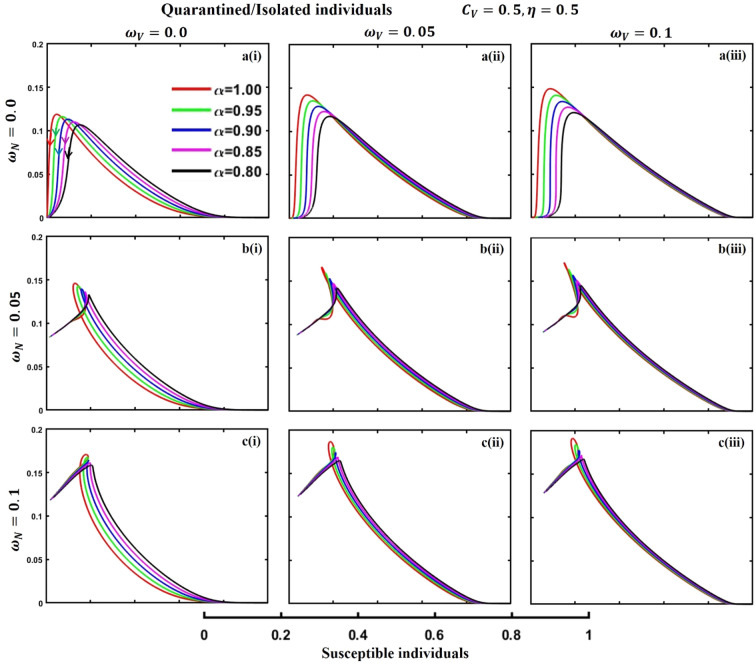
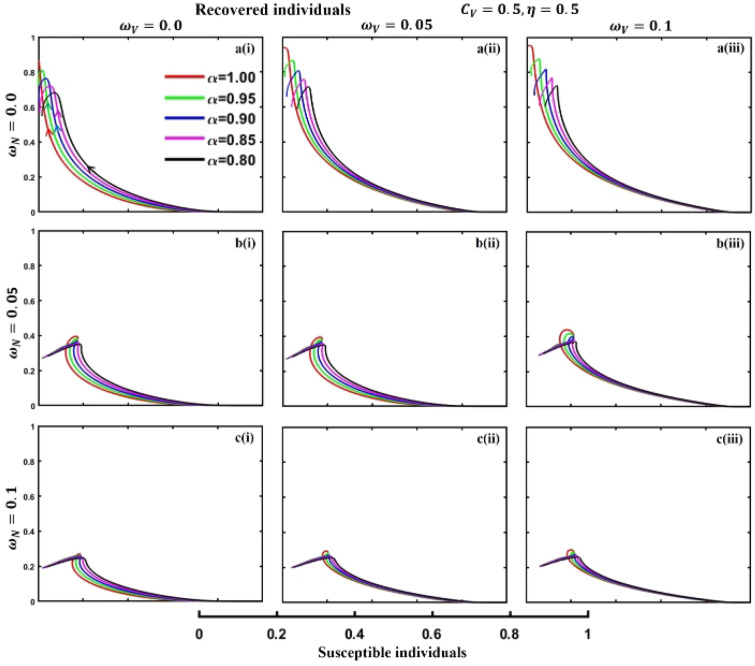
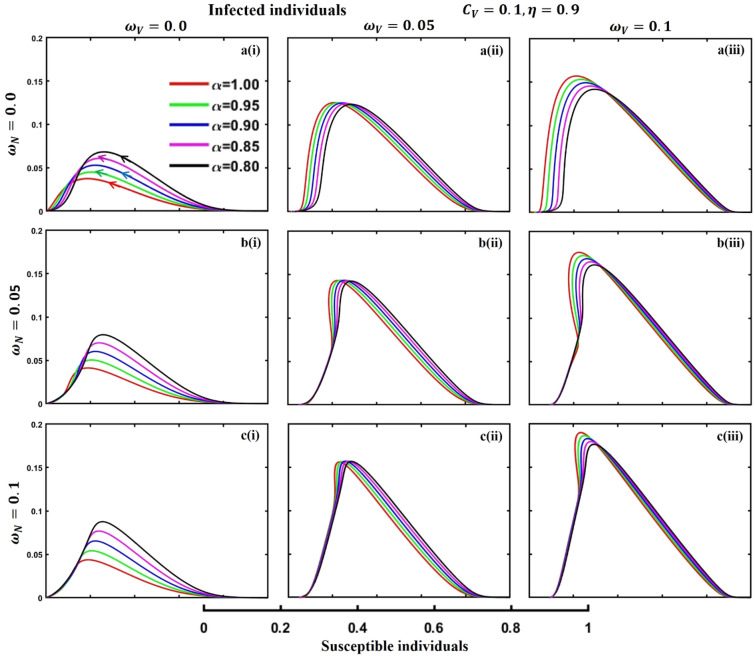
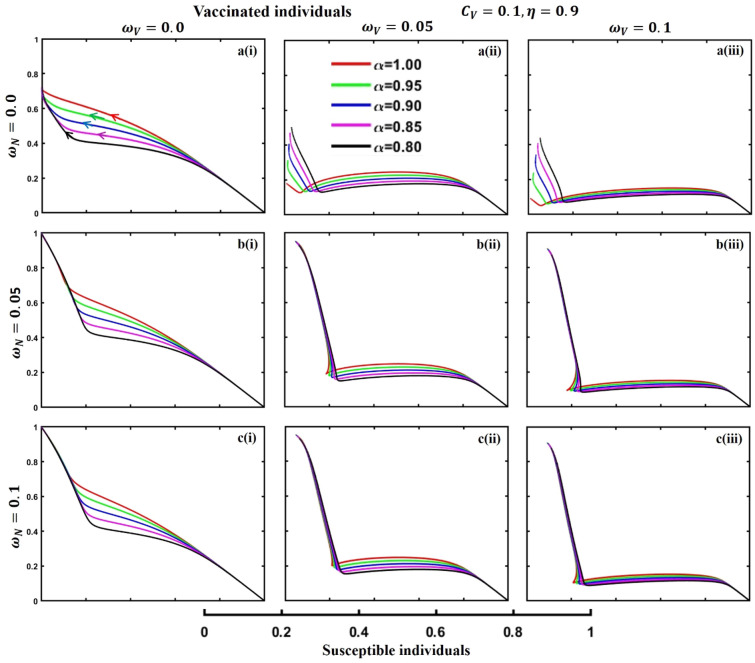
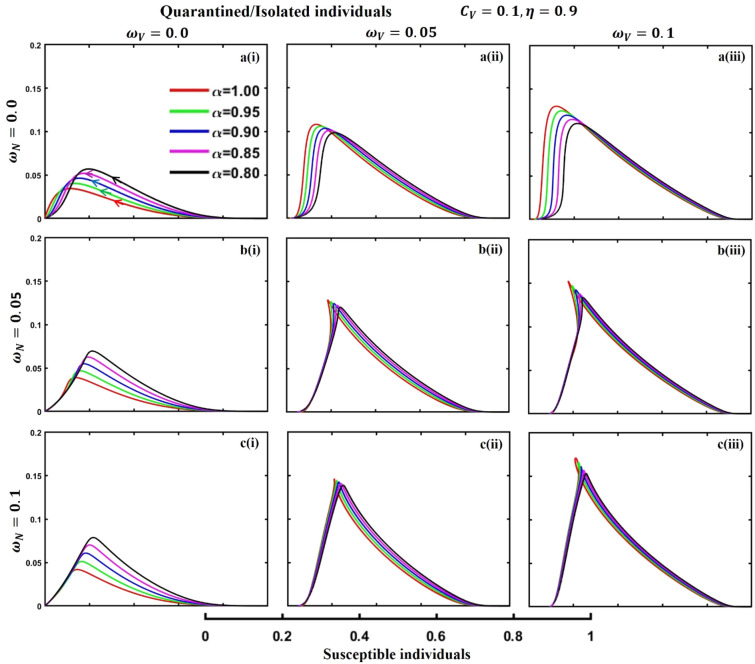
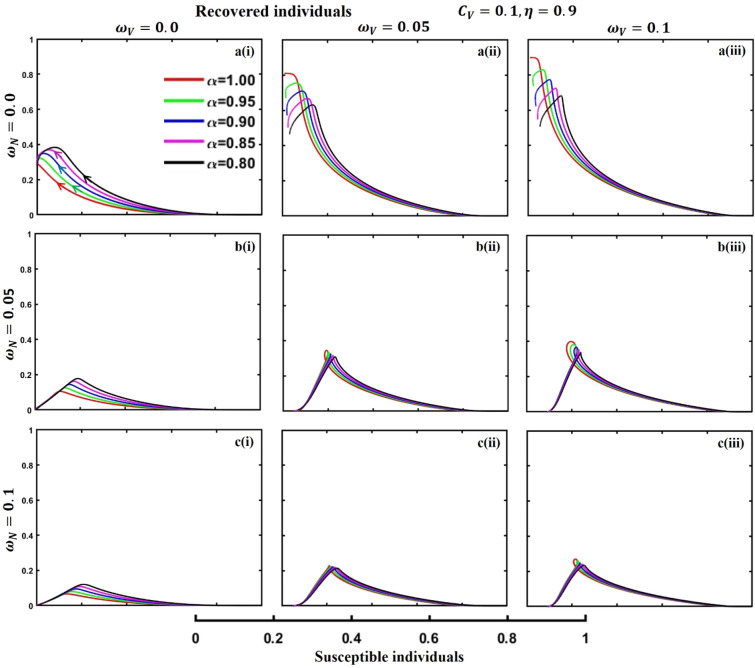
This study uses imposed control techniques and vaccination game theory to study disease dynamics with transitory or diminishing immunity. Our model uses the ABC fractional-order derivative mechanism to show the effect of non-pharmaceutical interventions such as personal protection or awareness, quarantine, and isolation to simulate the essential control strategies against an infectious disease spread in an infinite and uniformly distributed population. A comprehensive evolutionary game theory study quantified the significant influence of people's vaccination choices, with government forces participating in vaccination programs to improve obligatory control measures to reduce epidemic spread. This model uses the intervention options described above as a control strategy to reduce disease prevalence in human societies. Again, our simulated results show that a combined control strategy works exquisitely when the disease spreads even faster. A sluggish dissemination rate slows an epidemic outbreak, but modest control techniques can reestablish a disease-free equilibrium. Preventive vaccination regulates the border between the three phases, while personal protection, quarantine, and isolation methods reduce disease transmission in existing places. Thus, successfully combining these three intervention measures reduces epidemic or pandemic size, as represented by line graphs and 3D surface diagrams. For the first time, we use a fractional-order derivate to display the phase-portrayed trajectory graph to show the model's dynamics if immunity wanes at a specific pace, considering various vaccination cost and effectiveness settings.

Keywords: Evolutionary game; Fractional-order; Non-pharmaceutical intervention; Protection.


Conflict of interest statement

The authors declare no competing interests.

Figures

Figure 1
Figure 1
Flow diagram of the epidemiology model (1). The state variables and parameters of the model are described in Table 1.
Figure 2
Figure 2
The effect of fractional-order α=0.8,0.85,0.9,0.95,1.0 on the infected (Panel a-*), vaccinated (Panel b-*), and recovered (Panel c-*) individuals. Subpanels (*-i), (*-ii), and (*-iii) show the results of awareness rate a=0.1,0.5 and 0.9, respectively, whereas the remaining parameter settings are β=0.8333,γ=0.1,x=0.01,σ=1/4,η=0.5,q=0.0,ζ=0.0,ωV=0.0,ωN=0.0, and θ=1/14.
Figure 3
Figure 3
The effect of fractional-order α=0.8,0.85,0.9,0.95,1.0 on the infected (Panel a-*), vaccinated (Panel b-*), and recovered (Panel c-*) individuals. Subpanels (*-i) and (*-ii) show the results of quarantine rate q=0.1 and 0.2, respectively, whereas the remaining parameter settings are β=0.8333,γ=0.1,x=0.01,σ=1/4,η=0.5,ζ=0.0,ωV=0.0,ωN=0.0,a=0.0 and θ=1/14.
Figure 4
Figure 4
The effect of fractional-order α=0.8,0.85,0.9,0.95,1.0 on the infected (Panel a-*), vaccinated (Panel b-*), and recovered (Panel c-*) individuals. Subpanels (*-i) and (*-ii) show the results of isolation rate ζ=0.1 and 0.2, respectively, whereas the remaining parameter settings are β=0.8333,γ=0.1,x=0.01,σ=1/4,η=0.5,q=0.0,ωV=0.0,ωN=0.0,a=0.0 and θ=1/14.
Figure 5
Figure 5
The effect of fractional-order α=0.8,0.85,0.9,0.95,1.0 on the infected (Panel a-*), vaccinated (Panel b-*), and recovered (Panel c-*) individuals. Subpanels (*-i) and (*-ii) shows the outcome of vaccine efficacy η=0.5 and 0.9, respectively, whereas, remaining parameter settings are β=0.8333,γ=0.1,x=0.01,σ=1/4,q=ζ=0.1,ωV=0.0,ωN=0.0,a=0.0 and θ=1/14.
Figure 6
Figure 6
The effect of fractional-order α=0.8,0.85,0.9,0.95,1.0 on the infected (Panel a-*), vaccinated (Panel b-*), and recovered (Panel c-*) individuals. Subpanels (*-i) and (*-ii) shows the results of vaccine efficacy η=0.5 and 0.8, respectively, whereas, remaining parameter settings are β=0.8333,γ=0.1,x=0.01,σ=1/4,q=ζ=0.1,ωV=0.0,ωN=0.0,a=0.5 and θ=1/14.
Figure 7
Figure 7
The effect of fractional-order α=0.8,0.85,0.9,0.95,1.0 on the infected (Panel a-*), vaccinated (Panel b-*), and recovered (Panel c-*) individuals. Subpanels (*-i), (*-ii), and (*-iii) shows the results of government force to participate in vaccination program A=0.1,0.5 and 0.9, respectively, whereas the remaining parameter settings are β=0.8333,γ=0.1,x=0.01,σ=1/4,η=0.1,CV=0.9,q=ζ=0.0,ωV=0.0,ωN=0.0,a=0.0,m=0.1 and θ=1/14.
Figure 8
Figure 8
The effect of fractional-order α=0.8,0.85,0.9,0.95,1.0 on the infected (Panel a-*), vaccinated (Panel b-*), and recovered (Panel c-*) individuals. Subpanels (*-i), (*-ii), and (*-iii) shows the results of government force to participate in vaccination program A=0.1,0.5 and 0.9, respectively, whereas the remaining parameter settings are β=0.8333,γ=0.1,x=0.01,σ=1/4,η=0.5,CV=0.5,q=ζ=0.0,ωV=0.0,ωN=0.0,a=0.0,m=0.1 and θ=1/14.
Figure 9
Figure 9
The effect of fractional-order α=0.8,0.85,0.9,0.95,1.0 on the infected (Panel a-*), vaccinated (Panel b-*), and recovered (Panel c-*) individuals. Subpanels (*-i), (*-ii), and (*-iii) shows the results of government force to participate in vaccination program A=0.1,0.5 and 0.9, respectively, whereas the remaining parameter settings are β=0.8333,γ=0.1,x=0.01,σ=1/4,η=0.9,CV=0.1,q=ζ=0.0,ωV=0.0,ωN=0.0,a=0.0,m=0.1 and θ=1/14.
Figure 10
Figure 10
The effect of fractional-order α=0.8,0.85,0.9,0.95,1.0 on the infected (Panel a-*), vaccinated (Panel b-*), and recovered (Panel c-*) individuals. Subpanels (*-i) and (*-ii) show the results of vaccination cost and efficacy (CV,η)=(0,9,0.1) and (0,1,0.9) respectively, whereas, the remaining parameter settings are β=0.8333,γ=0.1,x=0.01,σ=0.25,q=ζ=0.0,ωV=0.0,ωN=0.0,a=0.5,A=0.0,m=0.1 and θ=1/14.
Figure 11
Figure 11
The effect of fractional-order α=0.8,0.85,0.9,0.95,1.0 on the infected (Panel a-*), vaccinated (Panel b-*), and recovered (Panel c-*) individuals. Subpanels (*-i) and (*-ii) show the outcomes of vaccination cost and efficacy (CV,η)=(0,9,0.1) and (0,1,0.9) respectively, whereas, the remaining parameter settings are β=0.8333,γ=0.1,x=0.01,σ=0.25,q=0.1,ζ=0.0,ωV=0.0,ωN=0.0,a=0.0,A=0.0,m=0.1 and θ=1/14.
Figure 12
Figure 12
The effect of fractional-order α=0.8,0.85,0.9,0.95,1.0 on the infected (Panel a-*), vaccinated (Panel b-*), and recovered (Panel c-*) individuals. Subpanels (*-i) and (*-ii) show the results of vaccination cost and efficacy (CV,η)=(0,9,0.1) and (0,1,0.9) respectively, whereas, remaining parameter settings are β=0.8333,γ=0.1,x=0.01,σ=0.25,,q=0.0,ζ=0.1,ωV=0.0,ωN=0.0,a=0.0,A=0.0,m=0.1 and θ=1/14.
Figure 13
Figure 13
The effect of fractional-order α=0.8,0.85,0.9,0.95,1.0 on the infected (Panel a-*), vaccinated (Panel b-*), and recovered (Panel c-*) individuals. Subpanels (*-i) and (*-ii) show the results under the vaccination cost and efficacy (CV,η)=(0,9,0.1) and (0,1,0.9) respectively, whereas, the remaining parameter settings are β=0.8333,γ=0.1,x=0.01,σ=0.25,q=0.1,ζ=0.1,ωV=0.0,ωN=0.0,a=0.0,m=0.1,A=0.0 and θ=1/14.
Figure 14
Figure 14
3D surface showing the effect of fractional order (0α1) and time elapsed on the (A) infected, (B) vaccinated, and (C) recovered population, where parameters used are β=0.8333,γ=0.1,σ=1/4,η=0.5,q=0.0,ζ=0.0,ωV=0.0,ωN=0.0,m=0.1,CV=0.5,η=0.5,A=0.5,a=0.0 and θ=1/14.
Figure 15
Figure 15
3D surface showing the effect of fractional order (0α1) and time elapsed on the (A) infected, (B) vaccinated, and (C) recovered population, where parameters used are β=0.8333,γ=0.1,σ=1/4,η=0.5,q=0.0,ζ=0.0,ωV=0.0,ωN=0.0,m=0.1,CV=0.5,η=0.5,A=0.0,a=0.5 and θ=1/14.
Figure 16
Figure 16
3D surface showing the effect of fractional order (0α1) and time elapsed on the (A) infected, (B) vaccinated, (C) quarantined, and (D) recovered population, where parameters used are β=0.8333,γ=0.1,σ=1/4,η=0.5,q=0.1,ζ=0.0,ωV=0.0,ωN=0.0,m=0.1,CV=0.5,η=0.5,A=0.0,a=0.0 and θ=1/14.
Figure 17
Figure 17
3D surface showing the effect of fractional order (0α1) and time elapsed on the (A) infected, (B) vaccinated, (C) quarantined, and (D) recovered population, where parameters used are β=0.8333,γ=0.1,σ=1/4,η=0.5,q=0.1,ζ=0.0,ωV=0.0,ωN=0.0,m=0.1,CV=0.5,η=0.5,A=0.0,a=0.3, and θ=1/14.
Figure 18
Figure 18
3D surface showing the effect of fractional order (0α1) and time elapsed on the (A) infected, (B) vaccinated, (C) quarantined, and (D) recovered population, where parameters used are β=0.8333,γ=0.1,σ=1/4,η=0.5,q=0.0,ζ=0.1,ωV=0.0,ωN=0.0,m=0.1,CV=0.5,η=0.5,A=0.0,a=0.0, and θ=1/14.
Figure 19
Figure 19
3D surface showing the effect of fractional order (0α1) and time elapsed on the (A) infected, (B) vaccinated, (C) quarantined, and (D) recovered populations, where parameters used are β=0.8333,γ=0.1,σ=1/4,η=0.5,q=0.0,ζ=0.1,ωV=0.0,ωN=0.0,m=0.1,CV=0.5,η=0.5,A=0.0,a=0.3, and θ=1/14.
Figure 20
Figure 20
3D surface showing the effect of fractional order (0α1) and time elapsed on the (A) infected, (B) vaccinated, (C) quarantined, and (D) recovered population, where parameters used are β=0.8333,γ=0.1,σ=1/4,η=0.5,q=0.05,ζ=0.05,ωV=0.0,ωN=0.0,m=0.1,CV=0.5,η=0.5,A=0.3,a=0.3, and θ=1/14.
Figure 21
Figure 21
The phase-portrayed fractional order (α=0.8,0.85,0.9,0.95,1.0) trajectories of infected (I(t)) individuals concerning the waning rate of natural ωN and artificial (ωV) immunity. Subpanels (a*), (b*), and (c*) show the naturally achieved immunity waning rate ωN=0.0,0.05,0.1, whereas (*i), (*ii), (*iii) artificial immunity waning rate (ωV=0.0,0.05,0.1), respectively. The remaining parameters settings are β=0.8333,γ=0.1,σ=1/4,q=0.1,ζ=0.1,m=0.1,CV=0.9,η=0.1,A=0.0,a=0.0, and θ=1/14.
Figure 22
Figure 22
The phase-portrayed fractional order (α=0.8,0.85,0.9,0.95,1.0) trajectories of vaccinated (V(t)) individuals concerning the waning rate of natural ωN and artificial (ωV) immunity. Subpanels (a*), (b*), and (c*) show the naturally achieved immunity waning rate ωN=0.0,0.05,0.1, whereas (*i), (*ii), (*iii) artificial immunity waning rate (ωV=0.0,0.05,0.1), respectively. The remaining parameters settings are β=0.8333,γ=0.1,σ=1/4,q=0.1,ζ=0.1,m=0.1,CV=0.9,η=0.1,A=0.0,a=0.0, and θ=1/14.
Figure 23
Figure 23
The phase-portrayed fractional order (α=0.8,0.85,0.9,0.95,1.0) trajectories of quarantined and isolated (J(t)) individuals concerning the waning rate of natural ωN and artificial (ωV) immunity. Subpanels (a*), (b*), and (c*) show the naturally achieved immunity waning rate ωN=0.0,0.05,0.1, whereas (*i), (*ii), (*iii) artificial immunity waning rate (ωV=0.0,0.05,0.1), respectively. The remaining parameters settings are β=0.8333,γ=0.1,σ=1/4,q=0.1,ζ=0.1,m=0.1,CV=0.9,η=0.1,A=0.0,a=0.0, and θ=1/14.
Figure 24
Figure 24
The phase-portrayed fractional order (α=0.8,0.85,0.9,0.95,1.0) trajectories of recovered (R(t)) individuals concerning the waning rate of natural ωN and artificial (ωV) immunity. Subpanels (a*), (b*), and (c*) show the naturally achieved immunity waning rate ωN=0.0,0.05,0.1, whereas (*i), (*ii), (*iii) artificial immunity waning rate (ωV=0.0,0.05,0.1), respectively. The remaining parameters settings are β=0.8333,γ=0.1,σ=1/4,q=0.1,ζ=0.1,m=0.1,CV=0.9,η=0.1,A=0.0,a=0.0, and θ=1/14.
Figure 25
Figure 25
The phase-portrayed fractional order (α=0.8,0.85,0.9,0.95,1.0) trajectories of infected (I(t)) individuals concerning the waning rate of natural ωN and artificial (ωV) immunity. Subpanels (a*), (b*), and (c*) show the naturally achieved immunity waning rate ωN=0.0,0.05,0.1, whereas (*i), (*ii), (*iii) artificial immunity waning rate (ωV=0.0,0.05,0.1), respectively. The remaining parameters settings are β=0.8333,γ=0.1,σ=1/4,q=0.1,ζ=0.1,m=0.1,CV=0.5,η=0.5,A=0.0,a=0.0, and θ=1/14.
Figure 26
Figure 26
The phase-portrayed fractional order (α=0.8,0.85,0.9,0.95,1.0) trajectories of vaccinated (V(t)) individuals concerning the waning rate of natural ωN and artificial (ωV) immunity. Subpanels (a*), (b*), and (c*) show the naturally achieved immunity waning rate ωN=0.0,0.05,0.1, whereas (*i), (*ii), (*iii) artificial immunity waning rate (ωV=0.0,0.05,0.1), respectively. The remaining parameters settings are β=0.8333,γ=0.1,σ=1/4,q=0.1,ζ=0.1,m=0.1,CV=0.5,η=0.5,A=0.0,a=0.0, and θ=1/14.
Figure 27
Figure 27
The phase-portrayed fractional order (α=0.8,0.85,0.9,0.95,1.0) trajectories of quarantined and Isolated (J(t)) individuals concerning the waning rate of natural ωN and artificial (ωV) immunity. Subpanels (a*), (b*), and (c*) show the naturally achieved immunity waning rate ωN=0.0,0.05,0.1, whereas (*i), (*ii), (*iii) artificial immunity waning rate (ωV=0.0,0.05,0.1), respectively. The remaining parameters settings are β=0.8333,γ=0.1,σ=1/4,q=0.1,ζ=0.1,m=0.1,CV=0.5,η=0.5,A=0.0,a=0.0, and θ=1/14.
Figure 28
Figure 28
The phase-portrayed fractional order (α=0.8,0.85,0.9,0.95,1.0) trajectories of recovered (R(t)) individuals concerning the waning rate of natural ωN and artificial (ωV) immunity. Subpanels (a*), (b*), and (c*) show the naturally achieved immunity waning rate ωN=0.0,0.05,0.1, whereas (*i), (*ii), (*iii) artificial immunity waning rate (ωV=0.0,0.05,0.1), respectively. The remaining parameters settings are β=0.8333,γ=0.1,σ=1/4,q=0.1,ζ=0.1,m=0.1,CV=0.5,η=0.5,A=0.0,a=0.0, and θ=1/14.
Figure 29
Figure 29
The phase-portrayed fractional order (α=0.8,0.85,0.9,0.95,1.0) trajectories of infected (I(t)) individuals concerning the waning rate of natural ωN and artificial (ωV) immunity. Subpanels (a*), (b*), and (c*) show the naturally achieved immunity waning rate ωN=0.0,0.05,0.1, whereas (*i), (*ii), (*iii) artificial immunity waning rate (ωV=0.0,0.05,0.1), respectively. The remaining parameters settings are β=0.8333,γ=0.1,σ=1/4,q=0.1,ζ=0.1,m=0.1,CV=0.1,η=0.9,A=0.0,a=0.0, and θ=1/14.
Figure 30
Figure 30
The phase-portrayed fractional order (α=0.8,0.85,0.9,0.95,1.0) trajectories of vaaccinated (V(t)) individuals concerning the waning rate of natural ωN and artificial (ωV) immunity. Subpanels (a*), (b*), and (c*) show the naturally achieved immunity waning rate ωN=0.0,0.05,0.1, whereas (*i), (*ii), (*iii) artificial immunity waning rate (ωV=0.0,0.05,0.1), respectively. The remaining parameters settings are β=0.8333,γ=0.1,σ=1/4,q=0.1,ζ=0.1,m=0.1,CV=0.1,η=0.9,A=0.0,a=0.0, and θ=1/14.
Figure 31
Figure 31
The phase-portrayed fractional order (α=0.8,0.85,0.9,0.95,1.0) trajectories of quarantined and isolated (J(t)) individuals concerning the waning rate of natural ωN and artificial (ωV) immunity. Subpanels (a*), (b*), and (c*) show the naturally achieved immunity waning rate ωN=0.0,0.05,0.1, whereas (*i), (*ii), (*iii) artificial immunity waning rate (ωV=0.0,0.05,0.1), respectively. The remaining parameters settings are β=0.8333,γ=0.1,σ=1/4,q=0.1,ζ=0.1,m=0.1,CV=0.1,η=0.9,A=0.0,a=0.0, and θ=1/14.
Figure 32
Figure 32
The phase-portrayed fractional order (α=0.8,0.85,0.9,0.95,1.0) trajectories of recovered (R(t)) individuals concerning the waning rate of natural ωN and artificial (ωV) immunity. Subpanels (a*), (b*), and (c*) show the naturally achieved immunity waning rate ωN=0.0,0.05,0.1, whereas (*i), (*ii), (*iii) artificial immunity waning rate (ωV=0.0,0.05,0.1), respectively. The remaining parameters settings are β=0.8333,γ=0.1,σ=1/4,q=0.1,ζ=0.1,m=0.1,CV=0.1,η=0.9,A=0.0,a=0.0, and θ=1/14.

Similar articles

Cited by

References

    1. Chatterjee, P. et al. The 2019 novel coronavirus disease (COVID-19) pandemic: A review of the current evidence. Indian J. Med. Res.151(2), 147. 10.4103/ijmr.ijmr_519_20 (2020). - PMC - PubMed
    1. Ullah, M. S., Higazy, M. & Ariful Kabir, K. Modeling the epidemic control measures in overcoming COVID-19 outbreaks: A fractional-order derivative approach. Chaos Solitons Fractals155, 111636. 10.1016/j.chaos.2021.111636 (2022). - PMC - PubMed
    1. Ullah, M. S., Higazy, M. & Kabir, K. A. Dynamic analysis of mean-field and fractional-order epidemic vaccination strategies by evolutionary game approach. Chaos Solitons Fractals162, 112431. 10.1016/j.chaos.2022.112431 (2022).
    1. Higazy, M., Allehiany, F. & Mahmoud, E. E. Numerical study of fractional order COVID-19 pandemic transmission model in the context of ABO blood group. Results Phys.22, 103852. 10.1016/j.rinp.2021.103852 (2021). - PMC - PubMed
    1. Khan, M. A., Meetei, M. Z., Shah, K., Abdeljawad, T. & Alshahrani, M. Y. Modeling the monkeypox infection using the Mittag–Leffler kernel. Open Phys.10.1515/phys-2023-0111 (2023).

LinkOut - more resources