. 2024 Jun 24;14(1):14490.
doi: 10.1038/s41598-024-65367-9.

Deep learning models for predicting the survival of patients with medulloblastoma based on a surveillance, epidemiology, and end results analysis

Affiliations

Deep learning models for predicting the survival of patients with medulloblastoma based on a surveillance, epidemiology, and end results analysis

Meng Sun et al. Sci Rep. .

Abstract

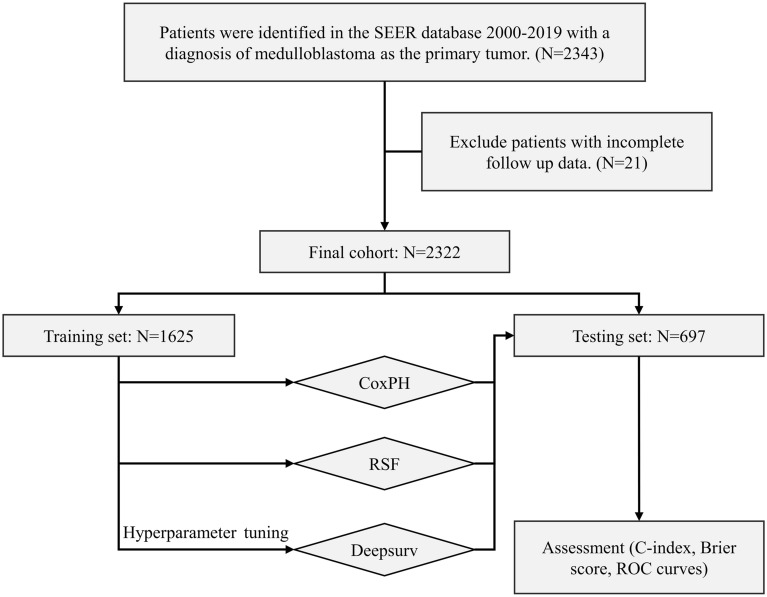
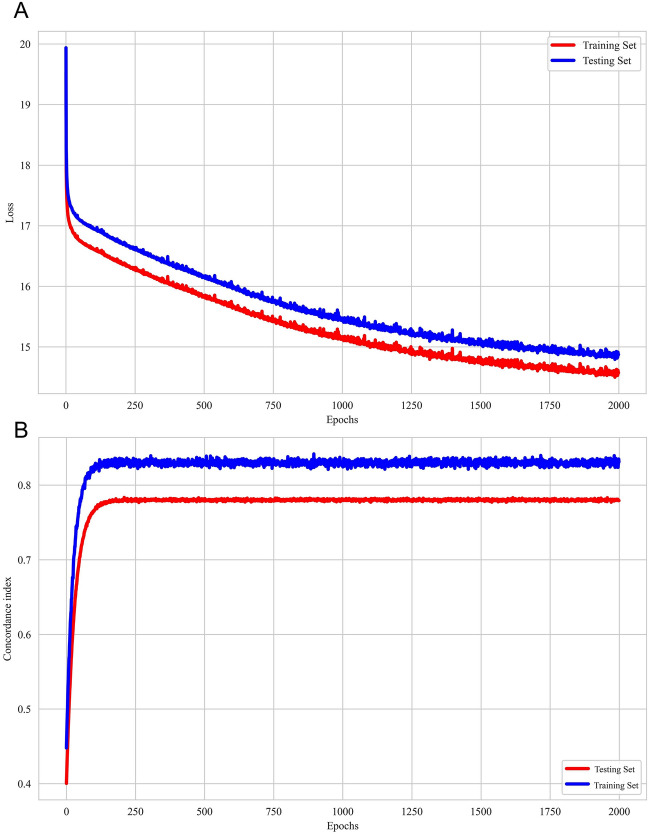
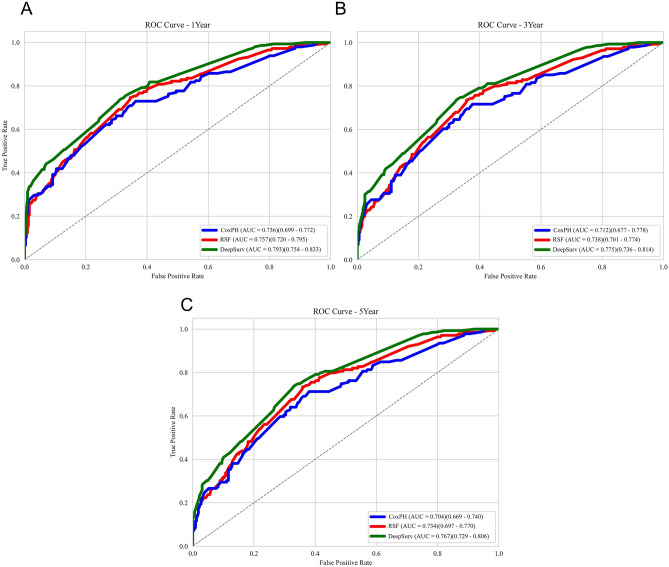
Medulloblastoma is a malignant neuroepithelial tumor of the central nervous system. Accurate prediction of prognosis is essential for therapeutic decisions in medulloblastoma patients. We analyzed data from 2,322 medulloblastoma patients using the SEER database and randomly divided the dataset into training and testing datasets in a 7:3 ratio. We chose three models to build, one based on neural networks (DeepSurv), one based on ensemble learning that Random Survival Forest (RSF), and a typical Cox Proportional-hazards (CoxPH) model. The DeepSurv model outperformed the RSF and classic CoxPH models with C-indexes of 0.751 and 0.763 for the training and test datasets. Additionally, the DeepSurv model showed better accuracy in predicting 1-, 3-, and 5-year survival rates (AUC: 0.767-0.793). Therefore, our prediction model based on deep learning algorithms can more accurately predict the survival rate and survival period of medulloblastoma compared to other models.

Keywords: DeepSurv; Medulloblastoma; Neural network; SEER; Survival prediction.


Conflict of interest statement

The authors declare no competing interests.

Figures

Figure 1
Figure 1
Study profile and analysis pipeline. Patients with a diagnosis of medulloblastoma as primary tumor in the SEER database 2000–2019 with complete follow-up data. The entire dataset was divided 7:3 into training (n = 1,625) and test (n = 697) sets. The CoxPH and RSF models were constructed directly from the training set data. When constructing the Deepsurv model, we used grid search and fivefold cross-validation for hyperparameter tuning on the training dataset. Finally, the performance of the models was evaluated in the testing set (n = 697) using several metrics.
Figure 2
Figure 2
The X-tile analysis was conducted to determine the best cutoff points for the variables of age and tumor size. (A) X-tile plot of training sets in age. (B) The cutoff point highlighted using a histogram of the entire cohort. (C) Kaplan–Meier plot showing the distinct prognosis determined by the cutoff point. (D) X-tile plot of training sets in tumor size. (E) The cutoff point highlighted using a histogram. (F) Kaplan–Meier plot showing the prognosis determined by the cutoff point. The low subset is depicted in gray, while the high subset is shown in blue.
Figure 3
Figure 3
Univariate & Multivariable CoxPH analyses. Variables are sorted in descending order of hazard ratio (HR). Red represents a value above 1, while blue represents a value below 1. *p < 0.05, **p < 0.01, ***p < 0.001.
Figure 4
Figure 4
Random survival forest model. 8 features were used to construct the model: sex, age, radiotherapy, chemotherapy, histopathology, race, surgery, tumor size. (A) Out-of-bag (OOB) error rate. (B) Predicted survival curves generated for testing set. (C) Variable importance plot. Higher values of Variable Importance (VIMP) indicate the variable contributes more to predictive accuracy of the model. (D) Variable interaction plot. Lower values indicate a higher level of interactivity between the variables.
Figure 5
Figure 5
The training and testing history of DeepSurv. (A) A plot of loss on the training and testing sets. The error gradually decreases over each iteration during training. (B) A plot of the concordance index obtained by the model in the train and test sets as a function of the epochs. It is neither fitting the training data too well nor failing to capture important patterns in the data.
Figure 6
Figure 6
The receiver operating characteristic (ROC) curves for 1-year, 3-year, and 5-year survival predictions.

References

    1. Gajjar AJ, Robinson GW. Medulloblastoma-translating discoveries from the bench to the bedside. Nat. Rev. Clin. Oncol. 2014;11:714–722. doi: 10.1038/nrclinonc.2014.181. - DOI - PubMed
    1. Ostrom QT, Cioffi G, Waite K, Kruchko C, Barnholtz-Sloan JS. CBTRUS statistical report: Primary brain and other central nervous system tumors diagnosed in the United States in 2014–2018. Neuro. Oncol. 2021 doi: 10.1093/neuonc/noab200. - DOI - PMC - PubMed
    1. Taylor MD, et al. Molecular subgroups of medulloblastoma: The current consensus. Acta Neuropathol. 2012;123:465–472. doi: 10.1007/s00401-011-0922-z. - DOI - PMC - PubMed
    1. Ramaswamy V, Taylor MD. Medulloblastoma: From myth to molecular. J. Clin. Oncol. 2017;35:2355–2363. doi: 10.1200/JCO.2017.72.7842. - DOI - PubMed
    1. Zhou L, et al. Automatic image segmentation and online survival prediction model of medulloblastoma based on machine learning. Eur. Radiol. 2023 doi: 10.1007/s00330-023-10316-9. - DOI - PubMed