. 2024 Aug;38(8):1731-1741.
doi: 10.1038/s41375-024-02296-6. Epub 2024 Jun 24.

Amino acid influx via LAT1 regulates iron demand and sensitivity to PPMX-T003 of aggressive natural killer cell leukemia

Affiliations

Amino acid influx via LAT1 regulates iron demand and sensitivity to PPMX-T003 of aggressive natural killer cell leukemia

Ryo Yanagiya et al. Leukemia. 2024 Aug.

Abstract

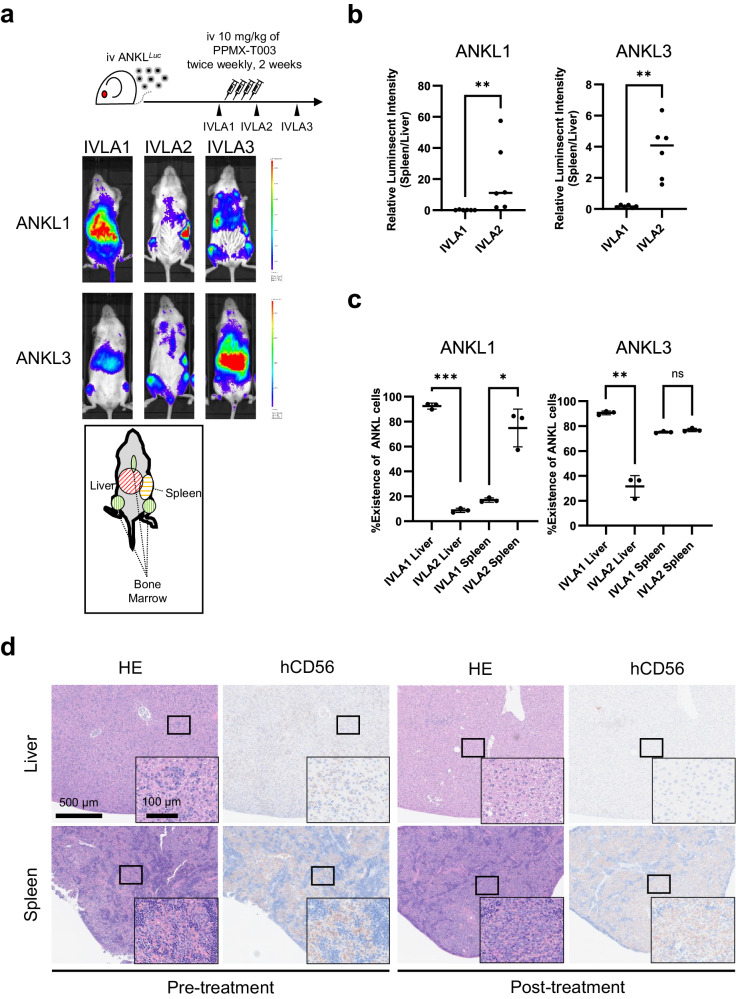
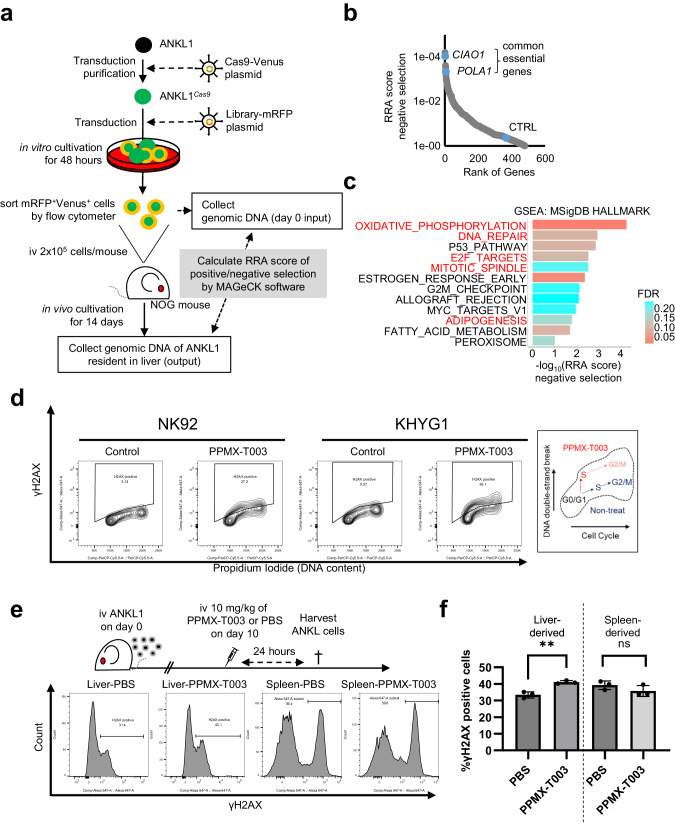
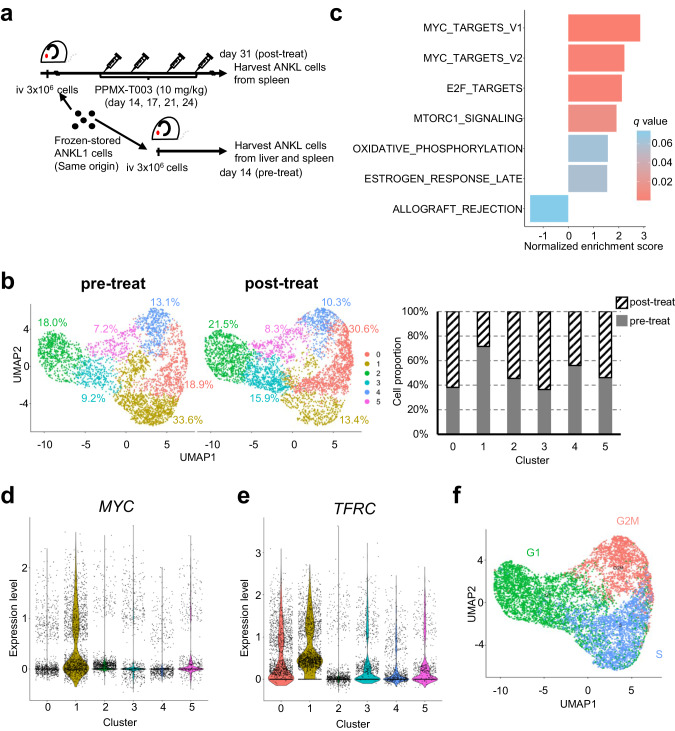
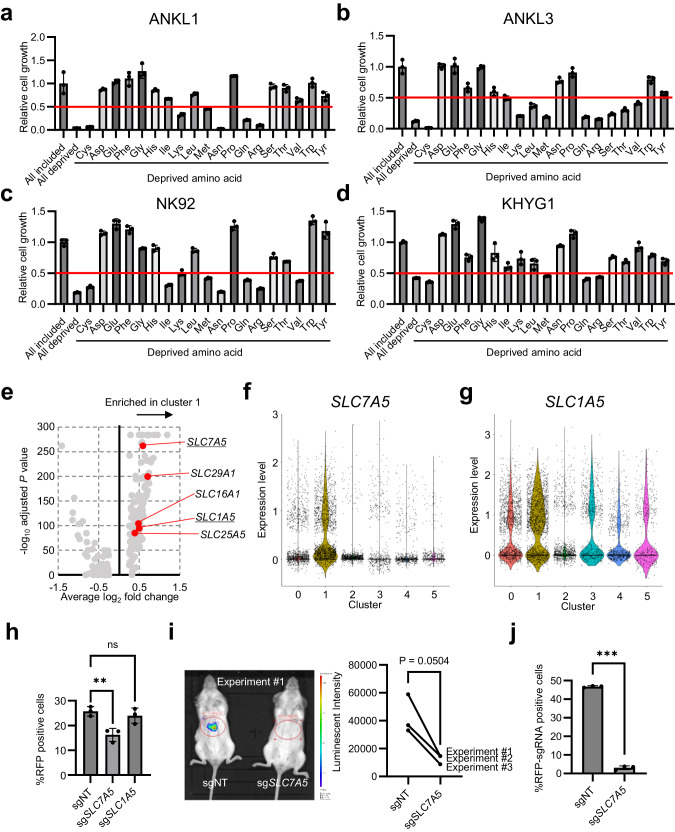
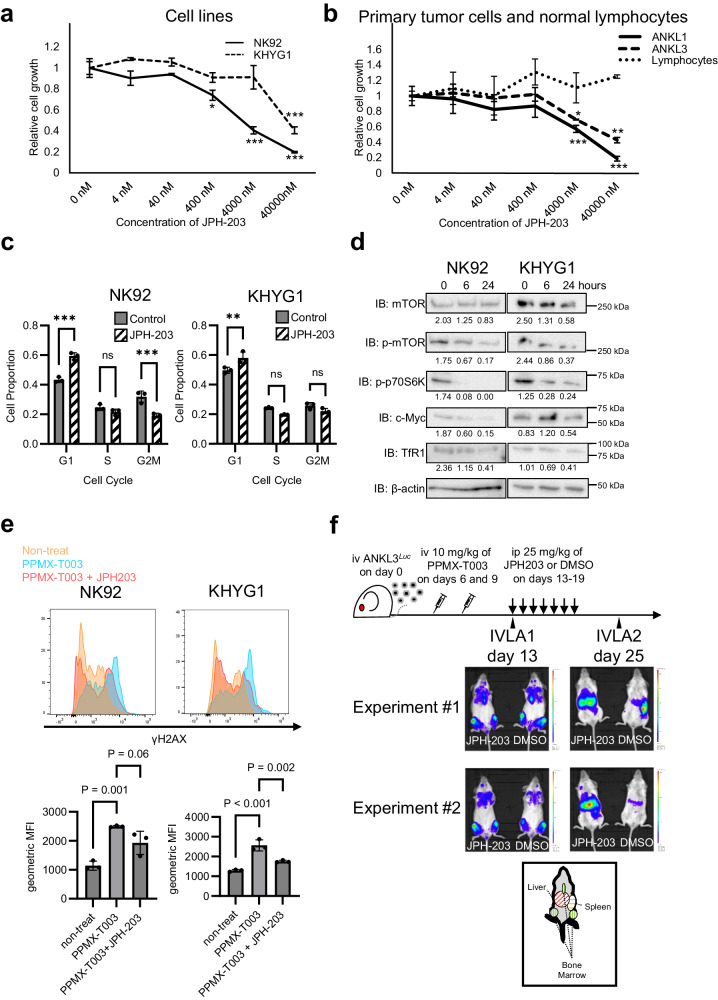
Aggressive natural killer cell leukemia (ANKL) is a rare hematological malignancy with a fulminant clinical course. Our previous study revealed that ANKL cells proliferate predominantly in the liver sinusoids and strongly depend on transferrin supplementation. In addition, we demonstrated that liver-resident ANKL cells are sensitive to PPMX-T003, an anti-human transferrin receptor 1 inhibitory antibody, whereas spleen-resident ANKL cells are resistant to transferrin receptor 1 inhibition. However, the microenvironmental factors that regulate the iron dependency of ANKL cells remain unclear. In this study, we first revealed that the anti-neoplastic effect of PPMX-T003 was characterized by DNA double-strand breaks in a DNA replication-dependent manner, similar to conventional cytotoxic agents. We also found that the influx of extracellular amino acids via LAT1 stimulated sensitivity to PPMX-T003. Taken together, we discovered that the amount of extracellular amino acid influx through LAT1 was the key environmental factor determining the iron dependency of ANKL cells via adjustment of their mTOR/Myc activity, which provides a good explanation for the different sensitivity to PPMX-T003 between liver- and spleen-resident ANKL cells, as the liver sinusoid contains abundant amino acids absorbed from the gut.


Conflict of interest statement

TM was a chief technology officer and an executive officer, and KI was a research manager of Perseus Proteomics Inc. Both has stock options. The authors do not have any other conflict of interest to be disclosed.

Figures

Fig. 1
Fig. 1. ANKL cells in the spleen and bone marrow were resistant to treatment with an anti-TfR1 antibody, PPMX-T003.
a In vivo luciferase assay (IVLA) of pre- (IVLA1), early after- (IVLA2), and late after- (IVLA3) treatment of two ANKL-PDXs (ANKL1-PDX and ANKL3-PDX) with PPMX-T003 as previously reported [8]. b Relative luminescent intensities of the spleen compared with the liver of six ANKL1-PDXs and six ANKL3-PDXs at the time of IVLA1 and IVLA2 in (a). Setting of the regions of interest was shown in Supplementary Fig. S1. c Proportion of human CD45-positive cells (i.e., ANKL cells) of liver- and spleen-derived cell suspension of ANKL1- and ANKL3-PDXs at IVLA1 and IVLA2. Hepatocytes were excluded by density gradient centrifugation, and proportions were measured using flow cytometer (see Supplementary Fig. 1b). Three mice per stage per lineage were analyzed. d Hematoxylin and eosin (HE) staining and immunohistochemistry with an anti-human CD56 antibody of the liver and spleen derived from pre- and post-treated ANKL1-PDX. Squares in pictures of low-powered fields indicate the place of high-powered fields.
Fig. 2
Fig. 2. PPMX-T003 caused DNA double-strand breaks to S-phase ANKL cells, similar to conventional cytotoxic agents.
a A schema of in vivo CRISPR screening targeting iron-require molecules. The procedure was independently performed three times, and three mice (Mouse #1, Mouse #2, and Mouse #3) were analyzed. b Negative selection-Robust Ranking Algorithm (RRA) scores of all genes of Mouse #1. The blue dots indicate the RRA value of sgRNAs targeting CIAO1and POLA1, and control (non-target) sgRNA (CTRL). c All annotated gene sets targeted by negatively selected sgRNAs in Mouse #1 using GSEA. Color value and red characters indicate the false-discovery ratio (FDR) and five commonly annotated gene sets in all the three mice (Mouse #1, #2, and #3; see Supplementary Fig. S2c, d). d Flow cytometric analyses of NK92 and KHYG1 exposed to PPMX-T003. Cells were cultured for 24 h with or without 10 µg/mL of PPMX-T003 before analyses. Relationships of cell cycle (DNA content) and DNA damage were plotted. e, f Flow cytometric analyses of liver- and spleen-derived ANKL1 cells of PBS- or PPMX-T003-treated ANKL1-PDXs. Total of three mice per treatment group were analyzed.
Fig. 3
Fig. 3. PPMX-T003-sensitive ANKL cells were characterized by higher activity of the mTORC1/Myc/TfR1 axis.
a A schema of sample preparation for single-cell whole-transcriptome analysis. b Unsupervised clustering (UMAP) of analyzed ANKL1 cells. The bar graph indicates the cell populations of each cluster. c GSEA of feature genes in cluster 1. All annotated gene sets in HALLMARK of MSigDB with adjusted p-values lower than 0.25 were described. MYC (d) and TFRC (e) expression profiles of all the analyzed spleen-derived cells per cluster. Color consistency represents the amount of expression in each cell type. f Results of cell cycle scoring analysis of all the analyzed spleen-derived cells (left) and its schema describing cell cycle transition (right).
Fig. 4
Fig. 4. LAT1-mediated amino acid influx positively regulates ANKL cell proliferation.
ad In vitro cell proliferation assay of liver-derived ANKL cells and ANKL-derived cell lines cultured in single amino acid-deprived RPMI 1640. Each bar indicates the relative proliferation value to all amino acid-included conditions. The red line indicates a relative proliferation value of 0.5, a cut-off of these assays. Total of three samples per treatment group were analyzed. e Volcano plot of feature genes of cluster 1 of single-cell whole-transcriptome analysis described in Fig. 3, compared with other clusters. Red dots and underbars indicate SLC family genes and genes encoding amino acid transporter, respectively. fg Violin plots of SLC7A5 (h) and SLC1A5 (i) of single-cell whole-transcriptome analysis described in Fig. 3. h In vitro competitive proliferation assay of transduced Cas9-overexpressed NK92 cells with sgRNA-RFP plasmids by lentiviral vector. Proportions of RFP-positive cells (i.e., target gene-knocked-out cells) were measured using flow cytometry two and eight days after lentiviral transduction. %RFP-positive cells is determined by dividing the number of RFP-positive cells of day 8 by those of day 2. Total of three samples per treatment group were analyzed. i In vivo luciferase assay of ANKL3-PDXs established with Cas9-overexpressed ANKL3 cells transduced with sgNT- or sgSLC7A5-RFP plasmids. Assays were performed seven days after ANKL3 cell inoculation. Luminescent intensities of liver regions were measured. Experiments were independently performed three times, and statistical value was calculated using paired t-test. j Proportions of RFP-positive cells (i.e., target gene-knocked out cells) of liver-derived ANKL3 cells at the timing of in vivo luciferase assay in (h), measured using flow cytometry.
Fig. 5
Fig. 5. Amino acid influx via LAT1 is essential to the therapeutic efficacy of PPMX-T003 through positive regulation of mTOR/Myc activity.
Proliferation assay of ANKL-derived cell lines (a), liver-derived ANKL-PDX cells (b), and normal lymphocytes derived from peripheral blood of healthy volunteer (b) treated with various concentrations of JPH-203 for 48 h (a) or 24 h (b). Total of three samples per treatment group were analyzed. c Cell cycle assays of JPH-203-treated NK92 and KHYG1 cells. After cultivation with 40 µM JPH-203 for 24 h, cell cycle proportions were measured using flow cytometry. Total of three samples per treatment group were analyzed. d Western blot analysis of JPH-203-treated NK92 and KHYG1 cells. After cultivation with 40 µM of JPH-203 for 0, 6, or 24 h, the relative luminescent intensities of each band compared with those of β-actin were calculated and described under the band. e Cellular γH2AX expression value of NK92 and KHYG1 cells cultured with or without 40 µM of JPH-203 and/or 10 µg/mL of PPMX-T003 for 24 h, measured using flow cytometry. Total of three samples per treatment group were analyzed. f In vivo luciferase assay for ANKL3-PDXs treated with PPMX-T003 and DMSO or JPH-203 sequentially.

References

    1. Swerdlow SH, Campo E, Pileri SA, Harris NL, Stein H, Siebert R, et al. The 2016 revision of the World Health Organization classification of lymphoid neoplasms. Blood. 2016;127:2375–90. 10.1182/blood-2016-01-643569 - DOI - PMC - PubMed
    1. Tang YT, Wang D, Luo H, Xiao M, Zhou HS, Liu D, et al. Aggressive NK-cell leukemia: clinical subtypes, molecular features, and treatment outcomes. Blood Cancer J. 2017;7:660. 10.1038/s41408-017-0021-z - DOI - PMC - PubMed
    1. Fujimoto A, Ishida F, Izutsu K, Yamasaki S, Chihara D, Suzumiya J, et al. Allogeneic stem cell transplantation for patients with aggressive NK-cell leukemia. Bone Marrow Transpl. 2021;56:347–56.10.1038/s41409-020-01009-8 - DOI - PubMed
    1. Suzuki R, Suzumiya J, Nakamura S, Aoki S, Notoya A, Ozaki S, et al. Aggressive natural killer-cell leukemia revisited: large granular lymphocyte leukemia of cytotoxic NK cells. Leukemia. 2004;18:763–70. 10.1038/sj.leu.2403262 - DOI - PubMed
    1. Huang L, Liu D, Wang N, Ling S, Tang Y, Wu J, et al. Integrated genomic analysis identifies deregulated JAK/STAT-MYC-biosynthesis axis in aggressive NK-cell leukemia. Cell Res. 2018;28:172–86. 10.1038/cr.2017.146 - DOI - PMC - PubMed