. 2024 Oct;46(5):4743-4760.
doi: 10.1007/s11357-024-01210-3. Epub 2024 Jun 25.

Longitudinal detection of gait alterations associated with hypertension-induced cerebral microhemorrhages in mice: predictive role of stride length and stride time asymmetry and increased gait entropy

Affiliations

Longitudinal detection of gait alterations associated with hypertension-induced cerebral microhemorrhages in mice: predictive role of stride length and stride time asymmetry and increased gait entropy

Zoltan Ungvari et al. Geroscience. 2024 Oct.

Abstract

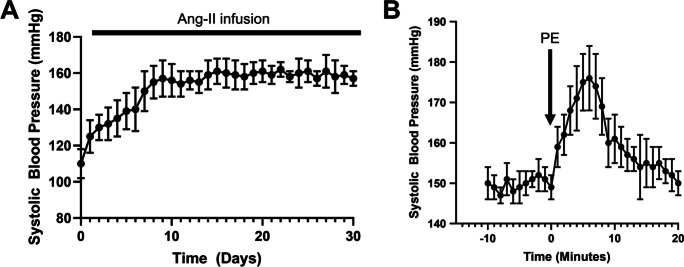
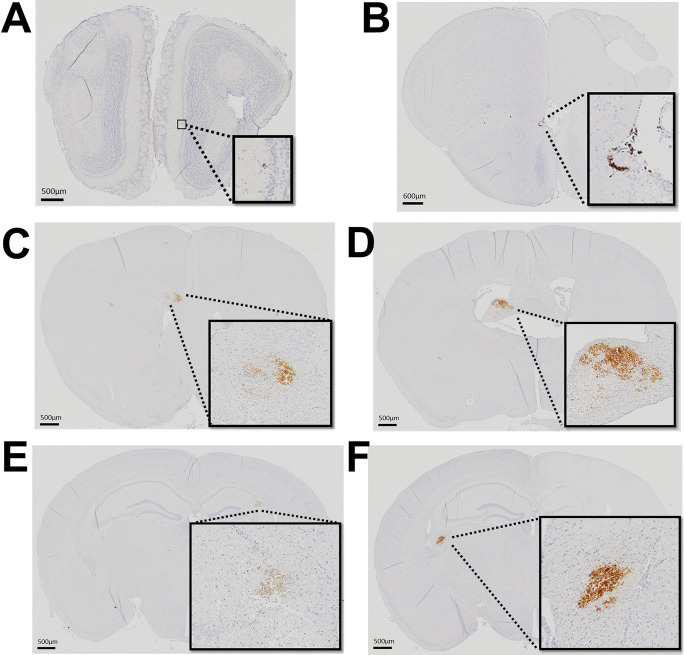
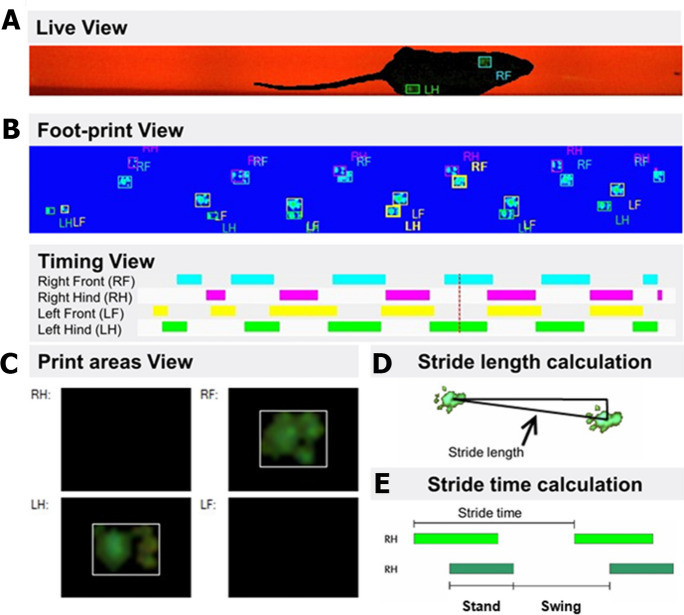
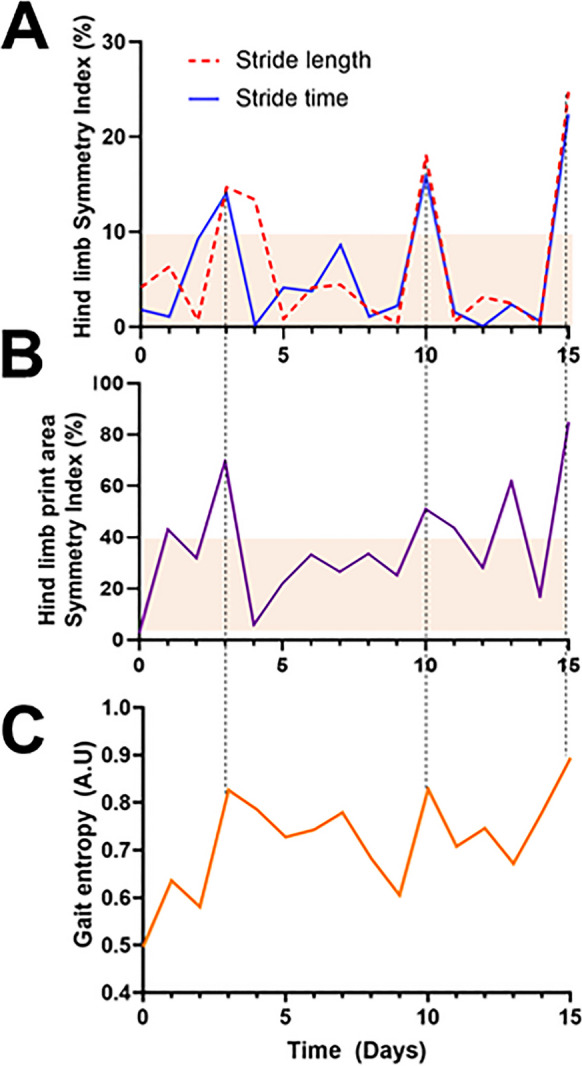
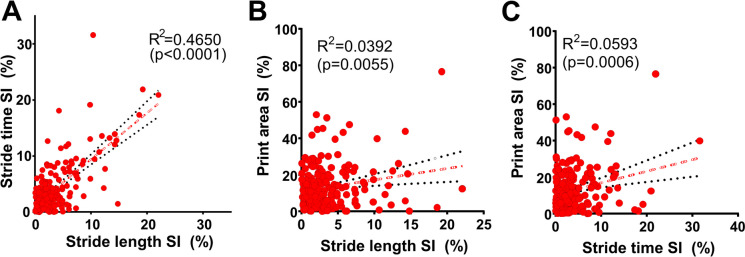
Cerebral microhemorrhages (CMHs) are of paramount importance as they not only signify underlying vascular pathology but also have profound implications for cognitive function and neurological health, serving as a critical indicator for the early detection and management of vascular cognitive impairment (VCI). This study aimed to investigate the effects of hypertension-induced CMHs on gait dynamics in a mouse model, focusing on the utility of advanced gait metrics as sensitive indicators of subclinical neurological alterations associated with CMHs. To induce CMHs, we employed a hypertensive mouse model, using a combination of Angiotensin II and L-NAME to elevate blood pressure, further supplemented with phenylephrine to mimic transient blood pressure fluctuations. Gait dynamics were analyzed using the CatWalk system, with emphasis on symmetry indices for Stride Length (SL), Stride Time (ST), and paw print area, as well as measures of gait entropy and regularity. The study spanned a 30-day experimental period, capturing day-to-day variations in gait parameters to assess the impact of CMHs. Temporary surges in gait asymmetry, detected as deviations from median gait metrics, suggested the occurrence of subclinical neurological signs associated with approximately 50% of all histologically verified CMHs. Our findings also demonstrated that increases in gait entropy correlated with periods of increased gait asymmetry, providing insights into the complexity of gait dynamics in response to CMHs. Significant correlations were found between SL and ST symmetry indices and between these indices and the paw print area symmetry index post-hypertension induction, indicating the interdependence of spatial and temporal aspects of gait affected by CMHs. Collectively, advanced gait metrics revealed sensitive, dynamic alterations in gait regulation associated with CMHs, resembling the temporal characteristics of transient ischemic attacks (TIAs). This underscores their potential as non-invasive indicators of subclinical neurological impacts. This study supports the use of detailed gait analysis as a valuable tool for detecting subtle neurological changes, with implications for the early diagnosis and monitoring of cerebral small vessel disease (CSVD) in clinical settings.

Keywords: Aging; Balance; Gait coordination; Intra-cerebral hemorrhage; Microbleed; Motor performance; Neurodegeneration; Small vessel disease.


Conflict of interest statement

Dr. Anna Csiszar serves as Associate Editor for The Journal of Gerontology, Series A: Biological Sciences and Medical Sciences and GeroScience. Dr. Zoltan Ungvari serves as Editor-in-Chief for GeroScience and has personal relationships with individuals involved in the submission of this paper. Dr. Stefano Tarantini, Dr. Shannon Conley, Dr. Peter Mukli, Dr. Peter Toth and Dr. Andriy Yabluchanskiy serve as Associate Editors for GeroScience.

The authors declare no competing financial interests.

Figures

Fig. 1
Fig. 1
Monitoring of systolic blood pressure in a model of hypertension-induced genesis of cerebral microhemorrhages. A Treatment with angiotensin II plus L‐NAME elicited an increase in systolic blood pressure during the 30-day experimental timeline. B Acute systolic blood pressure spikes were obtained by subcutaneous injection of phenylephrine (PE). Data are mean ± SEM, n = 20
Fig. 2
Fig. 2
Distribution of cerebral microhemorrhages in the brain of a hypertensive mouse. AF Representative diaminobenzidine-stained images showcasing cerebral microhemorrhages within various regions of the cortex in a hypertensive mouse. Brightfield microscopy was utilized to capture the CMHs, employing both 10 × and 4 × objectives to detail their extensive distribution across the brain. Panels A and B depict small bleeds located in the olfactory bulb, Panels C and D show CMHs within the white matter, in corpus callosum (C) and fimbria of the hippocampus (D). Panel E features a CMH in the right hippocampus, a region critical for memory and spatial navigation, indicating the potential impact on cognitive functions. Panel F presents a CMH within the white matter of the left hemisphere, underscoring the vulnerability of both grey and white matter to hypertension-induced hemorrhagic damage. Images from panels A-E highlight the widespread nature of hemorrhagic events across different functional areas of the brain. This brain is from the same mouse whose altered gait patterns following hypertension induction are depicted in Fig. 4, linking structural brain changes with functional locomotor deficits
Fig. 3
Fig. 3
Gait analysis in mice utilizing the CatWalk system. A Footprint view illustrating the placement of paws on the glass walkway, crucial for assessing spatial gait patterns. B Timing view depicting the duration of each paw’s contact with the glass, instrumental for analyzing footfall patterns and the calculation of the regularity index. C Print areas, highlighting the spatial dimensions of paw contacts. D Calculation of stride length, detailing the measurement of distance between successive placements of the same paw. E Calculation of stride time, indicating the time elapsed between consecutive paw contacts
Fig. 4
Fig. 4
Temporal dynamics of gait alterations following hypertension induction in mice. A Day-to-day variations in hind limb stride length and stride time symmetry indices after hypertension induction, highlighting temporary surges in interlimb gait asymmetry lasting 1–2 days. This analysis corresponds to the same mouse whose brain, exhibiting cerebral microhemorrhages, is presented in Fig. 2. B Day-to-day fluctuations in the hind limb paw print area symmetry index following hypertension induction, illustrating periods of print area asymmetry that coincide with the surges observed in SL and ST asymmetry. C Day-to-day changes in gait entropy following hypertension induction, with evident increases corresponding to periods of increased gait asymmetry, providing insights into the temporal dynamics of CMH-induced subclinical neurological symptoms
Fig. 5
Fig. 5
Correlations between gait symmetry indices in hypertensive mice. Shown are the interrelationships among various gait symmetry indices in mice following hypertension induction, capturing each time point throughout the 30-day experimental period for each mouse (n = 20). A) Correlation between stride time symmetry index and stride length symmetry index post-hypertension, highlighting the strongest correlation observed among the indices. This strong correlation underscores the interdependence of temporal and spatial aspects of gait symmetry affected by CMHs. B) Correlation between the paw print area symmetry index and SL symmetry index in mice post-hypertension, illustrating how changes in the spatial domain of gait (SL and print area) are interrelated following hypertension induction. C) Correlation between the paw print area symmetry index and ST symmetry index post-hypertension induction, demonstrating the relationship between the spatial domain of print area and the temporal aspect of gait (ST), further emphasizing the comprehensive impact of CMHs on gait dynamics. Each panel provides insight into how CMHs affect the interplay of different gait parameters, with each point representing a day in the life of the hypertensive mice, reflecting the dynamic nature of gait alterations over the course of the experimental period
Fig. 6
Fig. 6
Neurological signs and gait dynamics following hypertension induction in mice. This figure provides a comprehensive overview of the progression of neurological signs and alterations in gait dynamics in response to hypertension-induced cerebral microhemorrhages in a cohort of 20 mice. A) The panel illustrates cumulative incidence curves for neurological signs of hypertension-induced CMHs, focusing on temporal surges (“spikes”) in gait asymmetry measured by the stride length (SL) symmetry index (SI), stride time (ST) SI, and print area (PA) SI, alongside the time-to-change curve for alterations in neuroscore. It is observed that detectable surges in SI for SL and ST precede those observed in the SI (PA), indicating that SL and ST indices are the most sensitive indicators for the detection of CMHs. Detection of changes in neuroscore demonstrated the least sensitivity, marking it as a less immediate indicator of CMH impact on neurological function. B) Variations in gait entropy at baseline (day 0, before hypertension induction), on days corresponding to identified surges in SI (ST) and SI (SL), and on day 30, the final day of the experimental timeline. C) Regularity Index measurements are shown for the same time points as in panel B, offering insights into inter-paw coordination at baseline, during surges in SI (ST) and SI (SL), and at the study's conclusion. Data are presented as mean ± SEM for the 20 mice studied

References

    1. Ungvari Z, Tarantini S, Kirkpatrick AC, Csiszar A, Prodan CI. Cerebral microhemorrhages: mechanisms, consequences, and prevention. Am J Physiol Heart Circ Physiol. 2017;312:H1128–43. 10.1152/ajpheart.00780.2016. 10.1152/ajpheart.00780.2016 - DOI - PMC - PubMed
    1. Akoudad S, Portegies ML, Koudstaal PJ, Hofman A, van der Lugt A, Ikram MA, Vernooij MW. Cerebral microbleeds are associated with an increased risk of stroke: The Rotterdam Study. Circulation. 2015;132:509–16. 10.1161/CIRCULATIONAHA.115.016261. (CIRCULATIONAHA.115.016261[pii]). 10.1161/CIRCULATIONAHA.115.016261 - DOI - PubMed
    1. Akoudad S, Wolters FJ, Viswanathan A, de Bruijn RF, van der Lugt A, Hofman A, Koudstaal PJ, Ikram MA, Vernooij MW. Association of cerebral microbleeds with cognitive decline and dementia. JAMA Neurol. 2016;73:934–43. 10.1001/jamaneurol.2016.1017. (2526492[pii]). 10.1001/jamaneurol.2016.1017 - DOI - PMC - PubMed
    1. Altmann-Schneider I, Trompet S, de Craen AJ, van Es AC, Jukema JW, Stott DJ, Sattar N, Westendorp RG, van Buchem MA, van der Grond J. Cerebral microbleeds are predictive of mortality in the elderly. Stroke. 2011;42:638–44. 10.1161/STROKEAHA.110.595611. (STROKEAHA.110.595611[pii]). 10.1161/STROKEAHA.110.595611 - DOI - PubMed
    1. Ayaz M, Boikov AS, Haacke EM, Kido DK, Kirsch WM. Imaging cerebral microbleeds using susceptibility weighted imaging: one step toward detecting vascular dementia. J Magn Reson Imaging. 2010;31:142–8. 10.1002/jmri.22001. 10.1002/jmri.22001 - DOI - PMC - PubMed

LinkOut - more resources