. 2024 Jun 10:15:1413699.
doi: 10.3389/fphar.2024.1413699. eCollection 2024.

Clinical significance and biological function of interferon regulatory factor 1 in non-small cell lung cancer

Affiliations

Clinical significance and biological function of interferon regulatory factor 1 in non-small cell lung cancer

Jialin Su et al. Front Pharmacol. .

Abstract

The clinical application and biological function of interferon regulatory factor 1 (IRF1) in non-small cell lung cancer (NSCLC) patients undergoing chemoimmunotherapy remain elusive. The aim of this study was to investigate the predictive and prognostic significance of IRF1 in NSCLC patients. We employed the cBioPortal database to predict frequency changes in IRF1 and explore its target genes. Bioinformatic methods were utilized to analyze the relationship between IRF1 and immune regulatory factors. Retrospective analysis of clinical samples was conducted to assess the predictive and prognostic value of IRF1 in chemoimmunotherapy. Additionally, A549 cells with varying IRF1 expression levels were constructed to investigate its effects on NSCLC cells, while animal experiments were performed to study the role of IRF1 in vivo. Our findings revealed that the primary mutation of IRF1 is deep deletion and it exhibits a close association with immune regulatory factors. KRAS and TP53 are among the target genes of IRF1, with interferon and IL-2 being the predominantly affected pathways. Clinically, IRF1 levels significantly correlate with the efficacy of chemoimmunotherapy. Patients with high IRF1 levels exhibited a median progression-free survival (mPFS) of 9.5 months, whereas those with low IRF1 levels had a shorter mPFS of 5.8 months. IRF1 levels positively correlate with PD-L1 distribution and circulating IL-2 levels. IL-2 enhances the biological function of IRF1 and recapitulates its role in vivo in the knockdown group. Therefore, IRF1 may possess predictive and prognostic value for chemoimmunotherapy in NSCLC patients through the regulation of the IL-2 inflammatory pathway.

Keywords: chemoimmunotherapy; inflammatory pathway; interferon regulatory Factor-1; interleukin-2; non-small cell lung cancer.


Conflict of interest statement

The authors declare that the research was conducted in the absence of any commercial or financial relationships that could be construed as a potential conflict of interest.

Figures
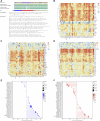
FIGURE 1
FIGURE 1
The effects of IRF1 gene in pan-cancers. (A): IRF1 mutation in pan-cancer samples; The various colors in the first row of the bar graph represent various types of cancer, while the other bar graphs below represent various types of mutations. (B): The correlation between IRF1 and immunosuppressive gene set in pan-cancer. The horizontal axis represents various types of cancer, the vertical axis represents the set of immunosuppressive genes, color represents the correlation coefficient, red represents a positive correlation, blue represents a negative correlation, and the darker the color represents the greater correlation; (C): The correlation between IRF1 and immune stimulating gene set in pan-cancer; The horizontal axis represents various types of cancer, the vertical axis represents the set of Immune Stimulation, color represents the correlation coefficient, red represents a positive correlation, blue represents a negative correlation, and the darker the color represents the greater correlation; (D): The correlation between IRF1 and chemokine gene set in pan-cancer; The horizontal axis represents various types of cancer, the vertical axis represents the set of chemokine, color represents the correlation coefficient, red represents a positive correlation, blue represents a negative correlation, and the darker the color represents the greater correlation; (E): Correlation between IRF1 and TMB; (F): Correlation graph between IRF1 and MSI; The horizontal axis represents the correlation coefficient, the vertical axis represents the set of various cancer genes, and the color represents the p-value, the darker color represents the more significant correlation.
FIGURE 2
FIGURE 2
Network diagram of IRF1 target genes and pathways enriched by IRF1 based on GSEA. (A): The triangle in the figure represents the target gene of IRF1, the circles are all target genes of IRF1, the dark blue represents the target gene directly related to IRF1. (B): The horizontal axis represents various types of cancer, the vertical axis represents various pathways, the size of the point represents significance, the larger the point represents the more significant, and the color represents the standardized enrichment score.
FIGURE 3
FIGURE 3
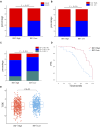
Correlation analysis between IRF1 expression and chemoimmunotherapy in NSCLC. (A) The efficacy of chemoimmunotherapy between the high IRF1 group and the low IRF1 group. (B) Expression of IL2 between high IRF1 group and low IRF1 group. (C) The expression of PD-L1 between the high IRF1 group and the low IRF1 group. (D) The expression of IRF1 is associated with PFS of first-line chemoimmunotherapy in NSCLC patients; (E) Box plot of IRF1 gene expression and tumor immune dysfunction and exclusion (TIDE) score. The horizontal axis represents the high and low groups distinguished by the IRF1 expression value, while the vertical axis represents the respective TIDE scores of the high and low groups. Each point in the graph represents a sample.
FIGURE 4
FIGURE 4
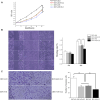
The synergistic effect of IRF1 and IL-2 in A549 lung cancer cells. (A) Proliferation curves of each experimental group; (B) The effects of IRF1 and IL2 on the healing rate of A549 cells were detected by scratch test (The scale is 100 μm); (C) The effects of IRF1 and IL2 on the invasion ability of A549 were detected by Transwell methodt (The scale is 100 μm). (*p < 0.05).
FIGURE 5
FIGURE 5
The synergistic effect of IRF1 and IL-2 in vivo. The synergistic effect of IRF1 and IL-2 on tumor inhibition in vivo was determined by subcutaneous tumor formation in nude mice. (*p < 0.05).
FIGURE 6
FIGURE 6
Single cell analysis of IRF1. (A) Single cell UMAP map; Each color represents a cell type, and each dot represents a cell. (B) Scatter plot of IRF1 single cell expression distribution; the darker the color represents the higher expression, and each dot represents a cell; (C) Violin diagram of IRF1 expression in cells; The horizontal axis represents the cell type, while the vertical axis represents the expression level of IRF1 in each cell type.
FIGURE 7
FIGURE 7
An schematic of how interplay of IRF1 and IL-2 in tumour micro-environment in NSCLC.

References

    1. Alvarez J. V., Greulich H., Sellers W. R., Meyerson M., Frank D. A. (2006). Signal transducer and activator of transcription 3 is required for the oncogenic effects of non-small-cell lung cancer-associated mutations of the epidermal growth factor receptor. Cancer Res. 66 (6), 3162–3168. 10.1158/0008-5472.CAN-05-3757 - DOI - PubMed
    1. Bally A. P., Austin J. W., Boss J. M. (2016). Genetic and epigenetic regulation of PD-1 expression. J. Immunol. 196 (6), 2431–2437. 10.4049/jimmunol.1502643 - DOI - PMC - PubMed
    1. Chang L., Chang M., Chang H. M., Chang F. (2018). Microsatellite instability: a predictive biomarker for cancer immunotherapy. Appl. Immunohistochem. Mol. Morphol. 26 (2), e15–e21. 10.1097/PAI.0000000000000575 - DOI - PubMed
    1. Devenish L. P., Mhlanga M. M., Negishi Y. (2021). Immune regulation in time and space: the role of local- and long-range genomic interactions in regulating immune responses. Front. Immunol. 12, 662565. 10.3389/fimmu.2021.662565 - DOI - PMC - PubMed
    1. Feng H., Zhang Y. B., Gui J. F., Lemon S. M., Yamane D. (2021). Interferon regulatory factor 1 (IRF1) and anti-pathogen innate immune responses. PLoS Pathog. 17 (1), e1009220. 10.1371/journal.ppat.1009220 - DOI - PMC - PubMed