[Preprint]. 2024 Jun 12:2024.06.12.598678.
doi: 10.1101/2024.06.12.598678.

Molecular insights into the interaction between a disordered protein and a folded RNA

Affiliations

Molecular insights into the interaction between a disordered protein and a folded RNA

Rishav Mitra et al. bioRxiv. .

Update in

Abstract

Intrinsically disordered protein regions (IDRs) are well-established as contributors to intermolecular interactions and the formation of biomolecular condensates. In particular, RNA-binding proteins (RBPs) often harbor IDRs in addition to folded RNA-binding domains that contribute to RBP function. To understand the dynamic interactions of an IDR-RNA complex, we characterized the RNA-binding features of a small (68 residues), positively charged IDR-containing protein, SERF. At high concentrations, SERF and RNA undergo charge-driven associative phase separation to form a protein- and RNA-rich dense phase. A key advantage of this model system is that this threshold for demixing is sufficiently high that we could use solution-state biophysical methods to interrogate the stoichiometric complexes of SERF with RNA in the one-phase regime. Herein, we describe our comprehensive characterization of SERF alone and in complex with a small fragment of the HIV-1 TAR RNA (TAR) with complementary biophysical methods and molecular simulations. We find that this binding event is not accompanied by the acquisition of structure by either molecule; however, we see evidence for a modest global compaction of the SERF ensemble when bound to RNA. This behavior likely reflects attenuated charge repulsion within SERF via binding to the polyanionic RNA and provides a rationale for the higher-order assembly of SERF in the context of RNA. We envision that the SERF-RNA system will lower the barrier to accessing the details that support IDR-RNA interactions and likewise deepen our understanding of the role of IDR-RNA contacts in complex formation and liquid-liquid phase separation.

Keywords: RNA-binding protein; RNA-protein complex; condensate; intrinsically disordered regions (IDRs); nuclear magnetic resonance (NMR); phase separation.


Conflict of interest statement

DECLARATION OF INTERESTS The authors declare that they have no competing financial interests.

Figures

Figure 1:
Figure 1:. SERF is a highly positively charged disordered protein that can bind RNA.
(A) Sequence of S. cerevisiae SERF with domain annotations (NTR – N-terminal region; CTR – C-terminal region). Positive and negative amino acids are colored in blue and red, respectively. (B) Per-residue disorder scores from Metapredict(1) (top) and SERF net charge per residue (NCPR) calculated with CIDER using a window size of five(2). (C) Diagram of the fragment of the HIV-1 TAR RNA used in this study (nucleotides 17–45) (top). TAR features of interest are shown in gray. Helix I and Helix II are also referenced as ‘upper’ and ‘lower’ helices, respectively. The bottom panel shows the alignment of TAR conformers from the NMR solution structure (PDB ID: 1ANR)(3). One conformer is shown in green for clarity; the other 19 are shown as white outlines to illustrate TAR dynamics.
Figure 2:
Figure 2:. SERF is globally disordered amid regions of transient structure.
(A) Secondary structure of SERF calculated from NMR chemical shifts (grey bars). Positive values indicate regions of alpha helix; negative values correspond to beta strand/extended regions. Average alpha helix character of SERF determined using back-calculated chemical shifts from all-atom simulations is shown as a dark pink trace. For comparison, back-calculated chemical shifts from simulations in which C-terminal region of SERF was fixed as a helix are shown in light pink. (B) Residue-specific 15N transverse relaxation times (T2) of SERF. The C-terminal helix (shaded) corresponds to a track of residues with depressed T2 values. (C) Paramagnetic relaxation enhancement (PRE) NMR profiles for SERF containing PRE labels at residues 10 (top) or 63 (bottom). Grey bars reflect PRE measurements: missing/unassignable resonances are denoted with a black dot. The solid line is the PRE profile calculated from all-atom simulations and the dashed line is the theoretical profile for a Flory Random Coil (null model). The star indicates the site of MTSSL attachment in PRE NMR experiments.
Figure 3:
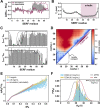
Figure 3:. Properties of the SERF-TAR complex.
(A) Binding isotherms for SERF and FAM-labeled TAR (circles) or FAM-rU30 (squares). The error bars represent the 95% confidence interval from three technical replicates. The solid lines represent the nonlinear fit to a 1:1 binding model. The difference in baseline anisotropy values between binding TAR and rU30 arises from the difference in diffusion properties between the structured vs. unstructured fluorescent RNAs. (B) Collision cross section distributions (nm) for the mixture of SERF and TAR determine by IM-MS. (C) Distributions of Rg values for SERF from coarse-grained simulations of SERF alone (left), SERF and TAR (middle), or SERF and rU30 (right). Note that Rg calculations were performed on the protein molecule only. For each case, the average Rg is given above its corresponding violin distribution. For comparison, the average Rg from all-atom simulations is denoted by the dashed pink line. The Rg from Guinier analysis of the SAXS data is shown as the dashed black line. (D) Normalized distance map of the ySERF ensemble from simulations. Inter-residue (Cα-Cα) distances were measured per frame and averaged; the relative distance is presented. Intramolecular distances relative to the AFRC model are presented such that red is more expanded than AFRC and blue is more compact. (E) Dimensionless Kratky transformation of scattering data. FoXS was used to calculate the average scattering profile from all-atom simulations.(4) (F) Radius of gyration (Rg) probability distributions for ySERF from SAXS experiments and simulations. The dashed vertical line marks the Rg determined from the Guinier approximation. EOM distributions for two different ySERF concentrations are shown as bars colored in blue or yellow. The grey distribution is that of the AFRC model for the ySERF sequence and the pink trace is the distribution of Rg values from all-atom ySERF simulations. For comparison, the Rg distribution from 14250 frames was normalized by kernel density estimate.
Figure 4:
Figure 4:. Determinants of SERF-TAR interactions.
(A) TROSY-HSQC spectra of isotopically enriched TAR showing chemical shift changes upon titrating with unlabeled SERF (molar ratio color coded according to the insert scale). (B) Diagram of the binding footprint of SERF on TAR from coarse-grained simulations (left) and NMR experiments (right). Each TAR nucleotide is depicted with a circle colored to reflect either contact frequency (from simulations) or the maximal 13C chemical shift perturbation (CSP) (from NMR). The intensity of the coloring represents the propensity for SERF interaction at each TAR nucleotide. (C) Plot depicting regions of SERF that interact with TAR. Chemical shift perturbations in SERF upon adding TAR are shown as black bars (left axis). Residues for which bound-state assignments could not be determined are denoted with black dots. The average per-residue contact frequency for SERF with 15 TAR conformers is shown as a green trace; the standard deviation is shown as grey shading above and below the green line. (D) Secondary structure profile for TAR-bound SERF calculated from NMR chemical shifts. The unbound SERF secondary structure profile is shown as a grey line for comparison. (E) 15N transverse relaxation times for SERF in complex with TAR (green). Values for unbound SERF (gray) are reproduced from Figure 2B for comparison.
Figure 5:
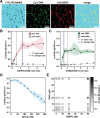
Figure 5:. Characterization of SERF-TAR coacervates.
(A) Fluorescence images of ySERF-Cy5 (A63C) and/or TAR-Cy3 in droplets. Samples for imaging contained 50 μM SERF and 50 μM TAR and 10% (w/v) PEG8000 in a buffer of 20 mM HEPES, pH 7.5, 85 mM NaCl, 1 mM MgCl2. FITC-PEG is not incorporated to droplets containing SERF and TAR. (B) and (C) Turbidity titrations (B) with increasing [SERF] titrated into a fixed concentration (20 μM) of TAR (pink circles) or buffer control (grey squares). (C) with increasing [TAR] titrated into a fixed concentration (50 μM) of SERF (green circles) or buffer control (grey squares). (D) Turbidity as a function of NaCl concentration. In B, C, and D, the shading represents the standard deviation from the average of three technical replicates. Lines connecting the data points are shown to guide the eye. (E) Phase diagram of SERF-TAR phase separation generated by measuring turbidity at 340 nm.

References

    1. Holehouse A. S. & Kragelund B. B. The molecular basis for cellular function of intrinsically disordered protein regions. Nat Rev Mol Cell Biol 25, 187–211 (2024). - PMC - PubMed
    1. Ottoz D. S. M. & Berchowitz L. E. The role of disorder in RNA binding affinity and specificity. Open Biol 10, 200328 (2020). - PMC - PubMed
    1. Cubuk J. et al. The disordered N-terminal tail of SARS-CoV-2 Nucleocapsid protein forms a dynamic complex with RNA. Nucleic Acids Res 52, 2609–2624 (2024). - PMC - PubMed
    1. Holmstrom E. D., Liu Z., Nettels D., Best R. B. & Schuler B. Disordered RNA chaperones can enhance nucleic acid folding via local charge screening. Nat Commun 10, (2019). - PMC - PubMed
    1. Van Nostrand E. L. et al. A large-scale binding and functional map of human RNA-binding proteins. Nature 583, 711–719 (2020). - PMC - PubMed

Publication types