[Preprint]. 2024 Jun 14:2024.06.14.598883.
doi: 10.1101/2024.06.14.598883.

Neuronal identity control at the resolution of a single transcription factor isoform

Affiliations

Neuronal identity control at the resolution of a single transcription factor isoform

Natalie Smolin et al. bioRxiv. .

Abstract

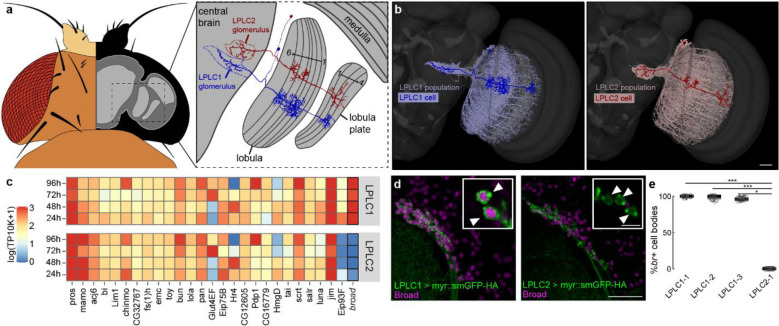
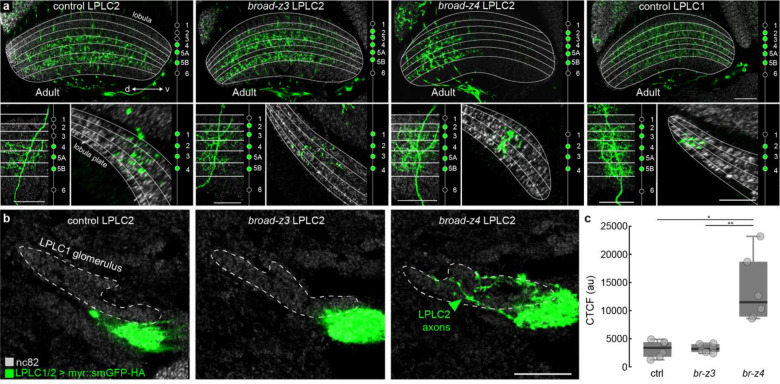
The brain exhibits remarkable neuronal diversity which is critical for its functional integrity. From the sheer number of cell types emerging from extensive transcriptional, morphological, and connectome datasets, the question arises of how the brain is capable of generating so many unique identities. 'Terminal selectors' are transcription factors hypothesized to determine the final identity characteristics in post-mitotic cells. Which transcription factors function as terminal selectors and the level of control they exert over different terminal characteristics are not well defined. Here, we establish a novel role for the transcription factor broad as a terminal selector in Drosophila melanogaster. We capitalize on existing large sequencing and connectomics datasets and employ a comprehensive characterization of terminal characteristics including Perturb-seq and whole-cell electrophysiology. We find a single isoform broad-z4 serves as the switch between the identity of two visual projection neurons LPLC1 and LPLC2. Broad-z4 is natively expressed in LPLC1, and is capable of transforming the transcriptome, morphology, and functional connectivity of LPLC2 cells into LPLC1 cells when perturbed. Our comprehensive work establishes a single isoform as the smallest unit underlying an identity switch, which may serve as a conserved strategy replicated across developmental programs.

Keywords: Cell Identity; Drosophila melanogaster; Electrophysiology; Neurobiology; Neurodevelopment; Terminal Selector; Transcription Factors; Visual Projection Neurons; Visual System; scRNA-seq.


Figures

Figure 1:
Figure 1:. The transcription factor broad is differentially expressed between LPLC1 and LPLC2.
(a) Fly brain schematic dorsal view illustrating single LPLC1 and LPLC2 neuron projection patterns. (b) Mesh reconstruction (Dorkenwald et al., 2022) of LPLC1 (left) and LPLC2 (right) populations within an anterior view of the fly brain. A single LPLC1 (left) and LPLC2 (right) drawing has been overlaid onto these populations. (c) Heatmaps showing expression of transcription factors in developing LPLC1 and LPLC2 neurons, data from (Kurmangaliyev et al., 2020). Columns are highly expressed genes that define these two cell-types, and rows indicate hours after pupae formation (APF). The average normalized expression is shown as log-transformed TP10K values (transcripts-per-10,000 UMI). See Methods for details. (d) Broad protein labeling displaying broad positive LPLC1 cell bodies (left) and broad negative LPLC2 cell bodies (right). Scale bar = 20 μm. Insets feature a zoomed in single plane with arrowheads pointing to individual cell bodies. Inset scale bar = 5 μm. (e) Quantification of broad positive somata in three LPLC1 driver lines and one LPLC2 driver line. N ≥ 6 animals for all conditions. Kruskal Wallis (p = 7.31e-8), Dunn-Sidak post hoc. * = p<0.05, ** = p<0.01, *** = p<0.001.
Figure 2:
Figure 2:. Knock-down of broad in LPLC1 cells results in ectopic axonal branching into the LPLC2 glomerulus.
(a) Maximum projection images of axons tracts for control LPLC1 and broad knock-down (broad RNAi-1 and broad RNAi-2) LPLC1 cells. Scale bar = 20 μm. (b) Quantification of overall axonal volume of each condition in (a). N ≥ 4 animals for each condition. Kruskal Wallis (p = 2.98e-04), Dunn-Sidak post hoc. * = p<0.05, ** = p<0.01, *** = p<0.001. (c) Single plane images depicting the innervation of the LPLC1 glomerulus by LPLC1 axons. Scale bar = 20 μm. (d) Quantification of LPLC1 axon density (corrected total cell fluorescence, CTCF) in the LPLC1 glomerulus shown in (c). N ≥ 4 animals for each condition. Kruskal Wallis (p = 1.84e-04), Dunn-Sidak post hoc * = p<0.05, ** = p<0.01, *** = p<0.001. (e) Single plane images depicting the innervation of the LPLC2 glomerulus by LPLC1 axons. Scale bar = 20 μm. (f) Quantification of LPLC1 axon density (CTCF) in the LPLC2 glomerulus shown in (e). N ≥ 4 animals for each condition. Kruskal Wallis (p = 0.0053), Dunn-Sidak post hoc * = p<0.05, ** = p<0.01, *** = p<0.001. Scale bar = 20 μm.
Figure 3:
Figure 3:. broad-z3 and broad-z4 overexpression in LPLC2 cells result in LPLC1-like morphologies.
(a) (top) Innervation of the lobula for control LPLC2 cells, broad-z3 LPLC2 cells, broad-z4 LPLC2 cells, and control LPLC1 cells. Scale bar = 20 μm. (bottom left) Single cell morphology of cells within the lobula. Scale bar = 20 μm. (bottom right) Single cell morphology of cells within the lobula plate. N ≥ 6 animals for each condition. Scale bar = 20 μm. (b) Innervation of the LPLC1 glomerulus for control, broad-z3, and broad-z4 LPLC2 cells. (c) Quantification of LPLC2 axon density (CTCF) in the LPLC1 glomerulus shown in (b). N ≥ 6 animals for each condition. Kruskal Wallis (p = 0.0034), Dunn-Sidak post hoc * = p<0.05, ** = p<0.01, *** = p<0.001. Scale bar = 20 μm.
Figure 4:
Figure 4:. T2 cells are now connected to LPLC2 cells with the overexpression of broad.
(a) Presynaptic inputs greater than 1% of total synapse counts to LPLC1 and LPLC2. (b) Mesh reconstruction (Dorkenwald et al., 2022; Schlegel et al., 2023; Zheng et al., 2018) of a representative (left) LPLC1 or (right) LPLC2 neuron. Approximate lobula layers have been boxed over the dendrites. Scalebar = 15 μm. (c) Mesh reconstructions of all synapses (colored circles) from Tm5f, Tm20, Tm4, and T2 neurons (Buhmann et al., 2021; Dorkenwald et al., 2022; Heinrich et al., 2018; Schlegel et al., 2023; Zheng et al., 2018) on a (left) LPLC1 and a (right) LPLC2 neuron. Scalebar = 10 μm. (d) Schematic illustrating whole-cell electrophysiology and optogenetics setup with light delivery through the objective. (e) Average responses for LPLC2 with and without broad isoform overexpression when T2 are optogenetically activated. (f,g) Quantification of (f) peak depolarization and (g) activation latency. N = 4 animals for each condition. Wilcoxon Rank Sum Test, * = p<0.05.
Figure 5:
Figure 5:. Overexpression of broad-z4 recodes transcriptional identities of LPLC2 cells.
(a) Experimental design of the multiplexed single-cell Perturb-Seq experiment. F1-generation of pupae carry the LPLC2 split-Gal4 driver (OL0048B), a nuclear GFP reporter (UAS-H2A-GFP), an overexpression or control construct (ctrl, broad-z3, broad-z4), and a replicate-specific wild-type X-chromosome (DGRP). LPLC2 neurons were purified and used for scRNA-seq at two timepoints (48h and 72h APF). Each experimental condition was replicated 3–5 times. The analysis at 48h APF is shown in (b-g); the analysis at 72h APF is shown in Supplementary Figure 4. See Methods for more details. (b) t-distributed stochastic neighbor embedding (tSNE) plots are used only for visualization of the clustering of the data. Left, cells are color coded based on unsupervised clustering; Right, cells are color coded based on experimental conditions. (c) Cell counts across clusters and conditions. (d) Expression levels of LPLC2-specific transcription factors (Kurmangaliyev et al., 2020; Ozel et al., 2022) nuclear GFP reporter, and two genes enriched in ectopic, non-LPLC2, clusters (X4/X5). (e) Correlation analysis between transcriptional profiles of LPLC1 and LPLC2 neurons from the developmental atlas (Kurmangaliyev et al., 2020) and LPLC2 neurons in each experimental condition. Comparisons are based on differentially expressed genes (DEGs) between LPLC1 and LPLC2 from (f). Circles are Pearson’s r for individual replicates; boxplots are distributions. (f) Heatmaps of expression patterns of DEGs between LPLC1 and LPLC2 at 48h APF. Expression patterns are shown in the atlas (top) and for each condition and replicate. DGRP lines for each X chromosome and replicate are indicated. See Methods for thresholds. (g) Coverage plots of scRNA-seq reads at the 3’-UTR region of broad in the atlas and Perturb-seq datasets. Most of the reads support the expression of the broad-z4 isoform in LPLC1 neurons. Note that coverage of the overexpression constructs is restricted to the coding regions of corresponding transcripts.

References

    1. Ache J. M., Polsky J., Alghailani S., Parekh R., Breads P., Peek M. Y., Bock D. D., von Reyn C. R., & Card G. M. (2019). Neural Basis for Looming Size and Velocity Encoding in the Drosophila Giant Fiber Escape Pathway. Curr Biol, 29(6), 1073–1081 e1074. 10.1016/j.cub.2019.01.079 - DOI - PubMed
    1. Ahn S., Yang H., Son S., Lee H. S., Park D., Yim H., Choi H. J., Swoboda P., & Lee J. (2022). The C. elegans regulatory factor X (RFX) DAF-19M module: A shift from general ciliogenesis to cell-specific ciliary and behavioral specialization. Cell Rep, 39(2), 110661. 10.1016/j.celrep.2022.110661 - DOI - PubMed
    1. Allan D. W., & Thor S. (2015). Transcriptional selectors, masters, and combinatorial codes: regulatory principles of neural subtype specification. Wiley Interdiscip Rev Dev Biol, 4(5), 505–528. 10.1002/wdev.191 - DOI - PMC - PubMed
    1. Arber S., Han B., Mendelsohn M., Smith M., Jessell T. M., & Sockanathan S. (1999). Requirement for the homeobox gene Hb9 in the consolidation of motor neuron identity. Neuron, 23(4), 659–674. 10.1016/s0896-6273(01)80026-x - DOI - PubMed
    1. Bayer C. A., Holley B., & Fristrom J. W. (1996). A switch in broad-complex zinc-finger isoform expression is regulated posttranscriptionally during the metamorphosis of Drosophila imaginal discs. Dev Biol, 177(1), 1–14. 10.1006/dbio.1996.0140 - DOI - PubMed

Publication types

LinkOut - more resources