[Preprint]. 2025 Sep 4:2024.06.11.598379.
doi: 10.1101/2024.06.11.598379.

Preventing trogocytosis by cathepsin B inhibition augments CAR T cell function

Affiliations

Preventing trogocytosis by cathepsin B inhibition augments CAR T cell function

Kenneth A Dietze et al. bioRxiv. .

Abstract

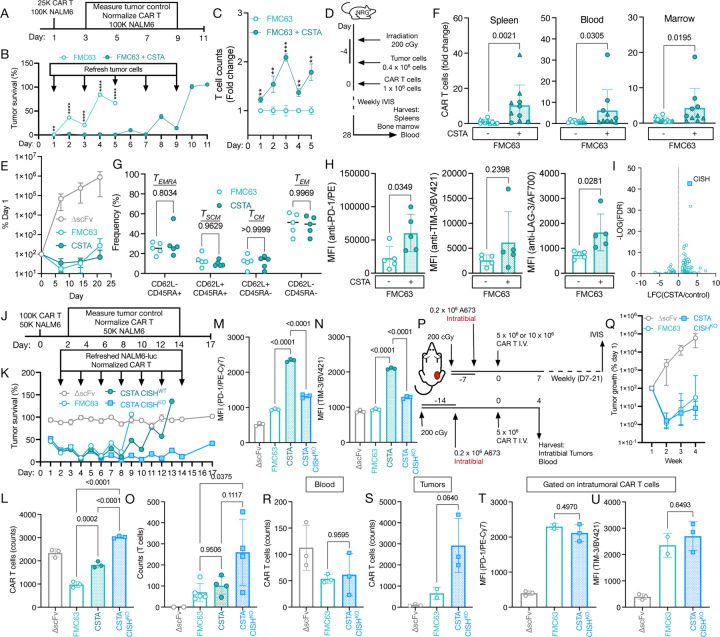
Chimeric antigen receptor (CAR) T cell therapy has shown remarkable efficacy in cancer treatment. Still, most patients receiving CAR T cells relapse within 5 years of treatment. CAR-mediated trogocytosis (CMT) is a potential tumor escape mechanism in which cell surface proteins transfer from tumor cells to CAR T cells. CMT results in the emergence of antigen-negative tumor cells, which can evade future CAR detection, and antigen-positive CAR T cells, which has been suggested to cause CAR T cell fratricide and exhaustion. Whether CMT indeed causes CAR T cell dysfunction and the molecular mechanisms conferring CMT remain unknown. Using a selective degrader of trogocytosed antigen in CAR T cells, we show that the presence of trogocytosed antigen on the CAR T cell surface directly causes CAR T cell fratricide and exhaustion. By performing a small molecule screening using a custom high throughput CMT-screening assay, we found that the cysteine protease cathepsin B is essential for CMT and that inhibition of cathepsin B is sufficient to prevent CAR T cell fratricide and exhaustion, leading to improved long-term CAR T cell persistence and anti-tumor activity. Our data demonstrate that it is feasible to separate CMT from cytotoxic activity, that CAR T cell persistence, a key factor associated with clinical CAR T cell efficacy, is directly linked to cathepsin B activity in CAR T cells, and that it is possible to improve CAR T cell function through selective inhibition of CMT.


Conflict of interest statement

Competing interests KAD and TL are inventors on patent application number PCT/US24/53867 describing therapeutic targeting of tumor escape by CAR-mediated trogocytosis. TL receives a salary from AbbVie.

Figures

Figure 1:
Figure 1:. CD19 and BCMA CAR T cells rapidly acquire target antigen via trogocytosis.
(A) Observation of CMT in brightfield (BF) and confocal images of ∆scFv or FMC63 CAR T cells. CAR T cells were cultured with plate-bound 293T cells expressing a CD19-GFP fusion protein. CD19 is shown in green. Individual CAR T cells are circled in yellow and tracked over time. Scale bar represents 5µm. Data is representative of cells from two independent experiments. (B) Schema of BCMA-targeting CAR T cell products. The same PBMC donor was used to produce Abecma and Carvykti CAR T cells; due to availability, a separate donor was used to produce CL10 CAR T cells. (C) BCMA transfer to CAR T cells (top) and BCMA loss on BCMA-GFP-expressing K562 cells (bottom) as determined by flow cytometry. (D) BCMA loss on MM.1S, RPMI8226, and U266B1 cells when cocultured with CL1031 , Abecma, and Carvykti CAR T cells as determined by flow cytometry. (C/D) Data is representative of three independent experiments. (E) Amount of CD19 on CAR T cells (CAR+) or non-CAR T cells (CAR) in PBMCs isolated from patients 7–28 days after receiving CD19 CAR T cell therapy using full-spectrum flow cytometry. Data indicate values from individual patient samples (FMO n = 4; anti-CD19 n = 13). Statistical significance was determined by Wilcoxon matched-pairs signed-rank test. Fluorescence-minus-one (FMO) refers to staining with full flow cytometry panel except anti-CD19. (F) Representative flow cytometry data from one patient depicting CD19 levels on CAR and CAR+ T cells. CAR was stained using an anti-idiotype antibody.
Figure 2:
Figure 2:. CAR-mediated trogocytosis directly causes CAR T cell dysfunction.
(A) Schema of trogocytosed antigen degrader (TAD). (B) CD19 and (C) GFP expression on FMC63 CAR T cells expressing TADGFP or T cells expressing a CAR lacking a binding domain (∆scFv) following a 2-hour coculture with CD19-GFP-expressing NALM6 cells as determined by flow cytometry. Data indicates mean ± S.D. from three technical replicates. (D) Quantification of CAR T cells after a 24-hour coculture with CD19-GFP-expressing NALM6 cells using flow cytometry. Values are normalized to wells containing only CAR T cells. (B-D) Data indicates mean ± S.D. from three technical replicates. Data is representative of three independent experiments. (E) Schema of a fully human-derived TAD system (TADCD19). Lyn = SH2 domain of lyn kinase; VHL = von Hippel-Lindau protein; Ub = ubiquitin. (F) GFP and (G) CD19 expression on FMC63 CAR T cells expressing TADCD19 or ∆scFv CAR T cells after a 2-hour coculture with CD19-GFP-expressing NALM6 cells at a 0.5:1 effector-target ratio. Data indicates mean ± S.D. from three technical replicates. Data is representative of two independent experiments. (H) LAG-3 and (I) TIM-3 expression on CAR T cells expressing TADGFP as measured by MFI after a 24-hour coculture with CD19-GFP-expressing NALM6 cells using full-spectrum flow cytometry. Data indicates mean ± S.D. from three technical replicates. Data is representative of three independent experiments. (B-D, F-I) Statistical significance was determined by one-way ANOVA. (J) Schema of in vitro serial coculture experiment to determine long-term CAR T cell expansion and antitumor activity. CAR T cells were normalized and fresh tumor cells were added on days 3, 5, and 7. (K) Survival of CD19-GFP-expressing NALM6 cells expressing firefly luciferase (Fluc) at a 0.5:1 effector-target ratio using a luminescence-based cytotoxicity assay. Data indicates mean ± S.D. from three technical replicates. Tumor survival was normalized to untreated tumor cells. Data is representative of two independent experiments. Statistical significance comparing FMC63 and FMC63-TADGFP was determined by two-way ANOVA.
Figure 3:
Figure 3:. Luciferase complementation assay allows for the real-time detection of trogocytosis.
(A) Schema of luciferase complementation assay (CompLuc). (B) Schema of constructs used for CAR T cells (I) and tumor cells (II/III) for development of luciferase complementation assay. SP = signal peptide; TM = transmembrane region; trECD = truncated extracellular domain; ECD = extracellular domain; ICD = intracellular domain. (C) Luminescence of nLuc+cLuc+ CAR T cells. Data represent mean ± S.D. of three technical replicates and is representative of two independent experiments. (D) CMT during coculture of FMC63 CAR T cells expressing nLuc with K562 cells expressing full length (teal) or truncated (tr19, orange) CD19 fused to cLuc using CompLuc or flow cytometry after 1 hour at the indicated effector-target ratios. CMT using CompLuc was measured for a total of 2.5 hours at 1-minute intervals. Data represents best fit of three technical replicates. Boxed area represents histogram of anti-CD19/FITC staining of CAR T cells at a 1:1 effector-target ratio after 1 hour as measured by flow cytometry. (E) Area-under-curve quantification of luminescence in Fig. 2D. Data represent mean ± S.D. of three technical replicates. (F) CMT during coculture of ∆scFv or FMC63 CAR T cells expressing nLuc with K562 cells expressing full length CD19-cLuc using CompLuc or flow cytometry after 1 hour at the indicated effector-target ratios. CMT using CompLuc was measured for a total of 2.5 hours at 1-minute intervals. Data represents best fit of three technical replicates. Boxed area represents histogram of anti-CD19/FITC staining of CAR T cells at a 1:1 effector-target ratio after 1 hour as measured by flow cytometry. (D-F) Data is representative of at least three independent experiments. (G) Peak luminescence of FMC63 CAR T cells cocultured with K562 cells expressing CD19-cLuc at a 1:1 effector-target ratio as determined by CompLuc. CAR T cells were pre-treated with cytochalasin D for 1 hour at the indicated concentrations. (H) Survival of Raji-Fluc cells after a 16-hour coculture with FMC63 CAR T cells pre-treated with the indicated concentrations of cytochalasin D. CMT values are normalized to a DMSO control. (G/H) Data represent mean ± S.D. of three technical replicates. Data is representative of two independent experiments.
Figure 4:
Figure 4:. Extracellular cathepsin B is a key driver of CAR-mediated trogocytosis.
(A) Schema of potential modulators of CMT. (B) Peak luminescence as determined by CompLuc of FMC63 CAR T cells treated with inhibitors of the indicated proteins cocultured with K562 cells expressing CD19-cLuc at a 1:1 effector-target ratio. Values are normalized to DMSO/vehicle control. Data represent mean ± S.D. of three technical replicates. Data is representative of three independent experiments. (C) Survival of Raji-Fluc cells after 16-hour coculture with FMC63 CAR T cells treated with inhibitors of the indicated proteins at a single concentration. Tumor survival was measured using a luciferase-based cytotoxicity assay. Data represent mean ± S.D. of three technical replicates. Data is representative of two independent experiments. (D) Peak luminescence as determined by CompLuc of FMC63 CAR T cells cocultured with K562 cells expressing CD19-cLuc at a 1:1 effector-target ratio. FMC63 CAR T cells were pre-treated with the indicated concentrations of Ca-074-Me (membrane-permeable) or Ca-074 (membrane-impermeable). Values are normalized to DMSO/vehicle control. Data represent mean ± S.D. of three technical replicates. Data is representative of three independent experiments. (E) Schema of imaging assay setup used to assess cathepsin B (CTSB) localization to the immune synapse. Biotinylated CD19 was immobilized on plate-bound NeutrAvidin. ∆scFv or FMC63 CAR T cells expressing CTSB-mCherry were added to slides and imaged using confocal microscopy. (F-H) ∆scFv or FMC63 CAR T cells expressing CTSB-mCherry were imaged by spinning disk confocal imaging after exposure to CD19 immobilized on glass slides at different time points. (F) Side (x-z) view of the distribution of CTSB-mCherry (red) at the indicated time points. The bottom of each box is aligned to the interface between the glass slide and the T cell. (G) Axial dispersion or (H) average distance of CTSB to the site of antigen contact. Data represent values from individual cells fixed 5 or 15 minutes after exposure to recombinant CD19. Numbers represent cells analyzed for each condition. (G/H) Statistical significance was determined by two-tailed Student’s t-test. (F-H) Data is representative of at least two independent experiments.
Figure 5:
Figure 5:. Cystatin abundance controls CTSB activity and CMT.
(A) Crystal structures of bovine cathepsin B in complex with Ca-074 (left, PDB: 1QDQ) and human cathepsin B in complex with cystatin A (right, PDB: 3K9M). The active site cysteine of cathepsin B is shown in pink; Ca-074 and cystatin A are shown in teal. (B) Schema of construct used for production of CARCSTA T cells. (C) Levels of CSTA in CAR or CARCSTA T cells measured by ELISA. Data represent mean ± S.D. of two technical replicates. (D) Cathepsin B activity in CAR or CARCSTA T cells measured by fluorescence-based CTSB activity assay. Data represent mean ± S.D. of two technical replicates. (C/D) Data is representative of two independent experiments. (E) Survival of Raji-Fluc cells after a 16-hour coculture with FMC63 CAR or CARCSTA T cells at the indicated effector-target ratios. Data represent mean ± S.D. of three technical replicates. Data is representative of at least three independent experiments using cells produced from three healthy donors. (F) CMT of FMC63 CAR or CARCSTA T cells as determined by CompLuc using K562 cells expressing CD19-cLuc after 3 hours. Data is representative of three independent experiments using cells produced from three independent donors. (G) CMT in BCMA CAR or CARCSTA T cells as determined by CompLuc using K562 cells expressing BCMA-GFP-cLuc after 3 hours. Data is representative of three independent experiments. (F/G) Data represents best fit of three technical replicates. (H) CD19 transfer to CAR T cells following a 30-minute coculture of FMC63 CAR or CARCSTA T cells with K562 cells expressing CD19-cLuc at a 0.5:1 effector-target ratio as determined by flow cytometry. Data is representative of at least three independent experiments using cells produced from three healthy donors. (I) BCMA-GFP transfer to CAR T cells following a 2-hour coculture of BCMA CAR or CARCSTA T cells and K562 cells expressing BCMA-GFP-cLuc at a 1:1 effector-target ratio as determined by flow cytometry. Data is representative of three independent experiments. (J) GFP transfer to CAR T cells following a 1-hour coculture with A673 cells engineered to express a CD19-GFP fusion protein at a 1:1 effector target ratio. (K) CD19 loss on tumor cells following a 30-minute coculture of FMC63 CAR or CARCSTA T cells and K562 cells expressing CD19-cLuc at a 0.5:1 effector-target ratio as determined by flow cytometry. Data is representative of at least three independent experiments using cells produced from three healthy donors. (L) BCMA loss on U266B1 tumor cells following a 2-hour coculture of BCMA CAR or CARCSTA T cells and K562 cells expressing BCMA-GFP-cLuc at a 1:1 effector-target ratio as determined by flow cytometry. Data is representative of three independent experiments. (M) GFP loss on A673 tumor cells following a 1-hour coculture of FMC63 CAR or CARCSTA T cells and A673 cells expressing CD19-GFP at a 1:1 effector-target ratio as determined by flow cytometry. (J/M) Data is representative of two independent experiments using cells produced from three healthy donors. (N) Total CAR T cells following a 30-minute coculture of FMC63 CAR or CARCSTA T cells and K562 cells expressing CD19-cLuc at a 0.5:1 effector-target ratio as determined by flow cytometry. Data is representative of at least three independent experiments using cells produced from three healthy donors. (O) Total CAR T cells following a 2-hour coculture of BCMA CAR or CARCSTA T cells and K562 cells expressing BCMA-GFP-cLuc at a 1:1 effector-target ratio as determined by flow cytometry. Data is representative of three independent experiments. (N/O) CAR T cell numbers are normalized to wells containing only CAR T cells using counting beads. (P) CD19 transfer to CAR T cells following a 1-hour coculture of FMC63 CAR or CARCSTA T cells and primary B cell acute lymphoblastic leukemia (B-ALL) cells at a 1:1 effector-target ratio as determined by flow cytometry. (Q) CD19 loss on primary B-ALL cells following a 1-hour coculture of FMC63 CAR or CARCSTA T cells and primary B-ALL cells at a 1:1 effector-target ratio as determined by flow cytometry. (R) Total CAR T cells following a 1-hour coculture of FMC63 CAR or CARCSTA T cells and primary B-ALL cells at a 1:1 effector-target ratio as determined by flow cytometry. (Q-R) Data is representative of three independent experiments. (H-R) Statistical significance was determined by one-way ANOVA.
Figure 6:
Figure 6:. Cystatin A overexpression improves long-term CAR T cell persistence.
(A) Schema of in vitro experiment to determine long-term CAR T cell persistence and antitumor activity. (B) Survival of CD19-GFP-expressing NALM6-Fluc cells at a 0.5:1 effector-target ratio using a luminescence-based cytotoxicity assay. Data indicates mean ± S.D. from three technical replicates. Tumor survival was normalized to untreated tumor cells. Data is representative of two independent experiments. Statistical significance comparing FMC63 CAR and CARCSTA T cells was determined by multiple two-tailed Student’s t-tests. (C) FMC63 CAR and CARCSTA T cell counts on D1–5 of the in vitro serial coculture described in Fig. 6A. Data represent mean ± S.D. of 3 technical replicates and is representative of two independent experiments. Statistical significance comparing FMC63 CAR and CARCSTA T cells was determined by multiple two-tailed Student’s t-tests. (D) Schema of in vivo experiment to measure NALM6 tumor control and CAR T cell persistence. (E) Tumor burden in mice bearing systemic NALM6-Fluc tumors and treated with ∆scFv or FMC63 CAR or CARCSTA T cells as determined by in vivo imaging system (IVIS). Data represent mean ± S.D. of 5 mice per group. Statistical significance was determined by two-way ANOVA. (F) Quantification of CAR T cells in murine spleen, peripheral blood, and bone marrow as determined by flow cytometry. Data represent mean ± S.D. of 10 mice pooled from two independent experiments, with experiments denoted by symbol. Data were normalized to the average of the respective experiment’s CSTA– condition and are expressed as fold change. Statistical significance was determined by two-tailed Student’s t-test. (G) Phenotype of FMC63 CAR/CARCSTA T cells isolated from murine blood as determined by flow cytometry. Statistical significance was determined by two-way ANOVA. (H) PD-1, TIM-3, and LAG-3 expression on FMC63 CAR or CARCSTA T cells isolated from murine blood as determined by flow cytometry. Statistical significance was determined by two-tailed Student’s t-test. (G/H) Data represent mean ± S.D. of 5 mice per group. (I) Differential mRNA expression in sorted FMC63 CAR and CARCSTA T cells after manufacturing as determined by bulk RNA sequencing. Data is representative of cells from two independent productions. (J) Schema of in vitro experiment to determine long-term CAR T cell persistence and antitumor activity. (K) Survival of NALM6-Fluc cells at a 2:1 effector target ratio using a luminescence-based serial cytotoxicity assay. On Days 2, 4, 6, 8, 10, 12, and 14 CAR T cells were normalized and fresh tumor cells were added. Statistical significance was determined by two-way ANOVA. (L) Total CAR T cells on Day 10 of the in vitro serial coculture described in Fig. 6J. (M) PD-1 expression on CAR T cells on Day 5 of in vitro serial coculture described in Fig. 6J. (N) TIM-3 expression on CAR T cells on Day 5 of in vitro serial coculture described in Fig. 6J. (K-N) Data represent mean ± S.D. of three technical replicates and is representative of two independent experiments. (O) Quantification of CAR T cells in bone marrow 28 days after intravenous treatment with the indicated CAR T cell conditions as determined by flow cytometry. Data represent mean ± S.D. of 2–5 mice per group. Statistical significance was determined by one-way ANOVA. (P) Schema of in vivo experiment to measure solid tumor control and CAR T cell infiltration into solid tumors. (Q) Tumor burden in mice bearing intratibial CD19-expressing A673-Fluc tumors and treated intravenously with ∆scFv or FMC63 CAR CISHWT or CARCSTA CISHKO T cells as determined by in vivo imaging system (IVIS). Data represent mean ± S.D. of 3–4 mice per group. (R) Quantification of CAR T cells in peripheral blood four days after treatment with the indicated CAR T cell conditions as determined by flow cytometry (n = 2–3 per group). Statistical significance was determined by one-way ANOVA. (S) Quantification of CAR T cells in intratibial A673 tumors four days after treatment with the indicated CAR T cell conditions as determined by flow cytometry (n = 2–3 per group). Statistical significance was determined by one-way ANOVA. (T) PD-1 and (U) TIM-3 levels on intratumoral CAR T cells four days after CAR T cell injection as determined by flow cytometry. Statistical significance was determined by one-way ANOVA. (R-U) Data represent mean ± S.D. of 2–3 mice per group.

References

    1. Sadelain M. CD19 CAR T Cells. Cell 171, 1471 (2017). - PubMed
    1. Maude S. L. et al. Tisagenlecleucel in Children and Young Adults with B-Cell Lymphoblastic Leukemia. N. Engl. J. Med. 378, 439–448 (2018). - PMC - PubMed
    1. Sadelain M., Rivière I. & Riddell S. Therapeutic T cell engineering. Nature 545, 423–431 (2017). - PMC - PubMed
    1. Raje N. et al. Anti-BCMA CAR T-Cell Therapy bb2121 in Relapsed or Refractory Multiple Myeloma. N. Engl. J. Med. 380, 1726–1737 (2019). - PMC - PubMed
    1. D’Agostino M. & Raje N. Anti-BCMA CAR T-cell therapy in multiple myeloma: can we do better? Leukemia 34, 21–34 (2020). - PubMed

Publication types