[Preprint]. 2024 Jun 11:2024.06.07.597771.
doi: 10.1101/2024.06.07.597771.

Plasma proteomics in the UK Biobank reveals youthful brains and immune systems promote healthspan and longevity

Affiliations

Plasma proteomics in the UK Biobank reveals youthful brains and immune systems promote healthspan and longevity

Hamilton Se-Hwee Oh et al. bioRxiv. .

Abstract

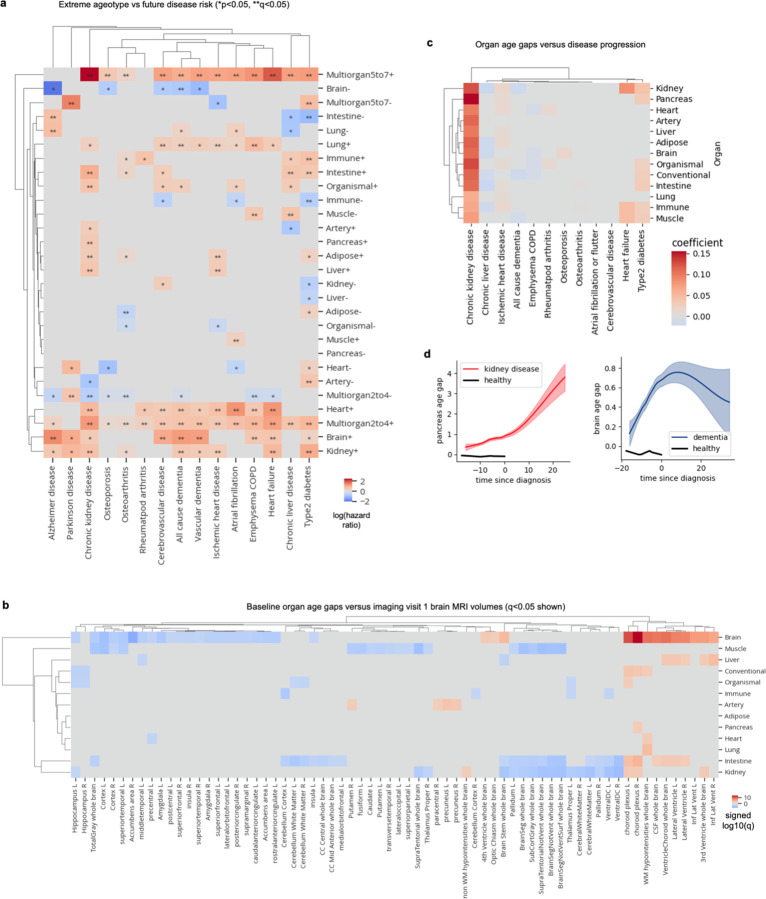
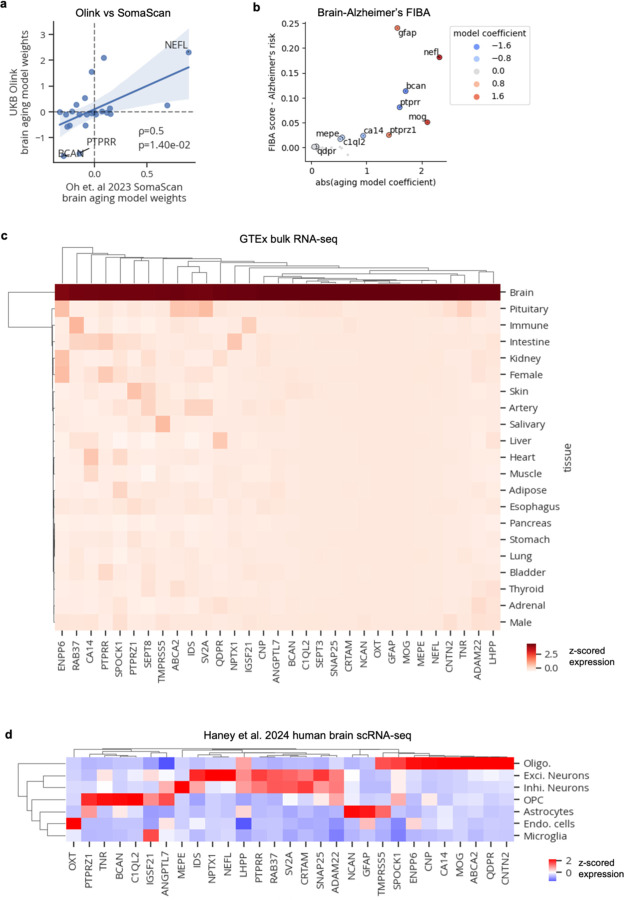
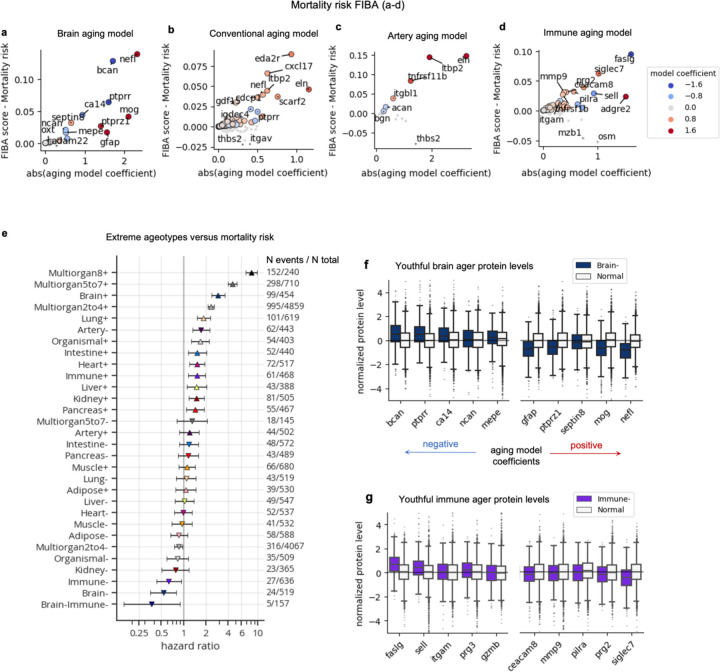
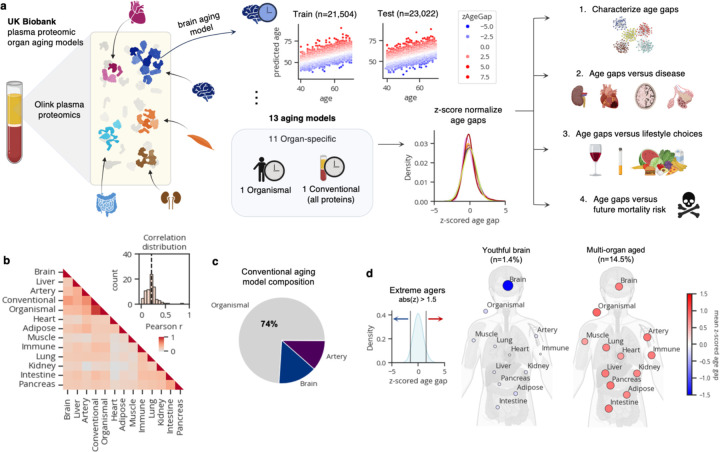
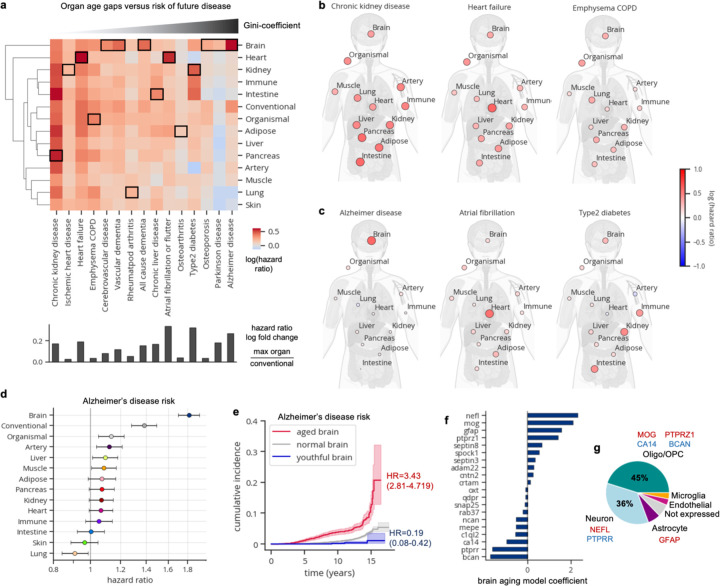
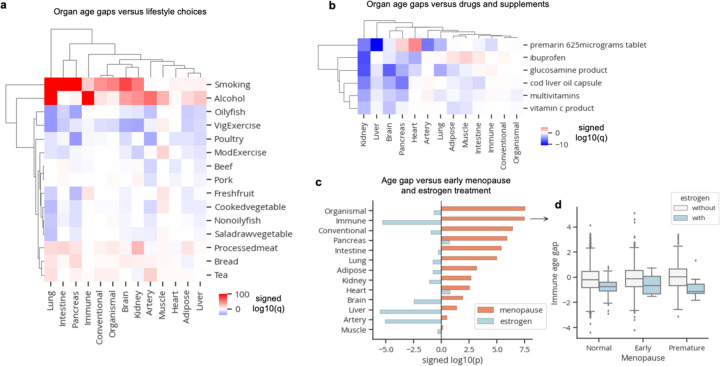
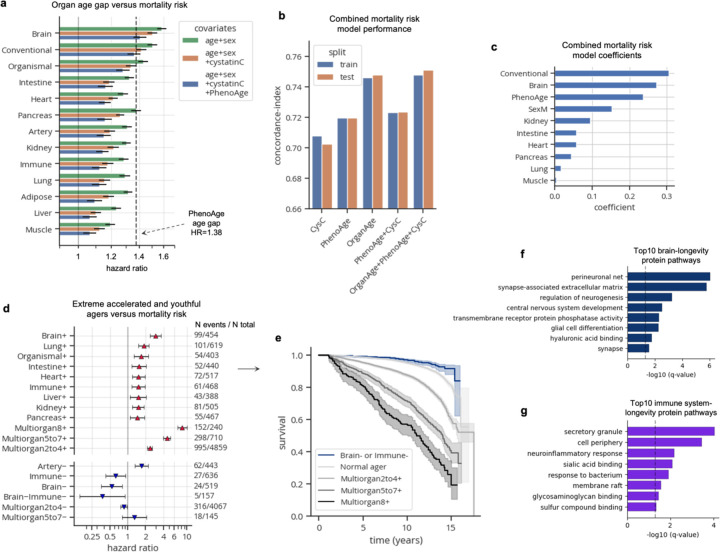
Organ-derived plasma protein signatures derived from aptamer protein arrays track organ-specific aging, disease, and mortality in humans, but the robustness and clinical utility of these models and their biological underpinnings remain unknown. Here, we estimate biological age of 11 organs from 44,526 individuals in the UK Biobank using an antibody-based proteomics platform to model disease and mortality risk. Organ age estimates are associated with future onset of heart failure (heart age HR=1.83), chronic obstructive pulmonary disease (lung age HR=1.39), type II diabetes (kidney age HR=1.58), and Alzheimer's disease (brain age HR=1.81) and sensitive to lifestyle factors such as smoking and exercise, hormone replacement therapy, or supplements. Remarkably, the accrual of aged organs progressively increases mortality risk while a youthful brain and immune system are uniquely associated with disease-free longevity. These findings support the use of plasma proteins for monitoring organ health and the efficacy of drugs targeting organ aging disease.


Conflict of interest statement

T.W-C., H.S.O. and J.R. are co-founders and scientific advisors of Teal Omics Inc. and have received equity stakes. T.W.-C. is a co-founder and scientific advisor of Alkahest Inc. and Qinotto Inc. and has received equity stakes in these companies.

Figures

Extended Data Figure 1.
Extended Data Figure 1.. Organ aging models in the UK Biobank.
a, Age-at-blood-draw distribution by biological sex. b, Correlation between predicted and actual age across all aging models and train/test splits. c, Difference in correlation between predicted and actual age by biological sex. d, Mean difference in organ age gaps between males and females. e, Extreme ager ageotype sample sizes and proportions. f, Age distributions per extreme ager ageotype g, Age distributions per aggregated extreme ager ageotype. Individuals with many aged or youthful organs are significantly older than normal and single organ agers.
Extended Data Figure 2.
Extended Data Figure 2.. Age gaps are stable across longitudinal visits.
a, Longitudinal proteomics data from a subset of 937 individuals were analyzed. Longitudinal data were available only on the 1k-protein platform, so new aging models trained on the 1k-platform were developed. New aging models were trained on 44,406 samples without longitudinal data and tested on samples with longitudinal data (937 unique individuals). Only 1k-aging models with age estimates that were correlated r2>=0.8 with 3k-based age estimates were included for downstream analyses. Correlation between visit 1 (baseline, 2006–2010) and visit 2 (imaging visit 1, 2014+) age gaps are shown. b, Bar plot showing fractions of visit 1 extreme agers and non-visit 1 extreme agers that are extreme agers in the same organ in visit 2. Equivalent plot for youthful agers is shown on the right. c, Age gaps were grouped into bins of 0.5 standard deviation to determine changes in age gap bins across visits. Individual trajectories across visits for extreme immune agers are shown. Equivalent plot for youthful immune agers is shown at the bottom. d, Pie chart showing percent distribution of immune age gap bins in visit 2 (2014+) and visit 3 (2019+) for individuals who are extreme immune agers in visit 1. Equivalent plot for youthful immune agers is shown at the bottom. e, Stacked bar plot showing percent distribution of age gap bins in visit 2 and visit 3 for individuals who are extreme agers in visit 1. Equivalent plot for youthful agers is shown at the bottom.
Extended Data Figure 3.
Extended Data Figure 3.. Ageotypes versus disease risk and age gaps versus brain volume.
a, Cox proportional hazards regression was used to determine the association between extreme ageotypes and future disease risk, controlling for age and sex. Heatmap colored by age gap log(hazard ratio) is shown. *p<0.05, **q<0.05. Non-significant hazard ratios (p<0.05) were set to zero. b, Linear regression was used to determine the association between baseline organ age gaps and imaging visit 1 brain MRI volumes, controlling for age-at-blood-draw, age-at-imaging-visit-1, sex, and estimated total intracranial volume. Non-significant effect sizes (q<0.05) were set to zero. Red indicates positive associations, while blue indicates negative associations. c, Linear regression was used to determine the association between organ age gaps and years since disease diagnosis. Non-significant effects (q<0.05) were set to zero. d, Visualization of results from c. Organ age gap versus years since diagnosis shown.
Extended Data Figure 4.
Extended Data Figure 4.. Aging model coefficients
a, For all aging models, the top 20 aging model proteins and their weights are shown.
Extended Data Figure 5.
Extended Data Figure 5.. Brain aging proteins.
a, Scatterplot showing model weights from this study’s Olink-based aging model (y-axis) and Oh et. al 2023’s SomaScan-based brain aging model (x-axis). Spearman correlation and p-value shown. b, Scatterplot showing results from feature importance for biological aging (FIBA) algorithm to identify proteins in the brain aging model contributing to the brain age gap’s association with Alzheimer’s disease risk. FIBA score (y-axis) indicates Alzheimer’s disease risk effect size loss after permutation of protein values. X-axis indicates absolute protein weight in the brain aging model. Color indicates protein weight in the brain aging model. c, Mean gene expression of brain aging protein-encoding genes in GTEx tissue bulk RNA-seq data. d, Mean gene expression of brain aging protein-encoding genes in Haney et al. 2024 human brain scRNA-seq data.
Extended Data Figure 6.
Extended Data Figure 6.. Aging-mortality risk proteins.
a-d, Scatterplots showing results from feature importance for biological aging (FIBA) algorithm to identify proteins in the brain (a), conventional (b), artery (c), and immune (d) aging models that contribute to the model age gap’s association with future mortality risk. FIBA score (y-axis) indicates mortality risk effect size loss after permutation of protein values. X-axis indicates absolute protein weight in the aging model. Color indicates protein weight in the aging model. e, Forest plot showing results from Cox proportional hazards regression, testing the associations between extreme ager status and future all-cause mortality risk, controlling for age and sex. Age gap hazard ratios, 95% confidence intervals, number of events out of the total sample size are shown. f, Protein levels of youthful brain agers versus normal agers. The top ten (5 decrease with age, 5 increase with age) proteins based on mortality risk FIBA score are shown. Each protein was linearly adjusted for age, sex, and every other protein in the brain aging model before plotting. Proteins are ordered by the aging model coefficient. g, As in f, but for the immune aging model.
Figure 1.
Figure 1.. Plasma protein-derived organ age estimates in the UK Biobank.
a, Study design to estimate organ-specific biological age from plasma proteomics data in the UK Biobank. A protein was called organ-specific if the gene encoding the protein was expressed at least four-fold higher in one organ compared to any other organ in the GTEx organ bulk RNA-seq atlas. Organ-specific protein sets were used to train LASSO chronological age predictors. Samples from 10/21 centers (n=21,504) were used for training and the remaining samples (n=23,022) were used for testing. An ‘organismal’ model, which was trained on the levels of non-organ-specific (organ-shared) proteins, and a ‘conventional’ model, which was trained on all proteins on the Olink assay, were also developed and assessed. Model age gaps were calculated and then z-score normalized per organ to allow for direct comparisons across organs. Age gaps were characterized (Fig. 1), and tested for associations with disease risk (Fig. 2), modifiable lifestyle choices (Fig. 3), and mortality risk (Fig. 4). b, Pairwise correlation of organ age gaps from all samples. Inset histogram shows the distribution of all pairwise correlations, with the dotted line representing the mean. c, A Lasso regression model was used to predict conventional age based on organ ages and organismal age. Organismal, brain, and artery ages were sufficient to predict conventional age with r2=0.97. Relative weights are shown as a pie chart. d, Extreme agers were defined by a 1.5 standard deviation increase or decrease in at least one age gap. The mean organ age gaps of extremely youthful brain agers and accelerated multi-organ agers are shown.
Figure 2.
Figure 2.. Organ age estimates predicts future age-related disease.
a, Cox proportional hazards regression was used to test the association between age gaps and future disease risk, adjusted for age-at-blood-draw and sex. Heatmap colored by age gap log(hazard ratio) is shown. Heatmap columns are ordered by the Gini-coefficient of age gaps per disease. The most significant associations per disease are highlighted with black borders. The conventional age gap was never the most significant. The log fold change in hazard ratios between the organ with the most significant age gap versus the conventional age gap is shown below the heatmap. b, Body plots showing log hazard ratios from the heatmap in a, are shown for diseases of systemic aging. c, Body plots showing log hazard ratios from the heatmap in a, are shown for diseases of single-couple organ aging. d, Forest plot visualizing the results from the heatmap in a, for Alzheimer’s disease risk. Age gap hazard ratios and 95% confidence interval shown. e, Cumulative incidence plot showing increased risk of Alzheimer’s disease in extreme accelerated brain agers and decreased risk in youthful brain agers. f, Bar plot displaying the top 10 protein coefficients in the brain aging model. g, Pie chart displaying proportion of brain aging proteins assigned to each brain cell-type based on single-cell RNA-sequencing. Cell type was assigned based on cell type with the maximum expression of a given gene.
Figure 3.
Figure 3.. Organ age estimates are sensitive to modifiable lifestyle choices
a, Linear regression was used to determine the association between age gaps and modifiable lifestyle choices while accounting for age and sex. Heatmap colored by signed log10(q-value) is shown. Only significant (q<0.05) values are colored. b, Linear regression was used to determine the association between age gaps and drugs/supplement intake while accounting for age and sex. Only drugs with significant (q<0.05) youthful associations in at least two organs are shown. Heatmap is colored by signed log10(q-value). Only significant (q<0.05) values are colored. c, Linear regression was used to determine the association between age gaps versus early menopause and estrogen treatment together. Bar plot showing signed log10(p-value) for menopause and estrogen covariates is shown. d, Boxplot visualization of immune age gaps in individuals stratified by menopause status and estrogen treatment. Standard boxplot structure was used.
Figure 4.
Figure 4.. Accrual of aged organs progressively increases mortality risk while brain and immune system youth is associated with longevity
a, Bar plot showing results from Cox proportional hazards regression analyses, testing the associations between age gaps and future all-cause mortality risk, controlling for age, sex, (and blood cystatin C; and PhenoAge). Hazard ratios and 95% confidence intervals are shown. PhenoAge age gap hazard ratio (1.38) is shown as a dotted line for reference. b, Concordance indices from various Lasso-regularized Cox proportional hazard models trained to predict mortality risk. Performance across train and test centers is shown. Covariates for each model, in addition to age-at-blood-draw and sex, are labeled on the x-axis. c, Model coefficients shown for the combined model (OrganAge+PhenoAge+CysC) from b. d, Forest plot showing results from Cox proportional hazards regression, testing the associations between extreme ager status and future all-cause mortality risk, controlling for age-at-blood-draw and sex. Only significant (q<0.05) associations are shown. Age gap hazard ratios, 95% confidence intervals, number of events out of the total sample size are shown. e, Kaplan-Meier curves showing survival over 17-year follow-up of normal agers, progressive levels of multi-organ agers (2–4, 5–7, 8+ aged organs), and individuals with youthful brains or immune systems. f-g, Gene ontology pathway enrichment results (with all genes as background) from top ten brain (f) and immune (g) aging proteins by mortality risk FIBA score.

References

    1. López-Otín C., Blasco M. A., Partridge L., Serrano M. & Kroemer G. Hallmarks of aging: An expanding universe. Cell 186, 243–278 (2023). - PubMed
    1. Ahadi S. et al. Personal aging markers and ageotypes revealed by deep longitudinal profiling. Nat. Med. 26, 83–90 (2020). - PMC - PubMed
    1. Tian Y. E. et al. Heterogeneous aging across multiple organ systems and prediction of chronic disease and mortality. Nat. Med. 29, 1221–1231 (2023). - PubMed
    1. Oh H. S.-H. et al. Organ aging signatures in the plasma proteome track health and disease. Nature 624, 164–172 (2023). - PMC - PubMed
    1. Sehgal Raghav et al. Systems Age: A single blood methylation test to quantify aging heterogeneity across 11 physiological systems. bioRxiv 2023.07.13.548904 (2023) doi: 10.1101/2023.07.13.548904. - DOI - PubMed

Publication types