[Preprint]. 2024 Jun 14:2024.06.14.598925.
doi: 10.1101/2024.06.14.598925.

Early Developmental Origins of Cortical Disorders Modeled in Human Neural Stem Cells

Affiliations

Early Developmental Origins of Cortical Disorders Modeled in Human Neural Stem Cells

Xoel Mato-Blanco et al. bioRxiv. .

Update in

Abstract

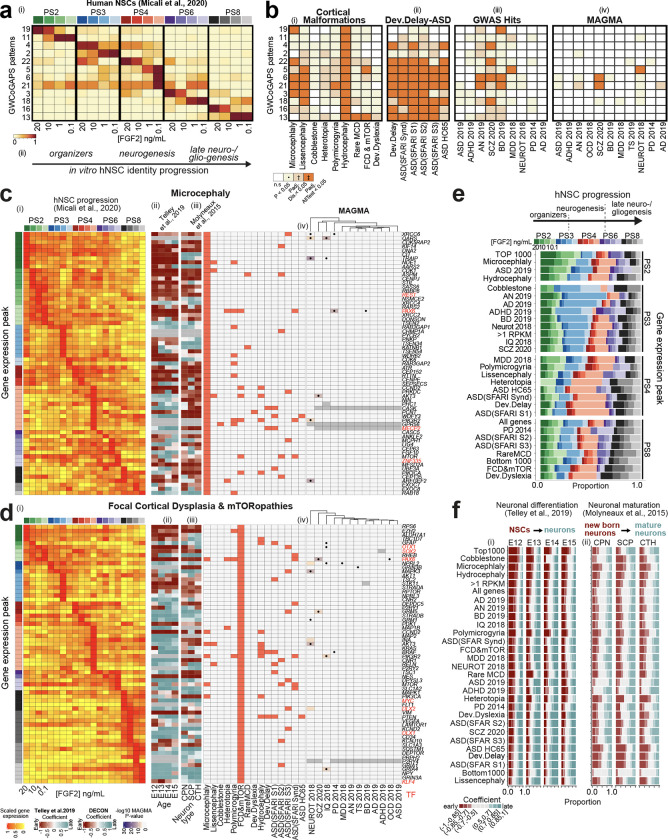
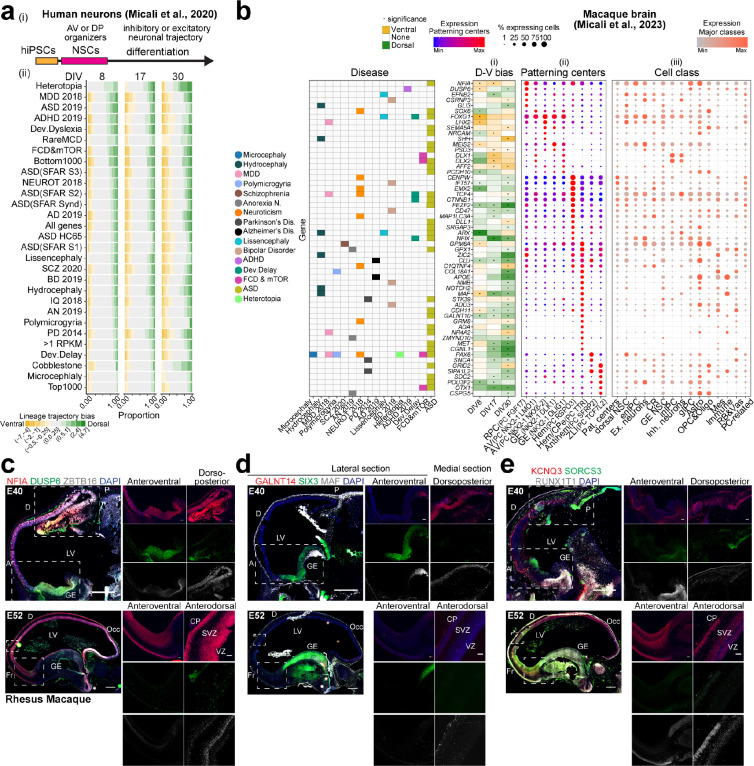
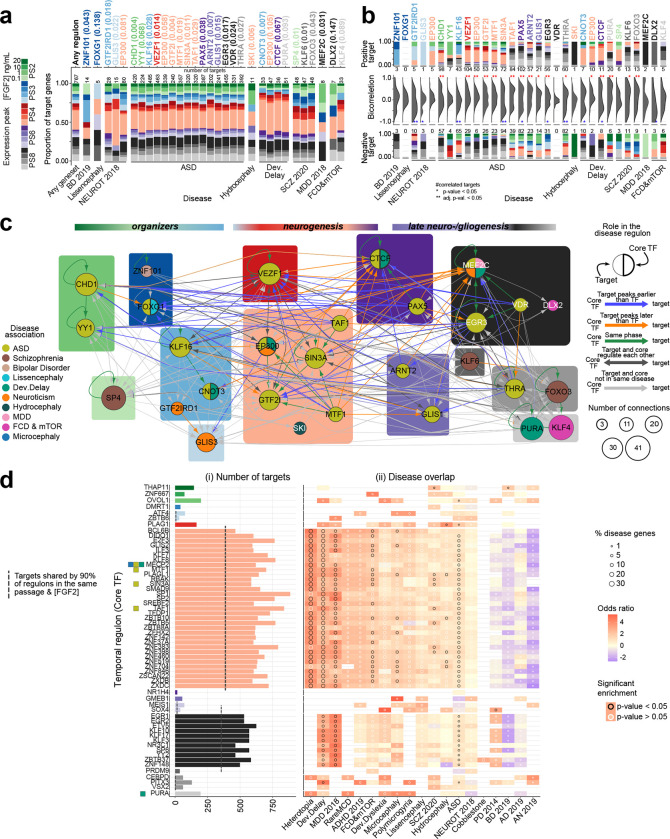
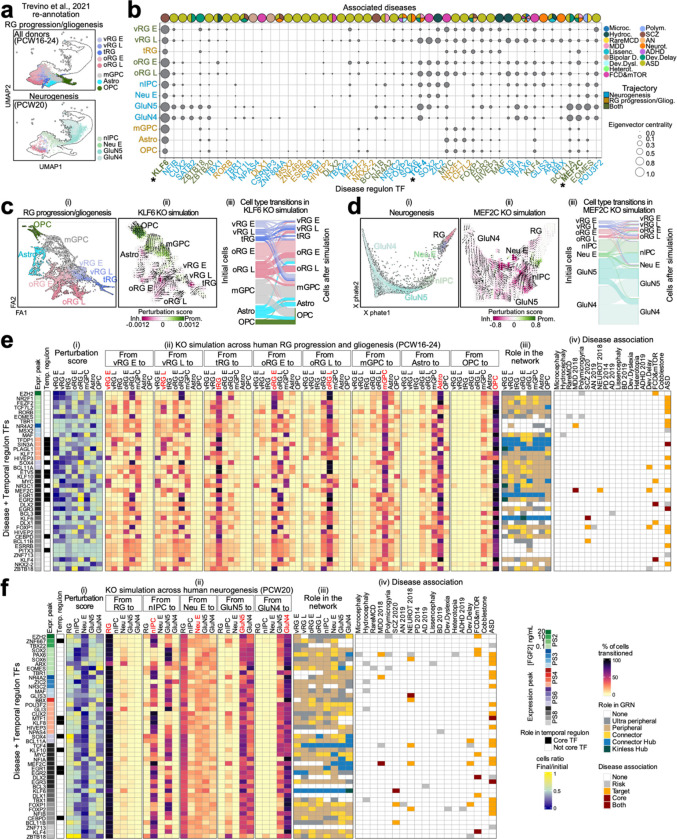
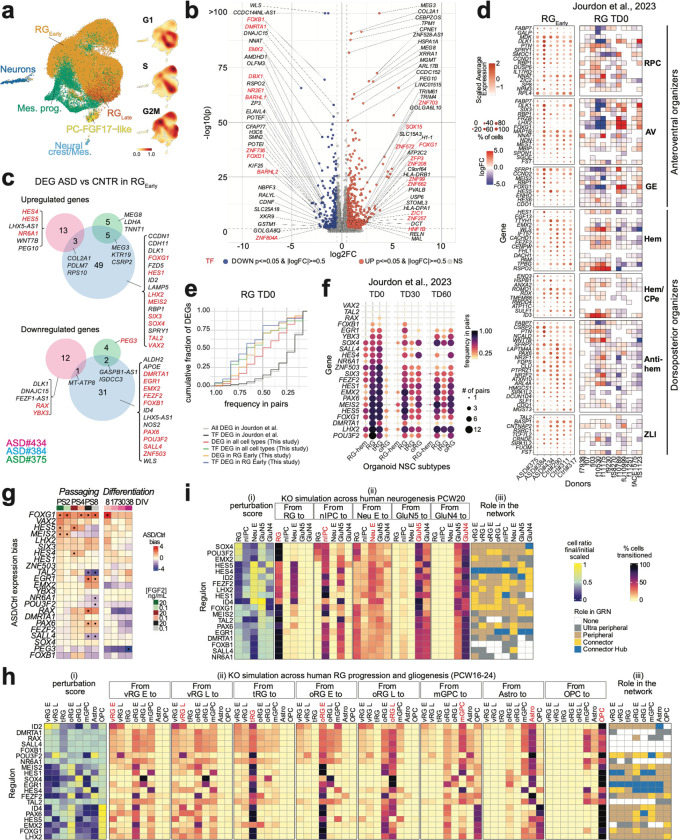
The implications of the early phases of human telencephalic development, involving neural stem cells (NSCs), in the etiology of cortical disorders remain elusive. Here, we explored the expression dynamics of cortical and neuropsychiatric disorder-associated genes in datasets generated from human NSCs across telencephalic fate transitions in vitro and in vivo. We identified risk genes expressed in brain organizers and sequential gene regulatory networks across corticogenesis revealing disease-specific critical phases, when NSCs are more vulnerable to gene dysfunctions, and converging signaling across multiple diseases. Moreover, we simulated the impact of risk transcription factor (TF) depletions on different neural cell types spanning the developing human neocortex and observed a spatiotemporal-dependent effect for each perturbation. Finally, single-cell transcriptomics of newly generated autism-affected patient-derived NSCs in vitro revealed recurrent alterations of TFs orchestrating brain patterning and NSC lineage commitment. This work opens new perspectives to explore human brain dysfunctions at the early phases of development.

Keywords: brain patterning; cortical disorders; neural stem cells.


Conflict of interest statement

COMPETING INTERESTS The authors declare no conflict of interest.

Figures

Fig. 1.
Fig. 1.. Expression dynamics of risk genes across cortical neurogenesis.
a) Selected GWCoGAPS patterns dissecting hNSC progression across passages and FGF2 doses . (ii) Schema of hNSC progression. b) Enrichment of disease gene sets in the GWCoGAPS patterns. n.s.: not significant; P: uncorrected P-values at p<0.05; Padj.Dis: significance correcting by each disease independently; Padj. AllTest: significance after multiple-testing correction using the whole dataset. c, d) (i) Expression levels of risk genes in FGF2-regulated hNSC progression, ordered by the temporal peak of expression (left column colored by passage and FGF2 dose). (ii-iii) Slope of gene expression change across (ii) neuronal differentiation of age-specific RG cells and (iii) maturation of different neuronal classes from developing mouse cortex. (iv) Disease associations of each gene (left panel), and log10 p-value of the MAGMA gene-level test of association with each GWAS dataset (right panel). Black dots indicate a top-hit gene in the corresponding GWAS publication, based on genome-wide significant loci. e) Proportion of genes for each disease showing expression peaks at each passage and FGF2 condition. Additional categories: all genes in the dataset; genes with average expression of >1 log2 RPKM (RPKM>1); 1000 genes at the top and bottom ranks of expression, respectively (top and bottom 1000). Categories are ordered as: PS2 and PS3 high to low, PS4 and PS8 low to high. No diseases with most genes in PS6 were found. f) Proportion of genes classified in different bins of expression fold change in (i) differentiating NSCs and (ii) maturing neurons. Coefficient=slope of expression change as described in panels c and d.
Fig. 2.
Fig. 2.. Expression of risk genes in brain organizers.
a) (i) Neuronal differentiation protocol. (ii) Proportion of disease-associated genes with dorsal or ventral bias across differentiation of the 6 hNSC lines . Fold change between dorsal and ventral expression binned in categories. All genes, RPKM>1, top and bottom 1000 categories as in Fig. 1. b) (i) PC markers with dorsal or ventral expression bias in the 6 hNSC lines at DIV 8–30 and (ii-iii) gene expression in (ii) PC clusters and (iii) other cell subtypes from the macaque dataset 37. Filtered PC markers with significant dorsoventral bias and disease association (left panel) are displayed. c-e) RNAscope of macaque sagittal fetal brains. Scale bar: 500 μm (panoramic), 100 μm (zoom-in).
Fig. 3.
Fig. 3.. Sequential gene regulatory networks across hNSC progression.
a) Proportion of target genes for each disease regulon with expression peak across passages and FGF2 conditions. Each core TF (top axis) is colored by its expression peak with p-value associated. The category “Any geneset/Any disease” includes all the genes of the disease regulons. Number of targets per regulon indicated on the top bar. b) Distribution of expression correlations between core TFs and their targets for each disease with positively and negatively correlated targets, and their number shown in the top and bottom summary bar plots, respectively. The color of the bars and TF labelling represent the expression peaks. Significantly high number of positively or negatively correlated targets are marked as ‘*’: p-value < 0.05, or ‘**’: corrected p-value < 0.05. c) Predicted gene regulatory network of the core TFs in the disease regulons with nodes representing genes colored by disease. For a TF found in multiple disease regulons, the thicker stroke indicates the disease in which it is a core TF; the node size indicates the connections to other core TFs. Background colors indicate gene expression peak in the in vitro hNSCs, same colors as in (a). Edge colors represent the expression peak relation between core TF and target, if they regulate each other, if associated with same or different disease. d) Temporal regulons ordered by the core TF peak expression across hNSC progression, same colors as in (a). Core TFs of disease regulons are indicated and colored by disease as in panel c. MECP2, although not a core TF in the disease regulons, is disease-associated. i) Number of targets for each regulon. ii) Overlap of temporal regulons with disease shown as odds ratio of the regulon gene enrichment in each disease (color of the grid), fraction of disease genes present in a regulon (dot size), and the significance of the enrichment (dot color).
Fig. 4.
Fig. 4.. In silico perturbation of regulon genes.
a) Trajectories from Trevino et al., 2021 analyzed in CellOracle: RG progression and gliogenesis for all donors (top); neurogenesis for each donor (bottom, only PCW20 is shown). b) Network centrality of disease-associated core TFs across RG progression, neurogenesis, and gliogenesis. The eigenvector centrality of a TF in the GRN of a cell type is shown by dots representing the influence of a gene in the network. Cell types (y axes) and TFs (x axes) are colored by the trajectory tested. The disease association of each TF is on the top bar. “*”: genes mentioned in the text. c, d) Partition-based graph abstraction (PAGA) map of RG maturation and gliogenesis (ci), and potential of heat diffusion for affinity-based transition embedding (PHATE) map of neurogenesis (di). KO simulation of (c) KLF6 and (d) MEF2C. ii) Trajectory perturbation: arrows simulate cell flow after KO perturbation with color representing trajectory change, promoted (green) or depleted (red). iii) Cell transitions from original cell identities (left) and after KO simulation (right). e, f) KO simulation of TFs across (e) RG maturation and gliogenesis and (f) neurogenesis. TFs associated with disease and core TF of temporal regulons, selected from the test in S10 are shown. Expression peak across the in vitro hNSC progression is next to each TF. Temporal regulon column shows core TFs in the temporal regulons. i) Perturbation score indicating gain or depletion of a given cell type. ii) Cell type transitions after KO simulations. Grids represent the fraction of the original cell type (labeled red on the top) and their final identity. iii) Regulatory role of every TF in each cell type. iv) Gene-Disease association, specifying core TFs and target genes in the disease regulons.
Fig. 5.
Fig. 5.. Analysis of GRNs in ASD patient-derived NSC lines.
(a) Cell subtypes and density of the cell cycle phases, in control- and ASD-patient-derived NSCs. (b) DEGs between grouped ASD versus grouped control RGEarly cell pseudo-bulk. Fold change (FC) expression ratio between ASD and control cells (x axis) versus the significance of the differential expression (y axis). Top DEGs are labeled. (c) DEGs in RGEarly in individual ASD samples versus grouped controls. (d) Expression level (color gradient) and percentage of cells (dot size) expressing patterning center genes from Micali et al., 2023 in RGEarly of each line (left), and differential expression of the same genes across ASD-control organoid pairs in the RG cluster at TD0, from Jourdon et al., 2023. (e) Cumulative fraction of DEGs identified in our study (y-axis, grouped into different DEG subsets by color) found to be differentially expressed in varying frequencies among the ASD-control pairs in RG cluster at TD0 from Jourdon et al., 2023 34 (x-axis). Distribution for all genes/TFs differentially expressed in Jourdon et al. is given as reference (black/grey lines). (f) TFs differentially expressed in RGEarly in individual ASD samples (from c) also found significantly perturbed (upregulated or downregulated) in at least 1 ASD-control pair in the DEG data from Jourdon et al., in different NSC subtypes, at 3 organoid stages (dot size shows number of ASD pairs significantly perturbed, dot color shows frequency among total number of pairs tested), sorted by recurrence in RG cluster at TD0. (g) Expression ratio of TFs found in c across sequential passaging and differentiation of ASD versus Control NSCs. (h, i) CellOracle KO perturbation of differentially expressed TFs from panel c identified across (h) RG progression/gliogenesis (20 TFs tested) and (i) neurogenesis (19 TFs tested in PCW20). Perturbation score (i), cell type transitions (ii), role of every TF in each cell type (iii) as in Fig. 4.

References

    1. Sur M. & Rubenstein J. L. Patterning and plasticity of the cerebral cortex. Science 310, 805–810, doi: 10.1126/science.1112070 (2005). - DOI - PubMed
    1. Storm E. E. et al. Dose-dependent functions of Fgf8 in regulating telencephalic patterning centers. Development 133, 1831–1844, doi: 10.1242/dev.02324 (2006). - DOI - PubMed
    1. Caronia-Brown G., Yoshida M., Gulden F., Assimacopoulos S. & Grove E. A. The cortical hem regulates the size and patterning of neocortex. Development 141, 2855–2865, doi: 10.1242/dev.106914 (2014). - DOI - PMC - PubMed
    1. Pattabiraman K. et al. Transcriptional regulation of enhancers active in protodomains of the developing cerebral cortex. Neuron 82, 989–1003, doi: 10.1016/j.neuron.2014.04.014 (2014). - DOI - PMC - PubMed
    1. O’Leary D. D., Chou S. J. & Sahara S. Area patterning of the mammalian cortex. Neuron 56, 252–269, doi: 10.1016/j.neuron.2007.10.010 (2007). - DOI - PubMed

Publication types

LinkOut - more resources