[Preprint]. 2024 Jun 10:2024.06.10.598346.
doi: 10.1101/2024.06.10.598346.

Transport and Organization of Individual Vimentin Filaments Within Dense Networks Revealed by Single Particle Tracking and 3D FIB-SEM

Affiliations

Transport and Organization of Individual Vimentin Filaments Within Dense Networks Revealed by Single Particle Tracking and 3D FIB-SEM

Bhuvanasundar Renganathan et al. bioRxiv. .

Update in

Abstract

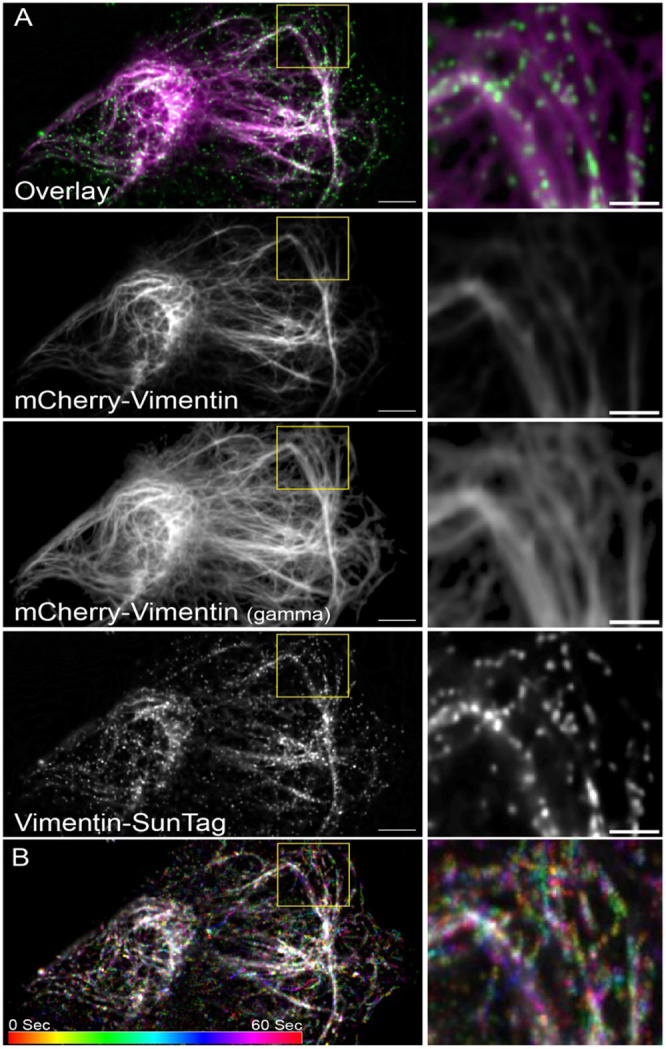
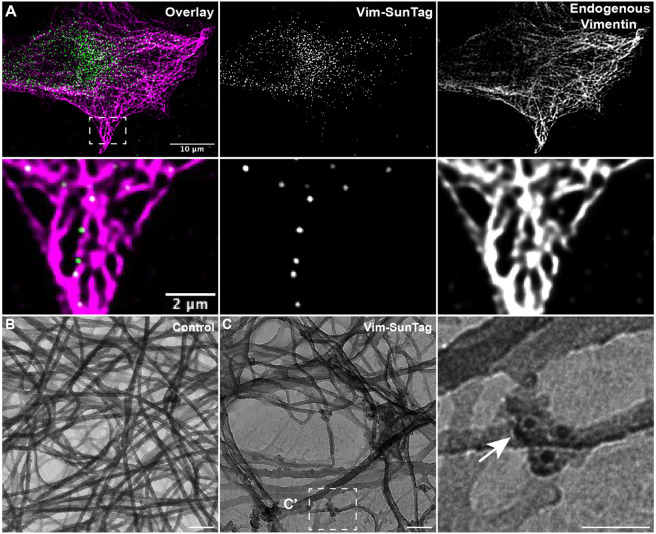
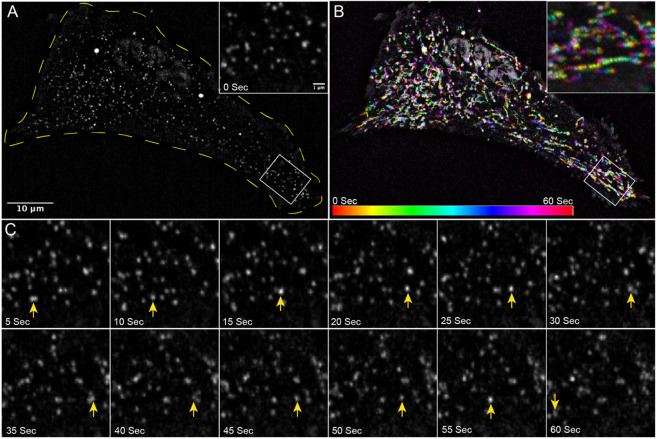
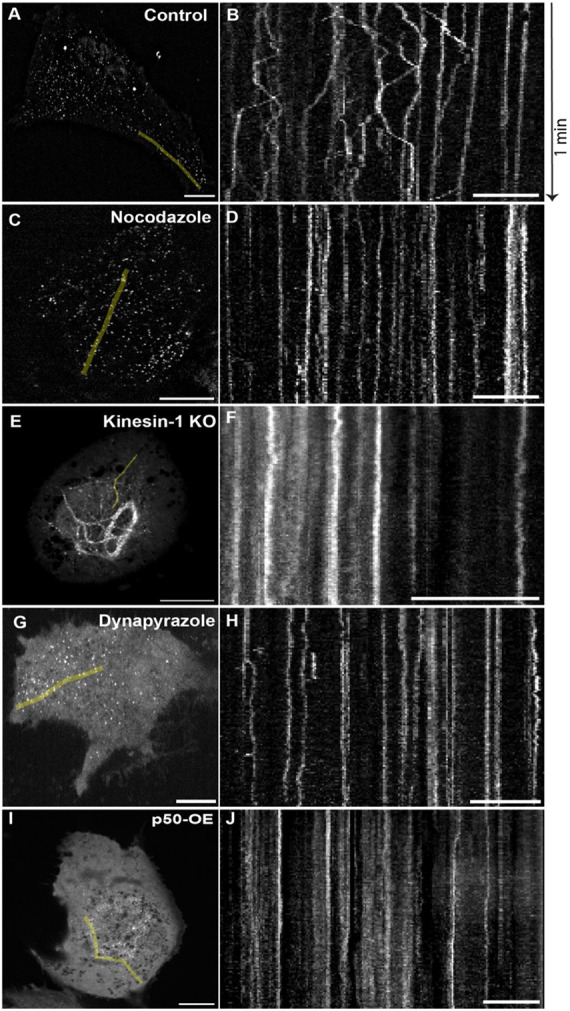
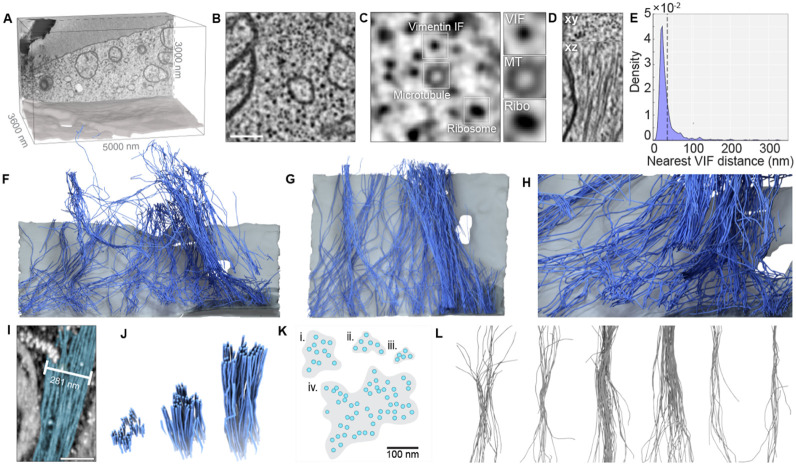
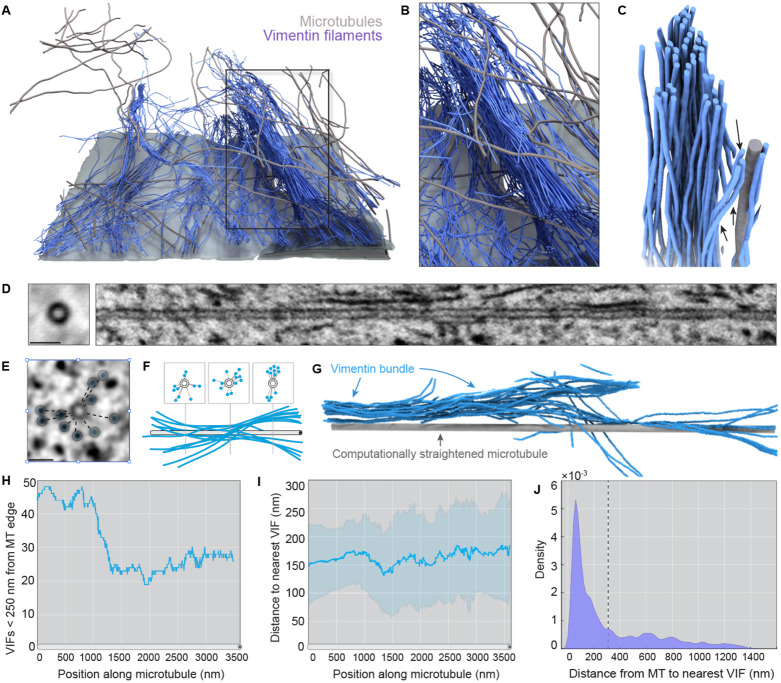
Single-particle tracking demonstrates that individual filaments in bundles of vimentin intermediate filaments are transported in the cytoplasm by motor proteins along microtubules. Furthermore, using 3D FIB-SEM the authors showed that vimentin filament bundles are loosely packed and coaligned with microtubules. Vimentin intermediate filaments (VIFs) form complex, tight-packed networks; due to this density, traditional ensemble labeling and imaging approaches cannot accurately discern single filament behavior. To address this, we introduce a sparse vimentin-SunTag labeling strategy to unambiguously visualize individual filament dynamics. This technique confirmed known long-range dynein and kinesin transport of peripheral VIFs and uncovered extensive bidirectional VIF motion within the perinuclear vimentin network, a region we had thought too densely bundled to permit such motility. To examine the nanoscale organization of perinuclear vimentin, we acquired high-resolution electron microscopy volumes of a vitreously frozen cell and reconstructed VIFs and microtubules within a ~50 μm3 window. Of 583 VIFs identified, most were integrated into long, semi-coherent bundles that fluctuated in width and filament packing density. Unexpectedly, VIFs displayed minimal local co-alignment with microtubules, save for sporadic cross-over sites that we predict facilitate cytoskeletal crosstalk. Overall, this work demonstrates single VIF dynamics and organization in the cellular milieu for the first time.


Conflict of interest statement

Statements and Declarations All authors declare no conflict of interest.

Figures

Figure 1:
Figure 1:. Vimentin-SunTag incorporates into endogenous vimentin filaments.
Cells co-transfected with Vimentin-SunTag constructs and vimentin-mCherry plasmid were imaged 24 hours post-transfection. Movies were collected for 1 minute at 2 frames per second (fps). A) Snapshot of the first frame (0 sec) from Video 1. Endogenous vimentin organization is visualized with vimentin-mCherry in magenta. Vimentin-SunTag in green decorates the length of endogenous vimentin filaments. The yellow box is zoomed in and shown in the right panel. Gamma correction was applied to vimentin-mCherry to visualize the thin vimentin filaments. B) Pseudo-colored maximum intensity time projection of the 60-second, 120-frame Vimentin-SunTag movie with an accompanying color bar. The yellow box is zoomed in and shown in the right panel. Scale bar: 5 μm for A and 1 μm for insets.
Figure 2:
Figure 2:. Vimentin-SunTag incorporates into mature vimentin filaments.
(A) Structured Illumination Microscopy (SIM) micrograph of a fixed RPE cell expressing Vimentin-SunTag (green) and immunolabeled for endogenous vimentin (magenta). The enlarged inset highlights colocalization of vimentin-SunTag puncta with endogenous vimentin. Platinum replica electron microscopy (PREM) micrograph of a (B) control cell and (C) vimentin-SunTag expressing cell. Black dots in panel C indicate immunogold particles tagged with anti-GFP antibodies. The white dotted box in panel C was enlarged and shown as C'. The white arrow points to immunogold particles decorating the endogenous vimentin filaments. Immunogold labeling clearly demonstrates that expressed vimentin-SunTag incorporates into individual vimentin filaments. Scale bar: 100 nm for E & F; 50 nm for F’-F”. Scale bar 10 μm (A), 2 μm (A inset), 100 nm (B and C), 50 nm (C insets).
Figure 3:
Figure 3:. Vimentin filaments are highly motile
Vimentin-SunTag constructs were transfected into RPE cells, 24 hours post-transfection, movies were collected for a total time of 1 minute at 2 frames per second (fps) (See also Video S1). (A) Snapshot of first frame (0 sec) from Video S1, displays the distribution of vimentin-SunTag (0 sec). The yellow line indicates cell boundary. White box has been zoomed and shown as inset. (B) Pseudo-colored maximum intensity time projection of 60 second, 120 frame vimentin-SunTag movie with accompanying color bar. White box has been zoomed and shown as inset. (C) Montage of the zoomed region from panel A, displaying snapshots at five-second intervals. A yellow arrow indicates the position of a specific vimentin-SunTag dot across different snapshots of the movie. Scale bar: 10 μm for A and B; 1 μm for inset in A, B and for snapshots in panel C.
Figure 4:
Figure 4:. Microtubule Motors Kinesin-1 and Cytoplasmic Dynein Drive Bidirectional Vimentin Filament Transport
RPE cells were transfected with vimentin-SunTag. After twenty-four hours, a time-lapse movie was captured at 2 fps for a total duration of 1 minute. The region of kymograph generated from each time sequence is represented as green line. Scale bar in microscopic images (A, C, E, G, and I) represents 10 μm and in kymographs (B, D, F, H, and J) represents 5 μm. A) First frame of the image sequence from a control cell (Video S2), and B) Kymograph from the control. C) First frame of the image sequence from a cell treated with 10 μM of Nocodazole (Video S3), and D) Kymograph from the Nocodazole-treated cell. E) First frame of the image sequence from a kinesin-1 knockout (KO) cell (Video S4), and F) Kymograph from the kinesin-1 KO cell. G) First frame of the image sequence from a cell treated with 5 μM of Dynpyrazole A (Video S5), and H) Kymograph from the Dynapyrazole A treated cell. I) First frame of the image sequence from a p50 overexpressing (OE) cell (Video S6), and J) Kymograph from the p50 overexpressing cell.
Figure 5:
Figure 5:. Reconstruction of vimentin filaments from FIB-SEM volumes reveals sparse, loosely organized vimentin bundles.
A. 3D bounding box that corresponds to the analyzed FIB-SEM volume. A single XY slice from the rear of the volume is projected on the back wall and a surface rendering of the ventral plasma membrane is shown below. B. A single 800 x 800 nm FIB-SEM slice from this volume. Scale bar= 200 nm. C. Enlarged FIB-SEM slice highlighting the cross-sectional profile of a VIF (top), a microtubule (MT, center), and a ribosome (Ribo, bottom). D. Orthogonal views of vimentin short (top) and long (bottom) axes. E. Probability density estimate of vimentin-vimentin first nearest neighbor distances from each of 273,000 vertices derived from 583 VIF tracings. (F-H) Orthographic 3D renderings of vimentin (blue) and ventral plasma membrane (gray) within the volume indicated in a. I. Maximum intensity projection of a raw FIB-SEM stack featuring a vimentin bundle (blue overlay). Scale = 200 nm. J. 3D rendering of a vimentin bundle clipped at various distances along its length. K. Segmentations of four VIF bundle cross-sections derived from a single FIB-SEM slice. Blue dots indicate single filaments, shaded regions indicate cross-sectional area of bundles. L. Aligned montage of vimentin bundles derived from the volume indicated in A.
Figure 6:
Figure 6:. Vimentin filaments are loosely coupled to microtubules.
a. 3D rendering of vimentin filaments (blue) with microtubules (gray) and ventral plasma membrane (light gray) in the target volume specified in Fig 5a. b. Enlarged view of a vimentin bundle (blue) and surrounding microtubules (gray). c. 3D reconstruction of vimentin filaments (blue) and a neighboring microtubule (gray). Filaments within the core of the bundle (black arrows) are positioned over 100 nm from the surface of the microtubule. Several filaments appear to diverge from the central bundle in order to align with the microtubule (black arrowheads). d. (left) Sum intensity projection of a center aligned 3500 nm microtubule trajectory. Scale bar = 50 nm. (right) Orthogonal view of MT center aligned track. By aligning the stack around the microtubule centroid, we have computationally straightened the microtubule, allowing for visualization of the local neighborhood around a single microtubule. e. Microtubule centered FIB-SEM slice with VIF cross-sections highlighted by blue circles and distances from the microtubule delineated by the dashed lines Scale bar = 50 nm. f. Cartoon schematic relating the XY view of microtubules and vimentin as seen in e to the expected appearance in the orthogonal view. g. 3D reconstruction of a computationally straightened microtubule (gray) and local vimentin filament bundle (blue). h. Total number of vimentin filaments within 249 nm of the centroid of a microtubule over its 3500 nm length. (Note: 249 nm from the center corresponds to 235 nm from the edge as MTs have a radius of 12 nm). i. Average distance of vimentin filaments from a single microtubule over its 3500 nm length within the reconstruction volume. Line = mean, error bars = standard deviation. j. Probability density estimates of distances between ~30,000 MT vertices and their nearest vimentin neighbors. Line indicates a mean distance of 309 nm.

References

    1. Barlan K., Rossow M.J., and Gelfand V.I.. 2013. The journey of the organelle: teamwork and regulation in intracellular transport. Curr Opin Cell Biol. 25:483–488. doi:10.1016/J.CEB.2013.02.018. - DOI - PMC - PubMed
    1. Biskou O., Casanova V., Hooper K.M., Kemp S., Wright G.P., Satsangi J., Barlow P.G., and Stevens C.. 2019. The type III intermediate filament vimentin regulates organelle distribution and modulates autophagy. PLoS One. 14:e0209665. doi:10.1371/journal.pone.0209665. - DOI - PMC - PubMed
    1. Burkhardt J.K., Echeverri C.J., Nilsson T., and Vallee R.B.. 1997. Overexpression of the dynamitin (p50) subunit of the dynactin complex disrupts dynein-dependent maintenance of membrane organelle distribution. Journal of Cell Biology. 139:469–484. doi:10.1083/jcb.139.2.469. - DOI - PMC - PubMed
    1. Chang L., Barlan K., Chou Y.H., Grin B., Lakonishok M., Serpinskaya A.S., Shumaker D.K., Herrmann H., Gelfand V.I., and Goldman R.D.. 2009. The dynamic properties of intermediate filaments during organelle transport. J Cell Sci. 122:2914–2923. doi:10.1242/jcs.046789. - DOI - PMC - PubMed
    1. Cheng F., Shen Y., Mohanasundaram P., Lindström M., Ivaska J., Ny T., and Erikss J.E.. 2016. Vimentin coordinates fibroblast proliferation and keratinocyte differentiation in wound healing via TGF-β-Slug signaling. Proc Natl Acad Sci U S A. 113:E4320–E4327. doi:10.1073/pnas.1519197113. - DOI - PMC - PubMed

Publication types

LinkOut - more resources