[Preprint]. 2024 Jun 14:2024.06.13.598710.
doi: 10.1101/2024.06.13.598710.

Deep brain stimulation induces white matter remodeling and functional changes to brain-wide networks

Affiliations

Deep brain stimulation induces white matter remodeling and functional changes to brain-wide networks

Satoka H Fujimoto et al. bioRxiv. .

Abstract

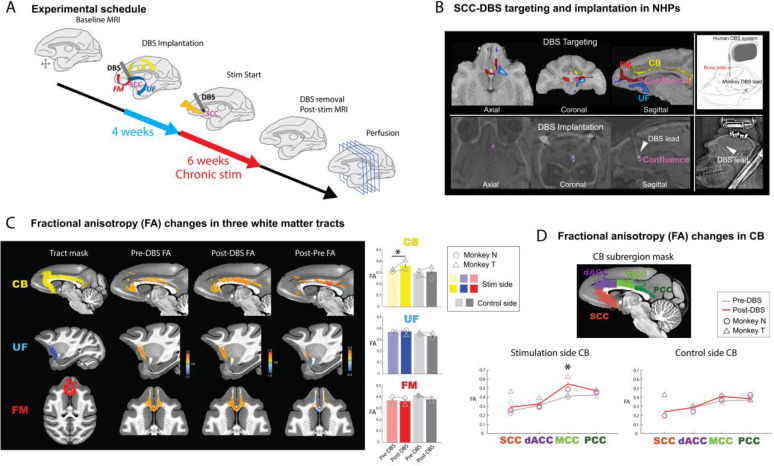
Deep brain stimulation (DBS) is an emerging therapeutic option for treatment resistant neurological and psychiatric disorders, most notably depression. Despite this, little is known about the anatomical and functional mechanisms that underlie this therapy. Here we targeted stimulation to the white matter adjacent to the subcallosal anterior cingulate cortex (SCC-DBS) in macaques, modeling the location in the brain proven effective for depression. We demonstrate that SCC-DBS has a selective effect on white matter macro- and micro-structure in the cingulum bundle distant to where stimulation was delivered. SCC-DBS also decreased functional connectivity between subcallosal and posterior cingulate cortex, two areas linked by the cingulum bundle and implicated in depression. Our data reveal that white matter remodeling as well as functional effects contribute to DBS's therapeutic efficacy.


Conflict of interest statement

Conflict of interest: HSM and KC receive consulting fees from Abbott Neuromodulation. The other authors declare no competing financial interest. SHF, AF, CE, AS, EA, GV, WGJ, LF, DF, BER and PER have no competing interests.

Figures

Figure 1:
Figure 1:. SCC-DBS changes fractional anisotrophy in the middle cinglum bundle.
A) Experimental timeline. Baseline T1, diffusion weighted images and resting state functional MRI were collected for each subject. Using the baseline diffusion weighted images, the SCC-DBS target, i.e. the confluence of the cingulum bundle, the uncinate fasciculus and the forceps minor, was visualized. Using a stereotactic approach, a SCC-DBS lead was implanted to target the confluence in one hemisphere. After a four week recovery period, chronic stimulation for six weeks was delivered. Just after removal of SCC-DBS, diffusion and functional MRIs were collected. On the day after MRI, the animal’s brains were extracted and prepared for histological assessment. B) Identification of white matter tracts and confirmation of SCC-DBS lead location. Top-left: Visualization of the confluence visualization of CB, FM and UF made from overlapped images of the three reconstructed white matter tracts using probabilistic tractography on DWI (monkey T) and a T1w pre-DBS surgery structural image. Pink circle denotes the confluence of the three white matter tracts: cingulum bundle (yellow), uncinate fasciculus (blue), forceps minor (red). Top-right: The scheme of SCC-DBS implantation. A miniaturized custom-made DBS lead was implanted into the confluence through a small craniotomy and connected to a human DBS system. Bottom-left: Post-DBS surgery CT confirmation of DBS lead location. The post-DBS implantation CT image (monkey T) is overlaid on a pre-DBS implantation T1w image. Bottom-right: The CT scout view of SCC-DBS implanted macaque head. C) Fractional anisotropy (FA) in the three white matter tracts before and after DBS. Extracted FA values are shown from the cingulum bundle (CB, top), the uncinate fasciculus (UF, middle), and the forceps minor (FM, bottom). The second column from left shows pre-DBS FA value, the third column is post-DBS FA value, and the most right column is the subtraction image of post-DBS FA and pre-DBS FA values. The color indicates FA value. The bar graph shows mean (+/− SEM) FA value of pre and post-DBS in each tract in each hemisphere. Each bar represents the averaged FA value extracted from voxels included in each white matter tract mask. Colored bars indicate the mean FA value in the tract mask on the stimulated hemisphere (yellow for CB, blue for UF, red for FM) and the gray bars are those on the control hemisphere. Lighter color/gray bars represent pre-DBS FA and darker bars demonstrate post-DBS FA. D) FA value changes after SCC-DBS in subparts of the cingulum bundle. Mean (+/− SEM) FA value in four subparts (SCC, dACC, MCC and PCC portion) of the CB before and after stimulation in stimulated (bottom left) and control hemisphere (bottom right). Symbols represent individual subjects (circle/triangle, monkey N/T, respectively). * p < 0.05, Tukey-Kramer test. Error bars are SEM.
Figure 2:
Figure 2:. Cellular-level remodeling of in the mid-cingulum bundle by SCC-DBS.
A) Sagittal and coronal images showing where changes in cellular level markers of white matter structures were assessed. B) Double stained images with CC1 (marker for myelinated oligodendrocytes, red) and DAPI (marker for nuclei, blue, x20 magnification) from monkeys N and T (top and bottom rows, respectively) for control (left) and stimulated hemispheres (right). Yellow scale bars indicate 100μm. C) Box plot of the ratio of CC1 and DAPI positive cells (%). Green line is the median of the CC1/DAPI ratio. Symbols denote means for each subject (circle/triangle, monkey N/T, respectively). **p < 0.01. D) Electron microscopy images of myelinated axons in control (left) and stimulated hemisphere (right) from the midcingulate portion of CB in monkey T. Yellow scale bars indicate 800nm. E/F) Scatter and box plot of g-ratio measurements from control (blue) and stimulated hemispheres (red). *** p < 0.001 from one-way repeated measures ANOVA.
Figure 3:
Figure 3:. SCC-DBS associated changes in functional connectivity
A) The mean whole brain functional connectivity (FC) with area 25 shown on sagittal (left) and axial (right) images before (top row) and after (bottom row) six weeks of SCC-DBS stimulation, as well as and the difference between post and pre (bottom row). Sagittal images of FC from the stimulated hemisphere are shown. Images are thresholded for FC with p < 0.05 and cluster size >20. The green circle represents the location of the active contact of SCC-DBS lead. B) Intrinsic brain network-level changes in FC after six weeks of SCC-DBS. Changes in FC between the stimulated area 25 (purple region) and six brain network hubs (hubs of the default mode network (DMN), the limbic network (LIM), the salience network (SAN), the central executive network (CEN), the sensorimotor network (SMN) and the visual network (VIS)) are shown. Symbols on the plots represent individual monkey mean normalized FC values (circle/triangle, monkey N/T, respectively). Error bars show SEM. * p < 0.05, ** p < 0.01, *** p < 0.001. Tukey-Kramer test.

References

    1. Zhdanava M., Pilon D., Ghelerter I., Chow W., Joshi K., Lefebvre P., Sheehan J. J., The Prevalence and National Burden of Treatment-Resistant Depression and Major Depressive Disorder in the United States. J Clin Psychiatry 82 (2021). - PubMed
    1. Lee D. J., Lozano C. S., Dallapiazza R. F., Lozano A. M., Current and future directions of deep brain stimulation for neurological and psychiatric disorders: JNSPG 75th Anniversary Invited Review Article. Journal of Neurosurgery JNS 131, 333–342 (2019). - PubMed
    1. Mayberg H. S., Lozano A. M., Voon V., McNeely H. E., Seminowicz D., Hamani C., Schwalb J. M., Kennedy S. H., Deep brain stimulation for treatment-resistant depression. Neuron 45, 651–660 (2005). - PubMed
    1. Bergfeld I. O., Mantione M., Hoogendoorn M. L. C., Ruhé H. G., Notten P., van Laarhoven J., Visser I., Figee M., de Kwaasteniet B. P., Horst F., Schene A. H., van den Munckhof P., Beute G., Schuurman R., Denys D., Deep Brain Stimulation of the Ventral Anterior Limb of the Internal Capsule for Treatment-Resistant Depression: A Randomized Clinical Trial. JAMA Psychiatry 73, 456–464 (2016). - PubMed
    1. Ríos A. S., Oxenford S., Neudorfer C., Butenko K., Li N., Rajamani N., Boutet A., Elias G. J. B., Germann J., Loh A., Deeb W., Wang F., Setsompop K., Salvato B., de Almeida L. B., Foote K. D., Amaral R., Rosenberg P. B., Tang-Wai D. F., Wolk D. A., Burke A. D., Salloway S., Sabbagh M. N., Chakravarty M. M., Smith G. S., Lyketsos C. G., Okun M. S., Anderson W. S., Mari Z., Ponce F. A., Lozano A. M., Horn A., Optimal deep brain stimulation sites and networks for stimulation of the fornix in Alzheimer’s disease. Nat Commun 13, 7707 (2022). - PMC - PubMed

Publication types