[Preprint]. 2025 Apr 24:2023.02.28.530247.
doi: 10.1101/2023.02.28.530247.

Identification and characterization of early human photoreceptor states and cell-state-specific retinoblastoma-related features

Affiliations

Identification and characterization of early human photoreceptor states and cell-state-specific retinoblastoma-related features

Dominic W H Shayler et al. bioRxiv. .

Update in

Abstract

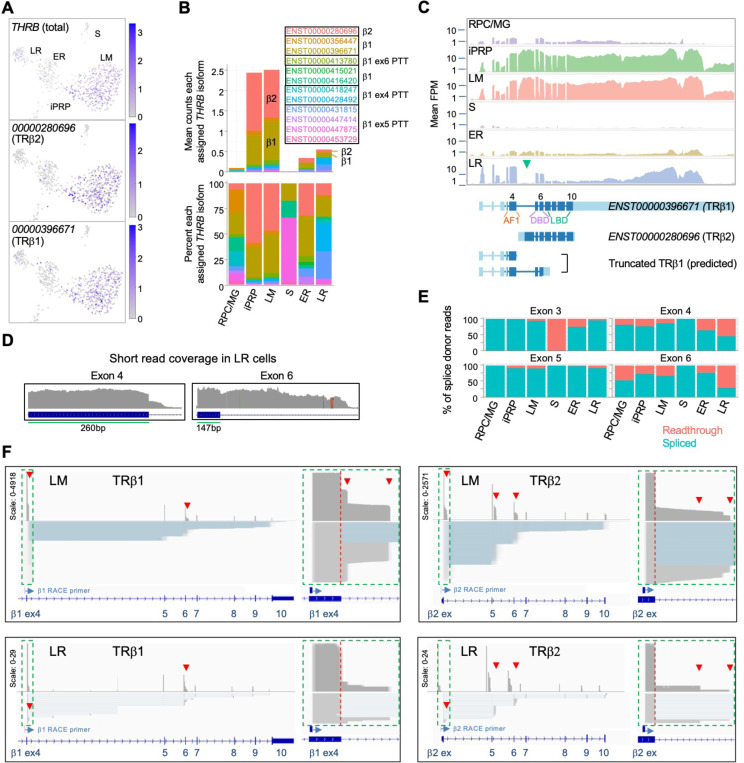
Human cone photoreceptors differ from rods and serve as the retinoblastoma cell-of-origin, yet the developmental basis for their distinct behaviors is poorly understood. Here, we used deep full-length single-cell RNA-sequencing (scRNA-seq) to distinguish post-mitotic cone and rod developmental states and identify cone-specific features that contribute to retinoblastomagenesis. The analyses revealed nascent, immediately post-mitotic cone- and rod precursor populations characterized by higher THRB or NRL regulon activities, immature and maturing cone and rod precursors with concurrent cone- and rod-related gene and regulon expression, and distinct early and late cone and rod maturation states distinguished by maturation-associated declines in RAX regulon activity. Cell-state-specific gene expression features inferred based on full-length scRNA-seq were consistent with past single nucleus 3' RNA-seq analyses. Beyond the cell state characterizations, full-length scRNAseq revealed that both L/M cone and rod precursors co-expressed NRL and THRB RNAs, yet they differentially expressed functionally antagonistic NRL and THRB isoforms and prematurely terminated THRB transcripts. Moreover, early L/M cone precursors exhibited successive expression of several lncRNAs along with MYCN, which composed the seventh most L/M-cone-specific regulon, and SYK, which was implicated in the cone precursors' proliferative response to RB1 loss. These findings reveal previously unresolved photoreceptor precursor states and suggest a role for early cone-precursor-intrinsic SYK expression in retinoblastoma initiation.


Figures

Figure 1:
Figure 1:. Photoreceptor-enriched full-length scRNA-seq of developing human retina.
A. Overview of sample collection and sequencing. B, C. UMAP plots showing low-resolution cell type clusters (B) and ages (C). D. Expression of marker genes for RPC/MGs (LHX2), rods (NR2E3), S cones (OPN1SW), L/M cones (THRB). Insets: Gene expression violin plots (from left to right): RPC/MG (red), iPRP (brown), LM cone (green), S cone (teal), early rod (blue), late rod (pink). E. Expression of markers of rod maturation (PDE6G, RHO) and cone maturation (PDE6H, OPN1LW). Arrowheads: Late-maturing RHO+ rods (top), late-maturing OPN1LW+ cones (bottom). See Figure S2 for additional examples. UMAP and violin plots for any gene or transcript isoform can be produced at https://docker.saban.chla.usc.edu/cobrinik/app/seuratApp/.
Figure 2:
Figure 2:. Regulon-defined RPC and photoreceptor precursor states
A. Ward-clustered heatmap of the highest scoring SCENIC regulons in each cluster, displaying Z-score normalized regulon activities. Late = late-maturing L/M cones. B. Box plot of RAX regulon area under the curve (AUC) values for early and late L/M cones and rods. *, p<0.005; ***, p<0.0005, Dunn test. C,D. UMAP plots of regulon AUC values for (C) PAX6 (RPC/MG) and E2F2 (RPC), and (D) OTX2 (photoreceptors and photoreceptor-committed RPCs), NRL (rod) and THRB and ISL2 (L/M cone).
Figure 3:
Figure 3:. Differential expression of NRL isoforms in rod and cone precursors.
A. Expression of NRL gene and the most highly assigned Ensembl isoforms ENST00000397002 (FL-NRL) and ENST00000560550 (Tr-NRL). B. Mean NRL isoform assignments for clusters defined in Figure 1B, presented as total counts (top) and percentage of total counts (bottom). Significance for LM vs. ER fold change, colored by isoform. ****, p <0.0002; *****, <0.000001 (bootstrapped Welch’s t-test). Ensemble transcript IDs shown in color with structures shown in Figure S4B. C. Top: Mean read counts (fragments per million, FPM) across Ensembl NRL exons for each cluster. Bottom: Transcript structures numbered according to amino acid positions. Minimal transactivation domain (MTD) in green. Arrowheads: Red/black: First exons where red is higher of two peaks. D. Relative difference box plot of raw reads mapping to truncated (Tr) and full length (F) transcript first exons in each cell, according to cluster. Relative difference is the difference in reads mapping to truncated and full-length NRL first exons (Tr-F) divided by the sum of both (Tr+F). Values >0 indicate more reads assigned to truncated isoform, values < 0 indicate more reads assigned to full-length isoform. ***, p <0.0001 (post-hoc Dunn test). E. NRL and RXRγ immunostaining and RNA FISH with probes specific to truncated Tr-NRL exon 1T (green puncta) and FL-NRL exons 1 and 2 (red puncta) in FW16 retina. Boxed regions enlarged at right show an RXRγlo, NRL+ rod with one Tr-NRL and six FL-NRL puncta (top) and an RXRγhi, NRL cone with one Tr-NRL and no FL-NRL puncta (bottom), indicated with same-color arrows. Scale bar: 10 μm. F. Ratio of fluorescent puncta observed in experiment depicted in (E) for NRL+ or RXRγhi cells where Tr puncta >0. ***; p <0.0005 (Welch’s t-test). G. Long-read nanopore sequencing of pooled 5’ RACE reactions initiated with NRL exon 3 primers and performed on cDNA libraries from 23 ER cells (top) and 21 LM cells (bottom). Each schematic shows total exon coverage (above) and individual transcripts (below), where expressed sequences are grey and introns light blue. Full-length (FL), alternatively spliced or internally initiated exon 2 (Δex2), and truncated (Tr) transcripts are indicated by brackets. Red arrow: Transcripts resembling DD10, with internal exon 2 transcription initiation and premature splicing to exon 3. Ensembl FL-NRL and Tr-NRL transcript isoforms and RACE primer positions are shown below. H. Top: PDE6B-luciferase reporter activity in NIH-3T3 cells transfected with indicated amounts (ng) of pcDNA4-C-EF1α and derived FL-NRL and Tr-NRL constructs. Bottom: PDE6B-luc reporter and pcDNA4-C-EF1α expression constructs. Blue box = NRL response element. Error bars = standard deviation of triplicate measurements. *, p <0.05; **, <0.005 (Student’s t-test). Data representative of two experiments in NIH-3T3 and one in 293T.
Figure 4:
Figure 4:. Differential expression of THRB isoforms in rod and cone precursors.
A. Expression of THRB and highly assigned isoforms ENST00000280696 (encoding TRβ2) and ENST00000396671 (TRβ1). B. Mean THRB isoform assignments for each cluster presented as counts (top) and percentage of counts (bottom); Ensemble transcript IDs shown in color with β2, β1, and β1 PTT isoform structures as in Figure S6B. C. Top: Mean read counts across Ensembl THRB exons. Bottom: Transcript structures for TRβ1, TRβ2, and two TRβ1 truncations. Green arrowhead: First TRβ2 exon. ENST00000396671 exon numbers are indicated above and protein domains (AF1, DNA-binding (DBD), and ligand binding (LBD)) below. D. Read coverage for LR cells across THRB exons 4 and 6 splice donor sites. E. Percentage of exon splice donor reads that are spliced or readthrough to the subsequent intron. F. Long-read sequencing of pooled 3’ RACE reactions initiated with exon 4 (left) or TRβ2 exon 1 (right) performed on cDNA libraries from 21 LM cells (top) and 5 LR cells (bottom). Schematics show total coverage (above) and individual transcripts (below). TRβ1 and TRβ2 first exons (green boxes) are enlarged at right. Red arrowheads: intronic premature transcription termination (PTT).
Figure 5:
Figure 5:. Two post-mitotic photoreceptor precursor populations expressing rod or cone markers.
A. UMAP plot colored by high resolution clusters. B. RNA velocity plots with cell clusters as in A. C. Enlarged view highlighting RPC and MG clusters (left), RPC-localized iCP and iRP clusters (middle), and RNA velocity (right). Black line: limit of RPC-localized region. Arrows depict inferred trajectories. D. Violin plots depict expression of selected genes in RPC, MG, and RPC-localized iCP and iRP cells. Colored asterisks compare cluster of same color to cluster at right of line. E. SCENIC regulon violin and box plots for RPC-localized cells in each cluster, selected from most specific regulons for MG, RPC, ER and LM clusters. ^, pAdj <0.1; *, <0.05; **, <0.005; ***, <0.0005 (post-hoc Dunn test).
Figure 6:
Figure 6:. An iCP sub-population with cone- and rod-related RNA co-expression.
A-C. UMAP ‘bridge’ region cells colored by ER and iCP cluster and RNA velocity (A), rod and cone marker gene expression (B), and NRL and THRB regulon activity (C, arrows indicate cells with both regulon signals). D. Box plot of Z-score-normalized NRL and THRB regulon AUCs for each cluster; Bridge ER and Bridge iCP represent cells present in the UMAP region in panels A-C.
Figure 7:
Figure 7:. Cone-related GNAT2 and rod-related NR2E3 RNA co-expression in human cone precursors.
A,B. Tiled composite fluorescence image of FW14 retinal section after immunofluorescence staining of RXRγ and NR2E3 and RNA FISH of GNAT2 and NR2E3 (A) and diagram of the same section indicating the most peripheral (i.e., youngest and least mature) and most central (i.e., oldest and most mature) rods and cones (B). Boxes indicate regions further evaluated in Supplementary Figure S12 and quantitated in panels C and D. C,D. Quantitation of (C) outermost and (D) middle (i.e., sub-outermost) NBL photoreceptor precursors expressing combinations of RXRγ and NR2E3 proteins and GNAT2 and NR2E3 RNAs (n.b., italics are used for RNAs, non-italics for proteins). E. Patterns of GNAT2 and NR2E3 RNA and RXRγ and NR2E3 protein expression inferred from in situ hybridization and immunofluorescence staining. RXRγ is expressed in the outermost NBL starting in the far periphery, consistent with cone precursors, and in middle NBL cells, starting more centrally, consistent with rod precursors. GNAT2 and NR2E3 RNA co-expression in outermost NBL cells lacked NR2E3 protein, representing putative cone precursors. RXRγ+ retinal ganglion cells in the inner NBL and ganglion cell layer not shown.
Figure 8.
Figure 8.. Developmental expression of early cone and rod precursor markers.
A. UMAP plots of iCP marker genes CHRNA1, ONECUT1, CTC-378H22.2, and S100A (see Figure S9A) and previously identified photoreceptor precursor markers ATOH7 and DLL3. B-D. Combined RXRγ/NRL immunohistochemical staining and CHRNA1 RNA FISH of FW12 retina. B. Tiled images of retina section with nuclei stained with DAPI. White boxes: fields used for quantitative fluorescent imaging. Distances along apical edge of tissue marked in mm from midpoint of central image (0 mm, C). *: Imaged region shown in C. Scale bar = 500 μm. C. Top: Retinal nuclear and cellular segmentation and identification of cells as RXRγ+ (green outline) or NRL+ (red outline). Yellow box: Field shown below. Bottom: RXRγ or NRL immunofluorescence staining with CHRNA1 FISH. Arrows: RXRγ+,CHRNA1+ (green), NRL+,CHRNA1+ (yellow). Scale bars = 15 μm. D. Quantitation of fluorescent puncta in RXRγ+ and NRL+ cells by image field. X-axis: Distance from the midpoint of each image to retina center (0 mm, C). **, p <0.005 (Wald test, images from 0–6 mm).
Figure 9:
Figure 9:. L/M cone subcluster marker genes, regulons, and pseudotemporal trajectory with successive lncRNA gene expression.
A. Violin plots of high-resolution cone cluster marker genes with increasing maturation-associated expression. All significant differences between adjacent clusters are indicated. B. Violin plots of regulons with highest LM1–4 cone cluster specificity scores. *, p <0.05; **, <0.005; ***, <0.0005 (post-hoc Dunn test). C. Pseudotemporal trajectory through the L/M cone population derived with Monocle 3. *: Root cell used to define endpoint. The pseudotime trajectory may be related to LM1-LM4 subcluster distributions in Figure 5A. D. Trendlines of relative count expression (left) and UMAP plots for lncRNAs correlating with early or late-upregulating modules. Line color matched to labels. E, F. Combined RXRγ immunohistochemical staining and FISH of lncRNAs on FW16 retina. E. Tiled images of retina with nuclei stained with DAPI. White boxes: fields used for quantitative fluorescent imaging. Distances along apical edge of tissue marked in mm from fovea to ciliary margins. Scale bar = 500 μm. Asterisks identify fields shown in F. F. Combined RXRγ immunostaining and multiplex FISH for four lncRNAs, of which two are shown in peripheral and central retina regions. Arrows: White: RXRγ/CTC-378H22.2+. Magenta: RXRγ/HOTAIRM1+. Blue: RXRγ/CTD-2034I21.2+. Green: RXRγ/RP13–143G15.4+. Scale bar = 15 μm. G. Quantitation of lncRNA fluorescent puncta assigned to RXRγ+ cells after segmentation. Colored bars mark lncRNA expression regions as described in the text. Arrows indicate significant count differences between images (p <0.05, Wald test).
Figure 10:
Figure 10:. Cone intrinsic MYCN and SYK associated with proliferative response to pRB loss.
A. Immunofluorescent staining shows high MYCN in ARR3+ cones but not in NRL+ rods in FW18 retina. B-D. UMAP plots of MYCN expression (B), MYCN regulon activity (C), and SYK expression (D). E. SYK and MYCN gene expression violin plots by cluster. *, p <0.05; ns = not significant (t-test). F. Immunohistochemical staining of SYK and cone arrestin (ARR3) in FW18 and FW16 retinae. Green arrow: ARR3+, SYK+. White arrow: ARR3+, SYK–. Scale bar = 25 μm. G. Top: Effect of SYK inhibitor GS-9876 on Ki67 expression in RXRγ+ cones from FW16.5 retina co-transduced with YFP and shRB1- or control shSCR-shRNA. Values represent means of three analyses from two treatment replicates. Error bars: standard deviation. *, p <0.05; **, <0.005 (Student’s T-test with equal variance, 2-tailed). RXRγ+ cells: Experiment 1, n=1,340. Experiment 2, n=804. Range 107 – 366 cells per condition. Bottom: Example of Ki67, YFP, and RXRγ co-immunostaining with DAPI+ nuclei (yellow outlines). Arrows: Ki67+, YFP+, RXRγ+ nuclei. H. Model of SYK expression in cone maturation and retinoblastoma development.

References

    1. Shiau F., Ruzycki P.A., and Clark B.S. (2021). A single-cell guide to retinal development: Cell fate decisions of multipotent retinal progenitors in scRNA-seq. Dev Biol 478, 41–58. 10.1016/j.ydbio.2021.06.005. - DOI - PMC - PubMed
    1. Brzezinski J.A., and Reh T.A. (2015). Photoreceptor cell fate specification in vertebrates. Development 142, 3263–3273. 10.1242/dev.127043. - DOI - PMC - PubMed
    1. Emerson M.M., Surzenko N., Goetz J.J., Trimarchi J., and Cepko C.L. (2013). Otx2 and Onecut1 promote the fates of cone photoreceptors and horizontal cells and repress rod photoreceptors. Dev Cell 26, 59–72. 10.1016/j.devcel.2013.06.005. - DOI - PMC - PubMed
    1. Ng L., Lu A., Swaroop A., Sharlin D.S., Swaroop A., and Forrest D. (2011). Two Transcription Factors Can Direct Three Photoreceptor Outcomes from Rod Precursor Cells in Mouse Retinal Development. The Journal of Neuroscience 31, 11118–11125. 10.1523/JNEUROSCI.1709-11.2011. - DOI - PMC - PubMed
    1. Hendrickson A., Possin D., Vajzovic L., and Toth C.A. (2012). Histologic Development of the Human Fovea From Midgestation to Maturity. Am J Ophthalmol 154, 767–778.e2. 10.1016/j.ajo.2012.05.007. - DOI - PMC - PubMed

Publication types