[Preprint]. 2024 Jun 13:2024.06.13.598910.
doi: 10.1101/2024.06.13.598910.

Human cytomegalovirus induces neuronal gene expression for viral maturation

Affiliations

Human cytomegalovirus induces neuronal gene expression for viral maturation

Laurel E Kelnhofer-Millevolte et al. bioRxiv. .

Update in

Abstract

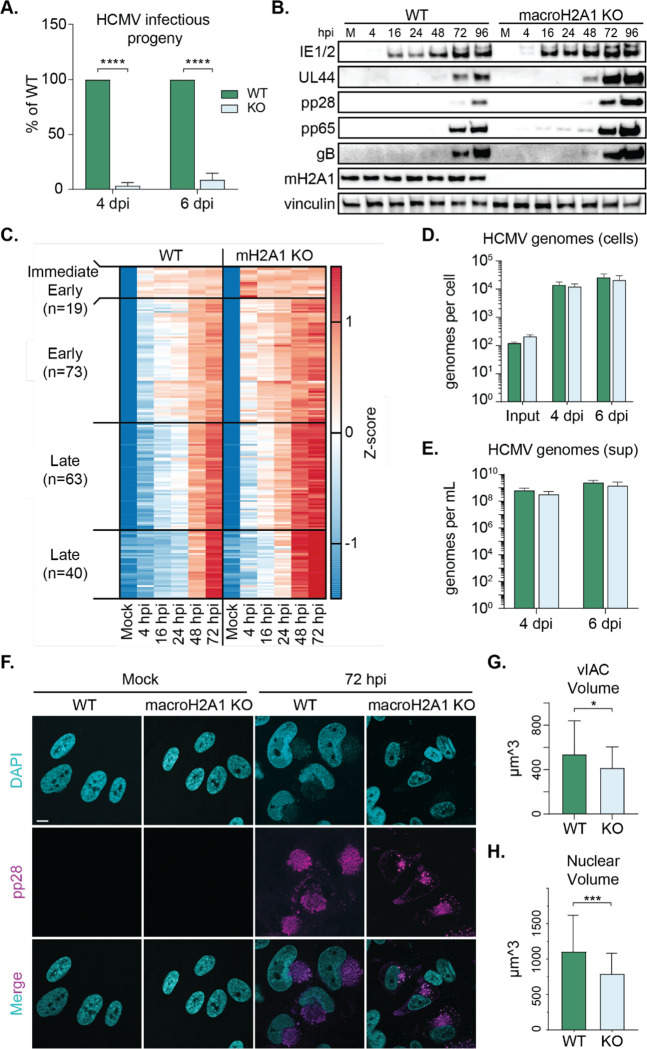
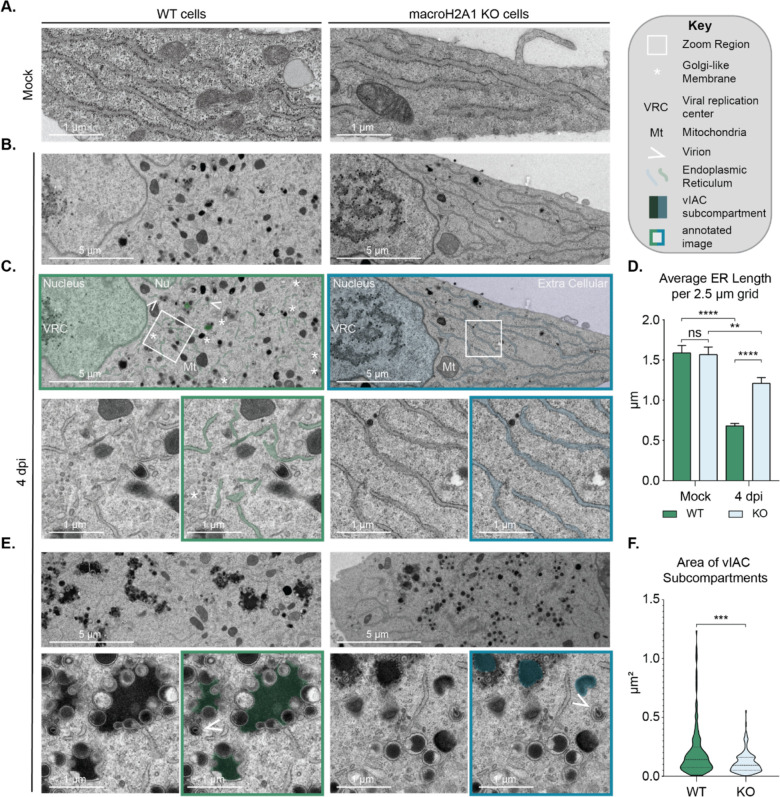
Viral invasion of the host cell causes some of the most dramatic changes in biology. Human cytomegalovirus (HCMV) extensively remodels host cells, altering nuclear shape and generating a cytoplasmic viral-induced assembly compartment (vIAC). How these striking morphology changes take place in the context of host gene regulation is still emerging. Here, we discovered that histone variant macroH2A1 is essential for producing infectious progeny. Because virion maturation and cellular remodeling are closely linked processes, we investigated structural changes in the host cell upon HCMV infection. We discovered that macroH2A1 is necessary for HCMV-induced reorganization of the host nucleus, cytoskeleton, and endoplasmic reticulum. Furthermore, using RNA-seq we found that while all viral genes were highly expressed in the absence of macroH2A1, many HCMV-induced host genes were not. Remarkably, hundreds of these HCMV-induced macroH2A1-dependent host genes are associated with neuronal synapse formation and vesicle trafficking. Knock-down of these HCMV-induced neuronal genes during infection resulted in malformed vIACs and smaller plaques, establishing their importance to HCMV infection. Together, our findings demonstrate that HCMV manipulates host gene expression by hijacking a dormant neuronal secretory pathway for efficient virion maturation.


Figures

Figure 1.
Figure 1.
HCMV requires macroH2A1 for efficient production of infectious progeny, but not protein, RNA, or genome accumulation. A) Infectious progeny produced from HCMV infected WT and macroH2A1 KO HFF-T cells quantified by plaque assay at 4 or 6 days post infection (dpi) as indicated. Viral yield is indicated as the percent yield compared to wild type, with errors bars representing SEM. P < 0.0001 at both time points by unpaired T-test. N=3 biological replicates. B) Representative western blots of viral proteins in cells as in (A) during HCMV infection at 4, 16, 24, 48, 72, and 96 hours post infection (hpi) compared to mock (M). These time points correspond to immediate early gene expression (4 hpi), early gene expression (16 hpi), genome replication (24 hpi), and late gene expression (48 and 72 hpi). Vinculin is shown as loading control. C) Heat map of viral genes measured by RNA sequencing at 4, 16, 24, 48, and 72 hpi compared to mock (M). N=3 biological replicates. D) Droplet digital PCR (ddPCR) quantification of HCMV genomes extracted from infected WT and macroH2A1 KO cells at 4 hours (input), 4, and 6 dpi. Bar graphs show the mean with error bars indicating SEM. No significance at any time point by paired T-test. E) ddPCR quantification of HCMV genomes released from cells as in (D) and isolated from supernatants (sups) at 4 and 6 dpi after nuclease treatment, indicating encapsidated genomes. Error bars represent the SEM of three biological replicates. No significance at any time point by paired T-test. F) Representative immunofluorescence images of WT and macroH2A1 KO cells during HCMV infection at mock and 72 hpi. DAPI is shown in cyan, and viral protein pp28 is shown in magenta. Scale bar represents 10 μm. G) Quantification of the volume of viral induced assembly compartments (vIACs) measured by pp28 fluorescence. Bar graphs show mean with error bars indicating SEM. P < 0.05 by unpaired T-test. N>40 vIACs. H) Quantification of nuclear volume of WT and macroH2A1 knockout HCMV-infected cells at 72 hpi. Bar graphs show mean with error bars indicating SEM. p < 0.001 by unpaired T-test. N>40 cells.
Figure 2.
Figure 2.
HCMV cellular remodeling and vIAC formation is dependent on macroH2A1. A) Representative transmission electron microscopy images of mock-treated WT and macroH2A1 KO HFF-T cells showing the uninfected state of the endoplasmic reticulum (ER). B) Representative transmission electron microscopy images of WT and macroH2A1 KO cells at 4 days post infection with HCMV. C) Annotation of images from (B). Right: Key for annotation. Below: Zooms of boxed regions of interest with annotated images of zoomed panels to the right. D) Average endoplasmic reticulum trace per 2.5 μm by 2.5 μm grid of WT and macroH2A1 KO cells in mock and 4 dpi. Bar graph shows mean length of ER per field of view with error bars indicating SEM. ** denotes p < 0.01, **** denotes p < 0.0001 by one-way ANOVA with subsequent Dunnett’s tests of pairs of interest. N=40 grids for mock cells and 100 for infected cells. E) Representative transmission electron microscopy images viral-induced assembly compartments (vIAC) at 4dpi in WT and macroH2A1 KO cells as indicated. Below: Zooms from image with annotated versions to the right as in (C). F) Quantification of vIAC subcompartment area. Violin plot depicts median, and upper, and lower quartiles as dotted lines. P < 0.001 by paired T-test. N>100 subcompartments. Scale bars as indicated.
Figure 3.
Figure 3.
Host gene expression is altered upon loss of macroH2A1 during HCMV infection. A) K-means clustering (k=4) of gene expression changes over 72 hours of infection shown as a heatmap. Z-scores were calculated for each gene from its normalized count across the time course of CMV infection for WT and macroH2A1 KO cells. B) The −log10(FDR) value for enrichment of neuronal GO categories in Cluster 1. C) Volcano plot where the Log2(Fold Change) for WT vs. macroH2A.1 KO is plotted against −log10(FDR) for genes in Cluster 1. Genes with Log2(Fold Change) >1 and FDR ≤ 0.05 are marked in red. Neuronal genes selected for further characterization are labeled in blue. D) Matrix of Euclidean distance between normalized expression profiles of CMV infection time course for WT and macroH2A1 KO, and other cell types. Gene expression datasets for other cell types were obtained from ENCODE. E) PCA plot showing PC1 and PC3 for the same expression profiles plotted in (D).
Figure 4.
Figure 4.
Successful HCMV maturation requires induction of dormant neuronal proteins. A) Schematic of targeted siRNA screen methodology. B) RT-qPCR quantification of RNA levels of target genes during HCMV infection. These genes include APOE, a lipoprotein associated with Alzheimer’s disease and synaptic vesicle release,; CNTFR, a ciliary neurotrophic factor receptor that supports motor neuron axons; DOC2B a calcium sensor that promotes synaptic vesicle release; ERC1, a cellular scaffolding protein; IFI27, an interferon-induced gene expressed in the cerebellum in response to viral CNS infection; KIF1A, a neuronal kinesin; LAMA1, a laminin essential for neurite growth,; LRRC4B, a transmembrane protein that regulates synapse formation; MYO5B, a myosin associated with polarity and axon development; NPTX2 (formerly NARP), a small molecule released in excitatory synapses; SOX11, a transcription factor associated with neuron development; and WWC1, a synaptic scaffolding protein. Knockdown of each gene at 4dpi is normalized to its expression in cells treated with the non-targeting control (NC) at 4 dpi. Bar graphs show mean with error bars indicating SEM. N=3 biological replicates. C) Quantification of GFP foci in cells infected with supernatant harvested from cells treated with indicated siRNA as depicted in (A). Bar graphs show mean with error bars indicating SEM. * indicates P < 0.05 by one way ANOVA with follow up Dunnett’s test. N=3 biological replicates. D) Quantification of plaque area produced from supernatant harvested from cells treated with siRNA indicated. Those that reach statistical significance are bolded. Bar graphs show mean with error bars indicating SEM. * denotes P < 0.05, ** denotes p < 0.01, *** denotes p < 0.001 by one way ANOVA with follow up Dunnett’s test. N > 300 plaques. E) Representative images of plaque sizes for those with significant differences as indicated. Yellow dashed line frames plaque example. Scale bar indicates 150 μm. F) Representative immunofluorescence images of HCMV-infected cells treated with indicated siRNA knockdown. DAPI is shown in cyan and pp28 is shown in magenta. Scale bar represents 10 μm. G) Quantification of nuclear volume in siRNA-treated cells infected with HCMV. Bar graph shows mean with error bars indicating SEM. * denotes P < 0.05, ** denotes p < 0.01 by one way ANOVA with follow up Dunnett’s test. N > 60 cells. H) Quantification of viral induced assembly compartment (vIAC) volume in siRNA-treated cells infected with HCMV. Bar graph shows mean with error bars indicating SEM. * denotes P < 0.05, *** denotes p < 0.001 by one way ANOVA with follow up Dunnett’s test. N > 60 vIACs. I) Model schematic. HCMV-infected cells upregulate numerous neuronal genes and these genes are required by the virus for proper cellular remodeling, formation of the viral assembly compartment, and viral maturation to promote viral spread.

References

    1. Cannon M. J., Schmid D. S. & Hyde T. B. Review of cytomegalovirus seroprevalence and demographic characteristics associated with infection. Rev. Méd. Virol. 20, 202–213 (2010). - PubMed
    1. Fowler K., Mucha J., Neumann M., Lewandowski W., Kaczanowska M., Grys M., Schmidt E., Natenshon A., Talarico C., Buck P. O. & Diaz-Decaro J. A systematic literature review of the global seroprevalence of cytomegalovirus: possible implications for treatment, screening, and vaccine development. BMC Public Heal. 22, 1659 (2022). - PMC - PubMed
    1. Zanghellini F., Boppana S. B., Emery V. C., Griffiths P. D. & Pass R. F. Asymptomatic Primary Cytomegalovirus Infection: Virologic and Immunologic Features. J. Infect. Dis. 180, 702–707 (1999). - PubMed
    1. Manicklal S., Emery V. C., Lazzarotto T., Boppana S. B. & Gupta R. K. The “Silent” Global Burden of Congenital Cytomegalovirus. Clin Microbiol Rev 26, 86–102 (2013). - PMC - PubMed
    1. Azevedo L. S., Pierrotti L. C., Abdala E., Costa S. F., Strabelli T. M. V., Campos S. V., Ramos J. F., Latif A. Z. A., Litvinov N., Maluf N. Z., Filho H. H. C., Pannuti C. S., Lopes M. H., Santos V. A., dos, Linardi C. da C. G., Yasuda. & Marques H. H. de S. Cytomegalovirus infection in transplant recipients. Clinics 70, 515–523 (2015). - PMC - PubMed

Publication types

LinkOut - more resources