[Preprint]. 2024 Jun 14:2024.06.07.597950.
doi: 10.1101/2024.06.07.597950.

Interactive data exploration websites for large-scale electrophysiology

Affiliations

Interactive data exploration websites for large-scale electrophysiology

Daniel Birman et al. bioRxiv. .

Abstract

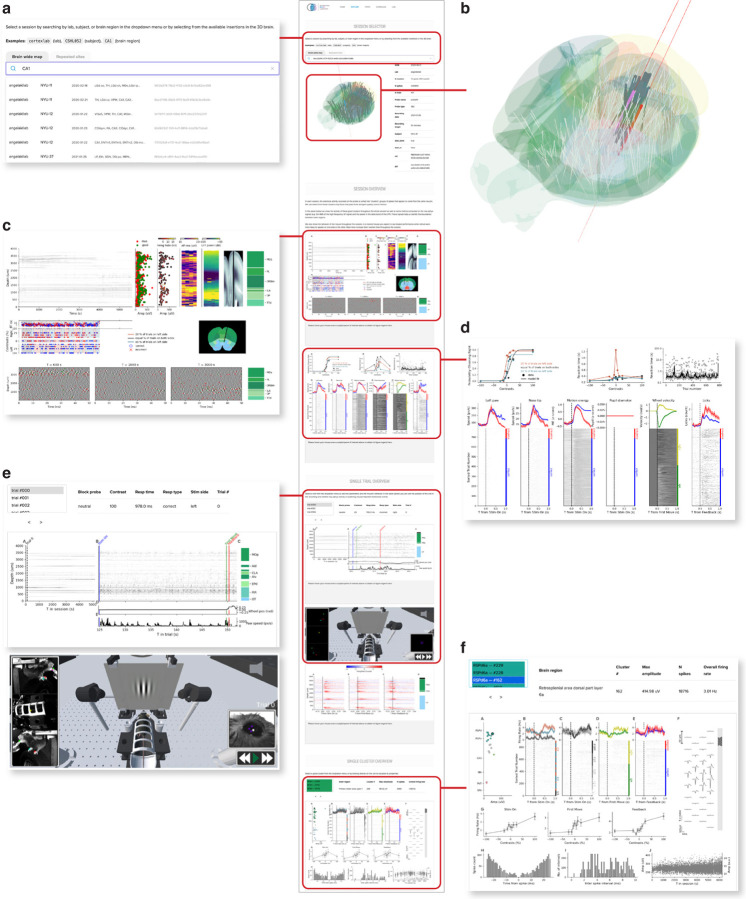
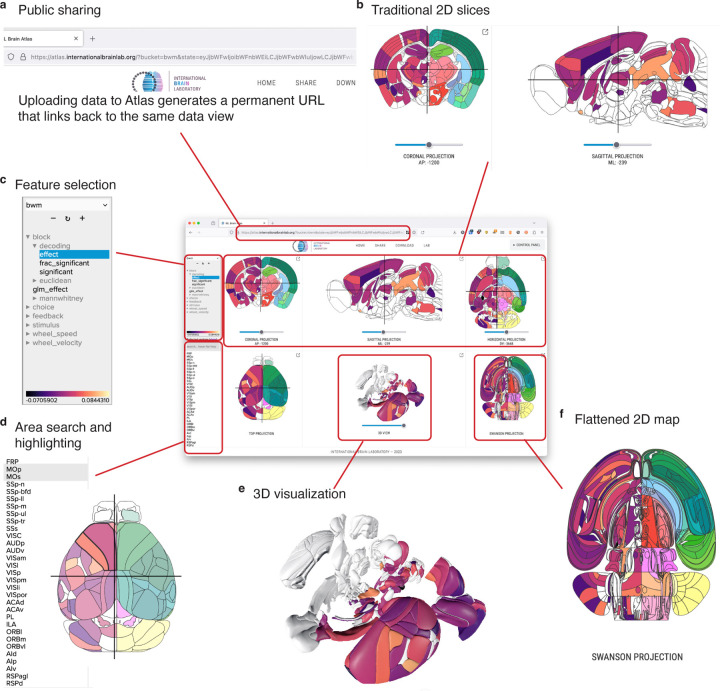
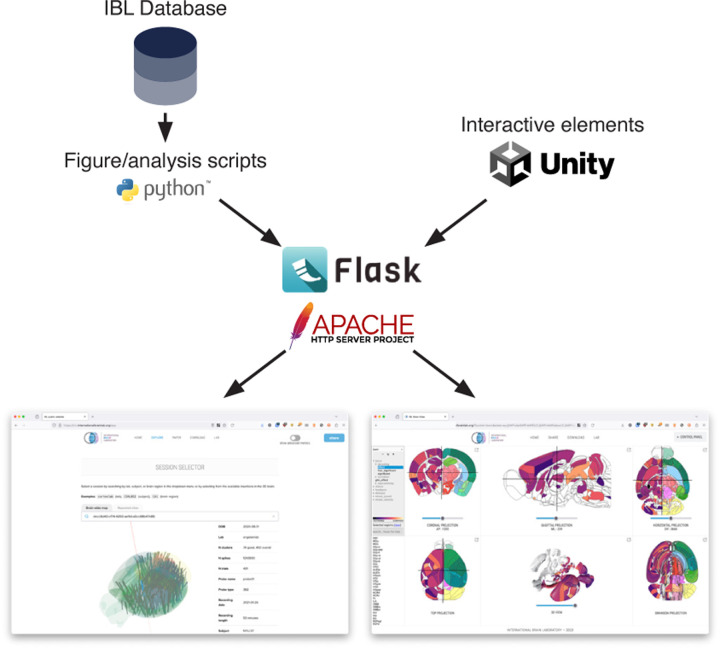
Methodological advances in neuroscience have enabled the collection of massive datasets which demand innovative approaches for scientific communication. Existing platforms for data storage lack intuitive tools for data exploration, limiting our ability to interact effectively with these brain-wide datasets. We introduce two public websites: (Data and Atlas) developed for the International Brain Laboratory which provide access to millions of behavioral trials and hundreds of thousands of individual neurons. These interfaces allow users to discover both the raw and processed brain-wide data released by the IBL at the scale of the whole brain, individual sessions, trials, and neurons. By hosting these data interfaces as websites they are available cross-platform with no installation. By releasing each site's code as a modular open-source framework, other researchers can easily develop their own web interfaces and explore their own data. As neuroscience datasets continue to expand, customizable web interfaces offer a glimpse into a future of streamlined data exploration and act as blueprints for future tools.


Figures

Figure 1:
Figure 1:
Data visualization website (link). (a) The top section of the Data website, showing the search bar. Users can search by insertion ID, brain region, lab, or subject ID. (b) The 3D brain allows users to hover over insertions with their mouse and click to select them. (c) An example of a session-level figure, showing an overview of the raw electrophysiology data before and after spike sorting, as well as some basic quality control metrics. (d) A second example of a session-level figure, summarizing the behavioral performance of the mouse on the task. (e) An example of a trial-level figure, showing the data from the first trial, including a snippet of the spike raster and wheel movements. The lower section shows a 3D reconstruction of the behavioral rig with annotated videos, on the website this animation can be used to replay the session. (f) An example of a cluster-level figure, here showing rasters and histograms relative to different trial events as well as the spike waveforms on the probe and various quality-control metrics. Not visible in the figure is the “Share” button, that creates a URL link that returns to the same configuration of the website, for easy sharing of a particular example of raw data among researchers.
Figure 2:
Figure 2:
Atlas visualization website (link). (a) The Atlas website generates unique links for each uploaded dataset, allowing users to share their uploaded results. (b) The three upper panels on the site show coronal, sagittal, and axial views of the brain. (c) A dataset selection window lets users choose which “feature” they want to display from the current dataset. (d) Individual areas can be highlighted from a search bar, or by clicking each region in any of the visualization panels. (e) A 3D reconstruction of the brain is shown in the center of the bottom panels. (f) The Swanson flatmap is shown, providing an overview of all regions in the mouse brain at once.
Figure 3:
Figure 3:
Server-side architecture. The Data and Atlas websites are served by Apache HTTP servers, using Flask to expose a REST API for access to datasets and static images. The figures and data are produced from custom Python scripts, developed with researchers from the International Brain Laboratory. The interactive 3D elements are developed with the Unity Real-Time Development Platform.

References

    1. Abbott L. F., Angelaki D. E., Carandini M., Churchland A. K., Dan Y., Dayan P., Deneve S., Fiete I., Ganguli S., Harris K. D., et al. (2017). An international laboratory for systems and computational neuroscience. Neuron, 96 (6), 1213–1218. - PMC - PubMed
    1. Claudi F., Tyson A. L., Petrucco L., Margrie T. W., Portugues R., & Branco T. (2021). Visualizing anatomically registered data with brainrender. Elife, 10, e65751. - PMC - PubMed
    1. Consortium M., Bae J. A., Baptiste M., Bishop C. A., Bodor A. L., Brittain D., Buchanan J., Bumbarger D. J., Castro M. A., Celii B., et al. (2021). Functional connectomics spanning multiple areas of mouse visual cortex. BioRxiv, 2021–07. - PMC - PubMed
    1. de Vries S. E., Siegle J. H., & Koch C. (2023). Sharing neurophysiology data from the allen brain observatory. Elife, 12, e85550. - PMC - PubMed
    1. Foster E. D., & Deardorff A. (2017). Open science framework (osf). Journal of the Medical Library Association: JMLA, 105 (2), 203.

Publication types