[Preprint]. 2024 Aug 22:2024.06.11.598290.
doi: 10.1101/2024.06.11.598290.

Multi-parametric thrombus profiling microfluidics detects intensified biomechanical thrombogenesis associated with hypertension and aging

Affiliations

Multi-parametric thrombus profiling microfluidics detects intensified biomechanical thrombogenesis associated with hypertension and aging

Misbahud Din et al. bioRxiv. .

Update in

Abstract

Arterial thrombosis, which represents a critical complication of cardiovascular diseases, is a leading cause of death and disability worldwide with no effective bioassay for clinical prediction. As a symbolic feature of arterial thrombosis, severe stenosis in the blood vessel creates a high-shear, high-gradient flow environment that effectively facilitates platelet aggregation towards vessel occlusion even with platelet amplification loops inhibited. However, no approach is currently available to comprehensively characterize the size, composition and platelet activation status of thrombi forming under this biorheological condition. Here, we present a thrombus profiling assay that monitors the multi-dimensional attributes of thrombi forming in conditions mimicking the physiological scenario of arterial thrombosis. Using this platform, we demonstrate that different receptor-ligand interactions contribute distinctively to the composition and activation status of the thrombus. Our investigation into hypertensive and older individuals reveals intensified biomechanical thrombogenesis and multi-dimensional thrombus profile abnormalities, demonstrating a direct contribution of mechanobiology to arterial thrombosis and endorsing the diagnostic potential of the assay. Furthermore, we identify the hyperactivity of GPIbα-integrin αIIbβ3 mechanosensing axis as a molecular mechanism that contributes to hypertension-associated arterial thrombosis. By studying the interactions between anti-thrombotic inhibitors and hypertension, and the inter-individual variability in personal thrombus profiles, our work reveals a critical need for personalized anti-thrombotic drug selection that accommodates each patient's pathological profile.


Conflict of interest statement

Competing interests: Authors declare that they have no competing interests.

Figures

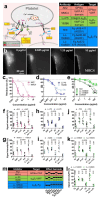
Figure 1.
Figure 1.. Combining microfluidic stenosis assay with multi-fluorescence imaging to comprehensively characterize biomechanical platelet aggregation.
(a) A microfluidic chip with a quarter coin placed adjacently. (b) Illustration of experimental setup. (c) Zoom-in of the dashed box in (b). A hump inside the channel creates 80% stenosis. When blood is perfused over, platelets spontaneously aggregate around the hump. (d) Shear rate and shear stress at the stenosis area estimated by fluid dynamics simulation. (e) Left: a layout of the two sets of fluorescently tagged sensors for thrombus profiling. Right: zoom-in of the thrombus shown in (c), illustrating the staining of Sensor Set 1. (f) Representative fluorescent images of thrombi stained with Sensor Set 1 (left) and 2 (right). (g) Representative time courses of signal intensity of biomarkers in Sensor Set 1 (left, detecting platelets (Plt), fibrinogen (Fg), VWF and P-selectin) and 2 (right, detecting platelets, phosphatidylserine (PS), extended integrin αIIbβ3 (E+ αIIbβ3) and fully activated αIIbβ3 (Act. αIIbβ3)). AFU: arbitrary fluorescence unit. (h,i) Scatter plots with mean±s.e.m. (n =28) of the signal intensity of all biomarkers (h; expired and refrigerated blood samples were tested as controls, n =4) and the normalized signal intensity of Fg, VWF, P-selectin, PS, E+ αIIbβ3 and Act. αIIbβ3 (i) 7.5 min after the onset of thrombus formation. The definition of each dimension of the 7-dimension thrombus profile is indicated below the graphs. (j) Scatter plots with mean±s.e.m. (n ≥3) of the thrombus residue size in the presence of aspirin (2×) or clopidogrel (2×) or both (2× or 20×), or ALB cocktail. N.S., not significant, compared with no drug treatment, assessed by one-way ANOVA (F-value =2.87, degrees of freedom =21) and multiple comparison (p =0.9848, >0.9999, >0.9999, >0.9999, =0.0447, respectively, from left to right).
Figure 2.
Figure 2.. Delineating the respective contribution of GPIbα–VWF, αIIbβ3–VWF and αIIbβ3–fibrinogen interactions to biomechanical platelet aggregation.
(a) (Left) Illustration of key receptor–ligand interactions in a biomechanical thrombus, highlighting the GPIbα-integrin αIIbβ3 mechanosensing axis. A panel of monoclonal antibodies and their respective targets are indicated, which were used to inhibit one receptor or ligand at a time. The head of integrin αIIbβ3 colored green or red respectively denotes the integrin being unrecognizable or recognizable by PAC-1. (Right) Table layout of tested antibodies and their respective antigens and targeting receptor–ligand interactions. (b) Representative images of DiOC6(3)-labeled thrombi formed in the presence of different concentrations of NMC4. (c-e) Dose-dependency curves of antibodies against GPIbα–VWF (c), αIIbβ3–VWF (d) and αIIbβ3–fibrinogen (e) interactions in reducing the size of biomechanical thrombi (mean±s.e.m.). (f-l) Comparing the normalized signal intensities of Fg, VWF, P-selectin, PS, E+ αIIbβ3 and Act. αIIbβ3 in the biomechanical thrombi, in the absence and presence of AK2 (f), NMC4 (g), LJ-P5 (h), 152B6 (i), 7E9 (j), LJ-155B39 (k) and LJ-134B29 (l), respectively (mean±s.e.m.; n =5). P-values are results of multiple t-test with points without and with drug treatment paired. (m) Summarizing the effects of AK2, NMC4, LJ-P5, 152B6, 7E9, LJ-155B39 and LJ-134B29 on the thrombus profile into 7-digit barcodes. A positive, neutral or negative effect is denoted by a bar being at the top, middle and bottom of the column, respectively; it is also numerically denoted by ‘+’, ‘0’ or ‘−’, respectively. The antibodies are categorized by their target receptor–ligand interaction, which is indicated by different background colors.
Figure 3.
Figure 3.. Testing the effects of inhibitors against integrin αIIbβ3, VWF and soluble agonists on biomechanical platelet aggregation.
(a) Dose dependency of 7E3 and 10E5, in reducing the size of the biomechanical thrombi (mean±s.e.m.). (b) Dose dependency of two sizes (50 and 510 nm) of polystyrene negatively charged nanoparticles (PS-CNP), in reducing the size of the biomechanical thrombi (mean±s.e.m.). (c-e) Comparing the normalized signal intensities of Fg, VWF, P-selectin, PS, E+ αIIbβ3 and Act. αIIbβ3 in the biomechanical thrombi, in the absence and presence of 7E3 (c), 10E5 (d) and PS-CNP (diameter: 510 nm) (e), respectively (mean±s.e.m.) (n =4 or 5). P-values are results of multiple t-test with points without and with drug treatment paired. (f) Summarizing the 7-digit effect barcodes of 7E3, 10E5 and PS-CNP. A rule of addition is indicated, demonstrating that the add-up of the barcodes of GPIbα–VWF inhibition and αIIbβ3–VWF inhibition equals that of VWF inhibition, and the add-up of the barcodes of αIIbβ3–VWF inhibition and αIIbβ3–Fg inhibition equals that of integrin αIIbβ3 inhibition.
Figure 4.
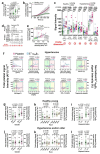
Figure 4.. Characterizing abnormalities in the thrombus profiles associated with hypertension and aging.
(a) Scatter plots with mean±s.e.m. (n indicated above each column) of the size of thrombi generated by healthy subjects grouped by age. P-values are results of one-way ANOVA (F-value =14.11, degrees of freedom =50) and multiple comparison. (b) Comparing the time course of thrombus growth (mean±s.e.m. with fitting lines of sigmoidal model) between healthy young and hypertensive groups (n =8). (c) Scatter plots with mean±s.e.m. of the thrombus profiles of healthy young, healthy older hypertensive young, and hypertensive older adult subjects (n =33, 14, 9 and 13, respectively). P-values are results of twoway ANOVA (F-values =7.85, 106.3, 43.66; degrees of freedom =18, 6, 3, for interaction, row factor and column factor, respectively) and multiple comparison. (d) P-values of the significance of the impact of aging on the thrombus profile of hypertensive subjects (top), and that of hypertension on the thrombus profile of older subjects. (e) Scatter plot of normalized E+ αIIbβ3 signal intensity vs. thrombus size, with blood from healthy young, healthy older, hypertensive young, and hypertensive older subjects (n =33, 14, 9, 13, respectively). Solid line: linear fitting of all data points, with two-sided regression slope test performed to show a significant positive correlation. Dash lines: threshold values that best separate healthy young and other groups. (f) Scatter plots and linear fits (P-values: results of two-sided regression slope test) of thrombus size and normalized E+ αIIbβ3 signal intensity vs. hypertension duration, systolic and diastolic blood pressures and their sum, HbA1C, BMI, total cholesterol, LDL-C, HDL-C and triglyceride in hypertension patients. Green, yellow, and red background colors indicate normal, borderline abnormal and pathologically abnormal ranges, respectively. (g-l) Scatter plots with mean±s.e.m. (n indicated above each column) of the thrombus size (left) and normalized E+ αIIbβ3 signal intensity (right) of healthy young (g-i) or hypertensive and/or older (j-l) subjects, grouped by gender (g,j), race (h,k) and ethnicity (i,l). One-way ANOVA and multiple comparison or Student’s t-test was performed for data comparison, with p-values, F- or t-values and degrees of freedom (df) annotated on the figures.
Figure 5.
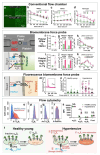
Figure 5.. Hyperactivity of GPIbα and integrin αIIbβ3 associated with hypertension.
(a) Snapshots of healthy young and hypertensive young subjects’ platelets adhering to VWFA1 (upper) or Fg (lower) in flow chamber. (b-d) Mean±s.e.m. (n ≥3) of surface coverage (b,d) and rolling velocity (c) vs. shear rate of platelets perfused over a surface pre-coated with 25 μg mL−1 VWFA1 (b,c) or 100 μg mL−1 Fg for 1 h (d). P-values are results of two-way ANOVA (F-values =0.183, 13.16, 42.39 (b), 0.352, 3.345, 69.22 (c), 0.768, 6.518, 27.65 (d); degrees of freedom = 15, 5, 3 (b), 15, 5, 3 (c), 15, 5, 3 (d) for interaction, row factor and column factor, respectively) and multiple comparison. (e) BFP setup photomicrograph (top) and molecular binding illustration (bottom). (f-k) Adhesion frequency (Scatter plots with mean±s.e.m.) (f,i), effective avidity and affinity (Mean±s.e.m.) (g,j) and bond lifetime vs. force (mean±s.e.m., n ≥300 for each curve) (h,k) of VWFA1- (f-h) or Fg- (i-k) coated beads binding to healthy young (HY) or hypertensive (HTN) subjects’ platelets. Student’s t-test was performed for data comparison, with p-values, t-values and degrees of freedom (df) annotated on the figures. (l) Illustration of fBFP setup. VWFA1 pulling on GPIbα triggers intraplatelet Ca2+ flux. (m) Representative time course of a hypertensive subjects’ platelet’s normalized Ca2+ level during repeated VWFA1 pulling at 40-pN clamping force. Peak increase ΔImax is marked. (n) Intraplatelet Ca2+ peak increase (scatter plot with mean±s.e.m.) of healthy young (left) and hypertensive (right) subjects’ platelets during VWFA1 pulling at different clamping forces. P-values are results of two-way ANOVA (F-values =5.601, 6.146, 63.34; degrees of freedom =3, 3, 1, for interaction, row factor and column factor, respectively) and multiple comparison. f,i,n: different symbol colors indicate data collected from different subjects. (o-r) Representative flow cytometry histograms of E+ αIIbβ3 (o; n =3), total αIIbβ3 (p), Act. αIIbβ3 (q) and P-selectin (r) signals on healthy young (blue) and hypertensive (red) subjects’ platelets. (s) Scatter plot with mean±s.e.m. (n =5) of flow cytometry MFI of total αIIbβ3, E+ αIIbβ3, Act. αIIbβ3 and P-selectin signals on healthy young (blue) and hypertensive (red) subjects’ platelets. Multiple t-test was performed for data comparison, with pvalues, t ratios and degrees of freedom (df) annotated on the figures. (t) Proposed mechanism model of E+ αIIbβ3 over-expression in the biomechanical thrombi of hypertension patients.
Figure 6.
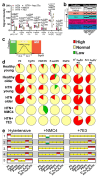
Figure 6.. Drug-disease interactions and personal thrombus barcodes.
(a) Individual point plot (n =5; lines connecting points of the same subjects) of the thrombus profiles of hypertension patients without and with aspirin/clopidogrel (2×), NMC4 (IC50) and 7E3 (IC50) treatment. P-values are results of two-way ANOVA (F-values =12.59, 23.13, 34.27; degrees of freedom =18, 6, 3, for interaction, row factor and column factor, respectively). (b) The 7-digit effect barcodes of hypertension without and with NMC4 or 7E3 treatment. A rule of addition is indicated. (c) Illustration of how values in the personal thrombus profiles being low, normal or high are defined. Thrombus profiles of healthy young subjects were used as the reference, the values of which are fitted to a Gaussian distribution. Mean±2s.d. range is defined as normal, and values lower or higher are defined as abnormally low and high, respectively. (d) Fractions of abnormally high, normal and abnormally low values in each dimension of the personal thrombus barcodes from healthy young, healthy older, hypertensive young, hypertensive older, hypertensive+NMC4 and hypertensive+7E3 groups. (e) Comparing the personal thrombus barcodes of hypertensive subjects without and with NMC4 or 7E3 inhibition. Blood samples from a total of 5 subjects was tested. For easier visualization, bars indicating ‘high’, ‘normal’ and ‘low’ are respectively marked by red, yellow, and green.

References

    1. Benjamin E. J. et al. Heart Disease and Stroke Statistics-2019 Update: A Report From the American Heart Association. Circulation 139, e56–e528, doi:10.1161/CIR.0000000000000659 (2019). - DOI - PubMed
    1. Springer T. A. von Willebrand factor, Jedi knight of the bloodstream. Blood 124, 1412–1425, doi:10.1182/blood-2014-05-378638 (2014). - DOI - PMC - PubMed
    1. Akturk I. F. et al. Hypertension as a risk factor for aspirin and clopidogrel resistance in patients with stable coronary artery disease. Clin Appl Thromb Hemost 20, 749–754, doi:10.1177/1076029613481102 (2014). - DOI - PubMed
    1. Liu X. F. et al. Prevalence of and risk factors for aspirin resistance in elderly patients with coronary artery disease. J Geriatr Cardiol 10, 21–27, doi:10.3969/j.issn.1671-5411.2013.01.005 (2013). - DOI - PMC - PubMed
    1. Jackson S. P. Arterial thrombosis--insidious, unpredictable and deadly. Nature medicine 17, 1423–1436, doi:10.1038/nm.2515 (2011). - DOI - PubMed

Publication types