[Preprint]. 2024 Jun 10:2024.06.10.598255.
doi: 10.1101/2024.06.10.598255.

Cholesterol inhibits assembly and activation of the EphA2 receptor

Affiliations

Cholesterol inhibits assembly and activation of the EphA2 receptor

Ryan J Schuck et al. bioRxiv. .

Update in

Abstract

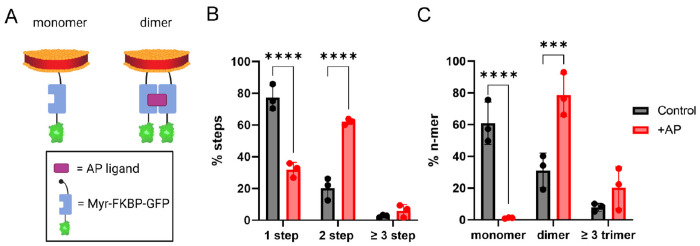
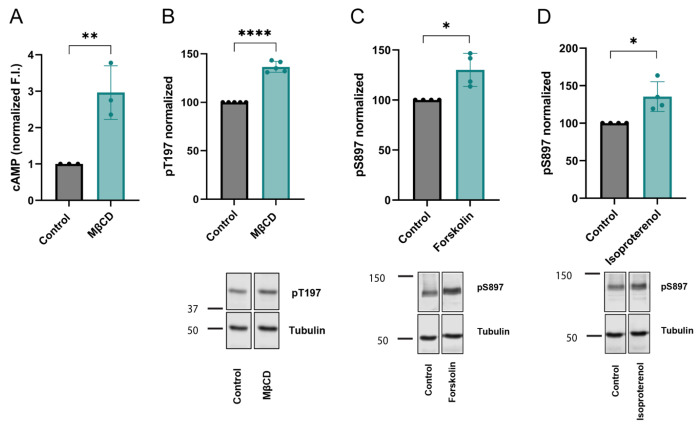
The receptor tyrosine kinase EphA2 drives cancer malignancy by facilitating metastasis. EphA2 can be found in different self-assembly states: as a monomer, dimer, and oligomer. However, our understanding remains limited regarding which EphA2 state is responsible for driving pro-metastatic signaling. To address this limitation, we have developed SiMPull-POP, a single-molecule method for accurate quantification of membrane protein self-assembly. Our experiments revealed that a reduction of plasma membrane cholesterol strongly promoted EphA2 self-assembly. Indeed, low cholesterol caused a similar effect to the EphA2 ligand ephrinA1-Fc. These results indicate that cholesterol inhibits EphA2 assembly. Phosphorylation studies in different cell lines revealed that low cholesterol increased phospho-serine levels, the signature of oncogenic signaling. Investigation of the mechanism that cholesterol uses to inhibit the assembly and activity of EphA2 indicate an in-trans effect, where EphA2 is phosphorylated by protein kinase A downstream of beta-adrenergic receptor activity, which cholesterol also inhibits. Our study not only provides new mechanistic insights on EphA2 oncogenic function, but also suggests that cholesterol acts as a molecular safeguard mechanism that prevents uncontrolled self-assembly and activation of EphA2.


Figures

Figure 1:
Figure 1:. GFP photobleaching analysis via SiMPull-POP reports on EphA2 oligomerization in a native-like membrane environment.
(A) Schematic representation of sample preparation and workflow for SiMPull-POP. 1- Membrane fractions containing EphA2-GFP were solubilized with the amphipathic copolymer DIBMA to generate DIBMALPs. 2- EphA2-GFP DIBMALPs were immobilized on a functionalized microscope slide displaying an EphA2 antibody. 3- DIBMALPs devoid of EphA2-GFP are washed away before imaging. (B) Representative single-molecule TIRF image in the presence (left) and absence (right) of EphA2 antibody. Each blue spot represents a DIBMALP containing EphA2-GFP. (C) Representative GFP photobleaching traces showing a stepwise decrease in GFP intensity over time; arrows represent individual photobleaching events. Photobleaching steps are used to infer EphA2 oligomerization status.
Figure 2:
Figure 2:. SiMPull-POP reports on FKBP dimerization.
(A) Schematic representation of DIBMALPs containing Myr-FKBP-GFP (monomer, left). FKBP-GFP dimerization is induced by the AP ligand (dimer, right). (B) Experimental step distribution of FKBP-GFP photobleaching in control conditions (black) and in the presence of AP ligand (red). (C) Calculated oligomeric distribution corrected for 70% maturation efficiency of GFP. p-values are from two-way ANOVA followed by Tukey multiple comparison test, ***, p ≤ 0.001; ****, p ≤ 0.0001.
Figure 3:
Figure 3:. Cholesterol reduction promotes EphA2 oligomerization in the absence of ligand.
(A) Schematic of DIBMALP containing an EphA2-GFP monomer. (B) Step distribution of control DIBMALPs (black) or those formed from cells treated with EA1 (pink), MβCD (blue) or both (magenta). (C) Oligomeric distribution calculated from data in panel B. (D) Schematic representing DDM micelles containing EphA2-GFP. (E) Step distribution of DDM-solubilized EphA2-GFP in the same conditions as in DIBMALPs. (F) Oligomeric distribution of DDM-solubilized EphA2-GFP photobleaching data. p-values are from two-way ANOVA followed by Tukey multiple comparison test.*, p ≤ 0.05; **, p ≤ 0.01; ***, p ≤ 0.001; ****, p ≤ 0.0001.
Figure 4:
Figure 4:. Extraction of cholesterol increases EphA2 Ser phosphorylation.
Western blot analysis of EphA2 pS897 in HEK293T (A), A375 (B) and A431 (C) cells. We show pS897 quantification (mean ± S.D) and representative blots. p-values from one-way ANOVA followed by Mann-Whitney U or t test. *, p ≤ 0.05; **, p ≤ 0.01.
Figure 5:
Figure 5:. Activation of cAMP-dependent protein kinase and upstream β-AR promote pS897 EphA2.
(A) cAMP quantification in HEK293T cells transduced with Red Up cADDis cAMP biosensor following treatment with MβCD. (B) Western blot analysis and quantification of PKA T197 phosphorylation in A375 cells following treatment with MβCD. (C-D) Western blot analysis and quantification of EphA2 S897 phosphorylation in A375 cells following treatment with forskolin and isoproterenol, respectively. Data shown in panel B are normalized to the respective total PKA signal in Figure S15A. Data shown in panels C-D are normalized to the respective total EphA2 signal in Figure S15B–C. Quantitative comparisons between treatments were made with respect to normalized control conditions. Bar graphs show mean ± S.D., p-values in panels A-D are from an unpaired t-test. *, p ≤ 0.05; **, p ≤ 0.01; ****, p ≤ 0.0001.
Figure 6:
Figure 6:. Proposed model of how Chol regulates EphA2 self-assembly & signaling.
(A) In the presence of normal levels of Chol (yellow oval), EphA2 (blue) can be found as a monomer and displays low Ser897 phosphorylation. We propose that in this state the kinase domain interacts with the SAM domain. (B) When Chol content is reduced, β-AR (purple) activity increases, promoting cAMP/PKA signaling that enhances Ser897 phosphorylation (red dot). This forces the kinase-SAM linker into an open conformation, which promotes higher-order oligomers independent from ligand stimulation.

References

    1. Pasquale E. B. Eph-Ephrin Bidirectional Signaling in Physiology and Disease. Cell 133, 38–52 (2008). - PubMed
    1. Boyd A. W., Bartlett P. F. & Lackmann M. Therapeutic targeting of EPH receptors and their ligands. Nature Reviews Drug Discovery 13, 39–62 (2014). - PubMed
    1. Kania A. & Klein R. Mechanisms of ephrin-Eph signalling in development, physiology and disease. Nature Reviews Molecular Cell Biology 17, 240–256 (2016). - PubMed
    1. Thaker P. H. et al. EphA2 expression is associated with aggressive features in ovarian carcinoma. Clinical Cancer Research 10, 5145–5150 (2004). - PubMed
    1. Xiao T. et al. Targeting EphA2 in cancer. Journal of Hematology and Oncology 13, 1–17 (2020). - PMC - PubMed

Publication types