. 2024 Jun 19;6(2):zcae028.
doi: 10.1093/narcan/zcae028. eCollection 2024 Jun.

CRISPR-Cas9 for selective targeting of somatic mutations in pancreatic cancers

Affiliations

CRISPR-Cas9 for selective targeting of somatic mutations in pancreatic cancers

Selina Shiqing K Teh et al. NAR Cancer. .

Abstract

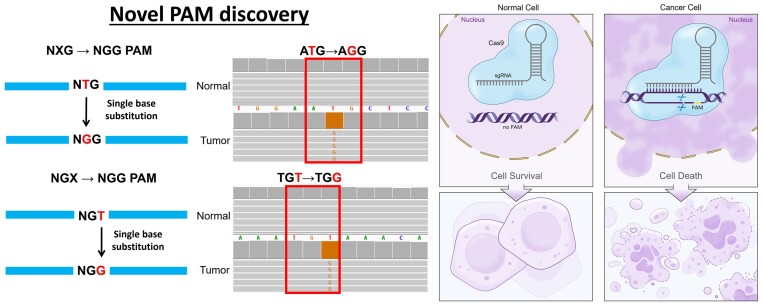
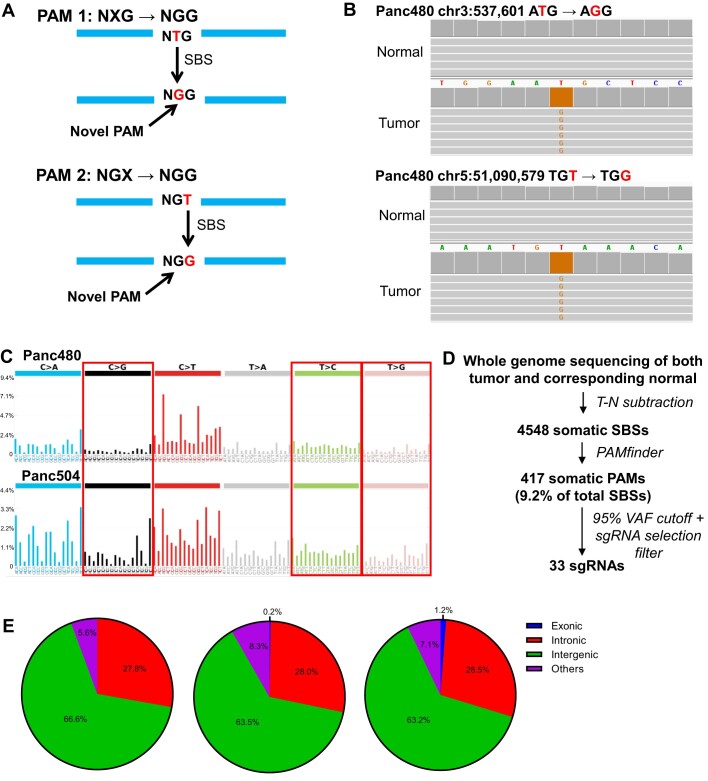
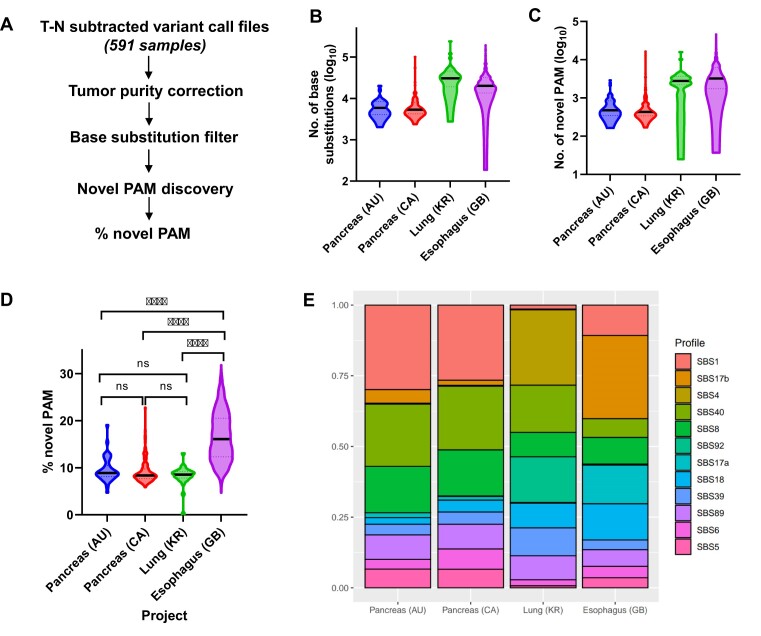
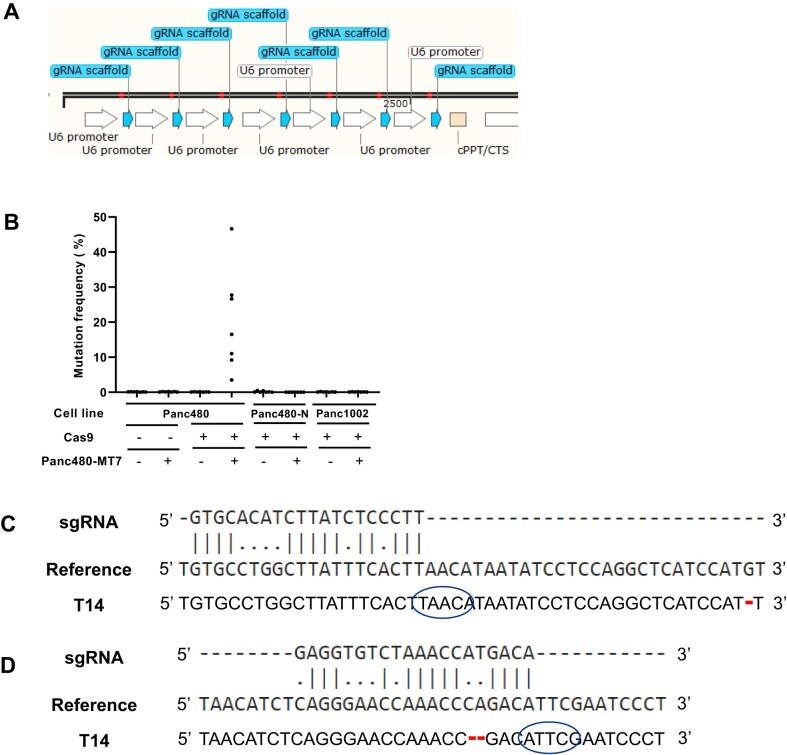
Somatic mutations are desirable targets for selective elimination of cancer, yet most are found within noncoding regions. We have adapted the CRISPR-Cas9 gene editing tool as a novel, cancer-specific killing strategy by targeting the subset of somatic mutations that create protospacer adjacent motifs (PAMs), which have evolutionally allowed bacterial cells to distinguish between self and non-self DNA for Cas9-induced double strand breaks. Whole genome sequencing (WGS) of paired tumor minus normal (T-N) samples from three pancreatic cancer patients (Panc480, Panc504, and Panc1002) showed an average of 417 somatic PAMs per tumor produced from single base substitutions. Further analyses of 591 paired T-N samples from The International Cancer Genome Consortium found medians of ∼455 somatic PAMs per tumor in pancreatic, ∼2800 in lung, and ∼3200 in esophageal cancer cohorts. Finally, we demonstrated 69-99% selective cell death of three targeted pancreatic cancer cell lines using 4-9 sgRNAs designed using the somatic PAM discovery approach. We also showed no off-target activity from these tumor-specific sgRNAs in either the patient's normal cells or an irrelevant cancer using WGS. This study demonstrates the potential of CRISPR-Cas9 as a novel and selective anti-cancer strategy, and supports the genetic targeting of adult cancers.


Figures

Graphical Abstract
Graphical Abstract
Figure 1.
Figure 1.
Somatic PAM discovery yielded hundreds of novel PAMs in pancreatic cancers (PCs). (A) A somatic NGG protospacer adjacent motif (PAM) can arise through a single base substitution (SBS) that creates a novel G from A/T/C (indicated as X), and this novel G is adjacent to an existing G immediately downstream (PAM 1) or upstream (PAM 2) of the novel G. Examples of T > G are shown. (B) Two somatic PAMs in the Panc480 tumor were both absent in their corresponding normal tissues. (C) Mutational signatures of two PCs, Panc480 and Panc504. The proportion of SBSs creating cancer-specific Gs and Cs that could potentially form novel PAMs were highlighted in red boxes. Y-axis is the percentage of SBS. (D) Workflow of somatic PAM discovery. (E) Proportions of somatic PAMs discovered in Panc480 (left), Panc504 (middle) and Panc1002 (right) that were located in different regions of the human genome. Others included non-coding RNAs, untranslated regions, and 1kb regions upstream/downstream of transcription start/end sites. For Panc480, no novel PAMs were found in exons.
Figure 2.
Figure 2.
Hundreds to thousands of somatic PAMs were found in different adult solid tumor types. (A) Workflow of PAM discovery in 591 tumor samples using T-N subtracted VCFs from the ICGC Data Portal (36). All analyses were corrected based on the tumor purity of individual sample. Samples from four cohorts were included: APGI-AU (Pancreas (AU); N = 44), PACA-CA (Pancreas (CA); N = 130), LUCA-KR (Lung (KR); N = 29), and OCCAMS-GB (Esophagus (GB); N = 388). (B, C) Truncated violin plots present the total number of (B) base substitutions and (C) novel PAMs in each cohort. (D) Truncated violin plot presents the percentage of base substitutions that created somatic PAMs. Kolmogorov–Smirnov tests; ns indicates non-significant, **** indicates P< 0.0001. (E) Mutational spectra analysis in each cohort.
Figure 3.
Figure 3.
Selective and specific targeting by CRISPR-Cas9. (A) Growth inhibition of two PC cell lines, Panc10.05 and TS0111, treated with non-targeting sgRNAs (NT and NT2), 3-, 5-, 8-, 12- and 14-target sgRNAs, and repetitive region-targeting sgRNAs (L1.4_209F, ALU_112a). N = 3; mean ± SEM are shown. (B) Panc10.05 cell population in co-cultures of Cas9-expressing Panc10.05 and mouse fibroblast (NIH 3T3) cell line transduced with human-specific 230F(12) sgRNA was quantified over time using flow cytometry or a mouse-human NGS assay. N = 3; mean ± SEM. (C) Representative images of γH2A.X staining in TS0111 cells transduced with either non-targeting (NT) sgRNA or sgRNAs targeting 4, 7 or 9 TS0111-specific sites. AGGn, targeting AGG trinucleotide, was used as a positive control. Cells were stained for γH2A.X two days after transduction. Images were acquired at 40X magnification. Scale bar is 5μM. (D-E) Bar graphs showing quantification of γH2A.X foci in (D) TS0111 (target cell line) and (E) Panc10.05 (negative control cell line). 200 nuclei were analyzed for each condition. N = 3; mean ± SD. Two-tailed unpaired t-tests; ns indicates non-significant, ** indicates P <0.01, **** indicates P <0.0001.
Figure 4.
Figure 4.
Selective cell killing with low number of sgRNAs designed from our somatic PAM discovery approach in three PC cell lines. (A-B) Co-cultures of Panc10.05 (labeled with mNeonGreen) and TS0111 cell mixtures were transduced with 4-sgRNA expression vectors that included either all non-targeting sgRNAs (NT quad) or Panc10.05-specific sgRNAs (Panc10.05 quad), and flow cytometry was performed to quantify mNeonGreen-positive cells. (A) Flow cytometry analyses of one replicate on day 21 post transduction. Left panel: cells treated with NT quad; right panel: Panc10.05 quad. (B) Percentage reduction of Panc10.05 relative to NT quad on day 1 and day 21 post transduction. N = 3; mean ± SEM. (C, D) Co-cultures of TS0111 (labeled with mApple) and Panc10.05 (labeled with mNeonGreen) were treated with three different pools of TS0111-specific sgRNAs (9 sgRNAs per pool) or the equivalent doses of non-targeting sgRNA controls (NT), and flow cytometry was performed to quantify cells that were positive for either mNeonGreen or mApple. (C) Flow cytometry analyses of one replicate on day 14 post transduction. Left panel: cells treated with NT; right panel: TS0111 Pool 1. (D) Percentage reductions of TS0111 relative to NT on days 1, 14 and 21 post transduction. N = 3; mean ± SEM. (E, F) Co-cultures of Panc480 (labeled with mApple) and TS0111 (labeled with mNeonGreen) were treated with three different pools of Panc480-specific sgRNAs (4 sgRNAs per pool) or a pool of 4 non-targeting sgRNA controls (NT), and flow cytometry was performed to quantify cells that were positive for either mNeonGreen or mApple. (E) Flow cytometry analyses of one replicate on day 21 post transductions. Left panel: cells treated with NT; right panel: Panc480 Pool 2. (F) Percentage reductions of Panc480 relative to NT on days 1 and 21 post transduction. N = 3; mean ± SEM.
Figure 5.
Figure 5.
Absence of off-target activity of Panc480-specific sgRNAs. (A) Illustration of Panc480-MT7 vector. The vector was designed to express 7 sgRNAs (red line indicates 20bp spacer) targeting Panc480 simultaneously. Diagram was generated by SnapGene. (B) Mutation frequency at 7 Panc480-specific target sites in Panc480 parental, Panc480 Cas9-expressing, Panc480 patient's Cas9-expressing lymphoblasts (normal cell line, Onc3286, indicated as Panc480-N), and Panc1002 Cas9-expressing (negative control) cell lines after treatment with NT (–) or Panc480-MT7 (+) multiplex sgRNA vector. (C) Pairwise sequence alignments among Panc480-MT7 chr8:29032916 sgRNA sequence (DNA bases are shown), the region surrounding chr8:7530860 in the hg19 human reference genome that has the lowest number of potential mismatches (6bp mismatches), and the actual sequence in Panc1002 T14. Red dash indicates deletion. (D) Pairwise sequence alignments among chrX:3982448 sgRNA sequence (DNA bases are shown), the region surrounding chr15:24671815 in hg19 that has the lowest number of potential mismatches (7 bp mismatches), and the actual sequence in Panc1002 T14. Red dash indicates deletion. Note also the absence of PAM immediately downstream of the potential target sequence (blue circles).

Update of

References

    1. Blokzijl F., de Ligt J., Jager M., Sasselli V., Roerink S., Sasaki N., Huch M., Boymans S., Kuijk E., Prins P. et al. . Tissue-specific mutation accumulation in human adult stem cells during life. Nature. 2016; 538:260–264. - PMC - PubMed
    1. Kumar S., Warrell J., Li S., McGillivray P.D., Meyerson W., Salichos L., Harmanci A., Martinez-Fundichely A., Chan C.W.Y., Nielsen M.M. et al. . Passenger mutations in more than 2,500 cancer genomes: overall molecular functional impact and consequences. Cell. 2020; 180:915–927. - PMC - PubMed
    1. Khurana E., Fu Y., Chakravarty D., Demichelis F., Rubin M.A., Gerstein M. Role of non-coding sequence variants in cancer. Nat. Rev. Genet. 2016; 17:93–108. - PubMed
    1. Tomasetti C., Vogelstein B., Parmigiani G. Half or more of the somatic mutations in cancers of self-renewing tissues originate prior to tumor initiation. Proc. Natl. Acad. Sci. U.S.A. 2013; 110:1999–2004. - PMC - PubMed
    1. Jinek M., Chylinski K., Fonfara I., Hauer M., Doudna J.A., Charpentier E. A programmable dual-RNA-guided DNA endonuclease in adaptive bacterial immunity. Science. 2012; 337:816–821. - PMC - PubMed