. 2024 Jun 5;4(1):vbae079.
doi: 10.1093/bioadv/vbae079. eCollection 2024.

OM2Seq: learning retrieval embeddings for optical genome mapping

Affiliations

OM2Seq: learning retrieval embeddings for optical genome mapping

Yevgeni Nogin et al. Bioinform Adv. .

Abstract

Motivation: Genomics-based diagnostic methods that are quick, precise, and economical are essential for the advancement of precision medicine, with applications spanning the diagnosis of infectious diseases, cancer, and rare diseases. One technology that holds potential in this field is optical genome mapping (OGM), which is capable of detecting structural variations, epigenomic profiling, and microbial species identification. It is based on imaging of linearized DNA molecules that are stained with fluorescent labels, that are then aligned to a reference genome. However, the computational methods currently available for OGM fall short in terms of accuracy and computational speed.

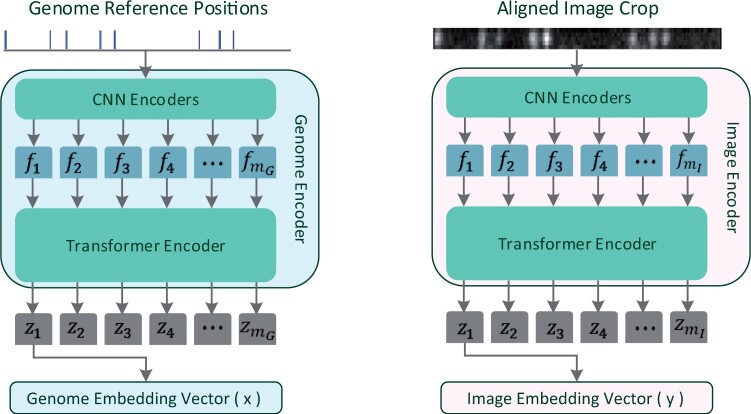
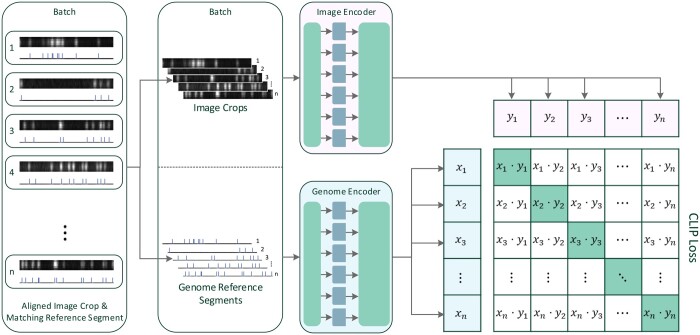
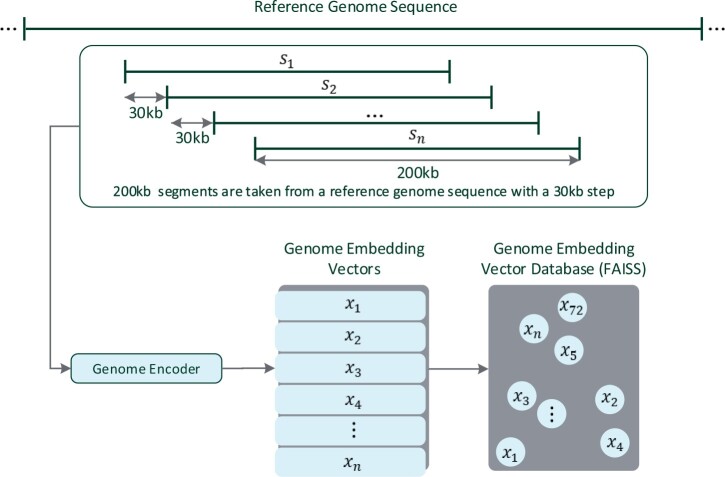
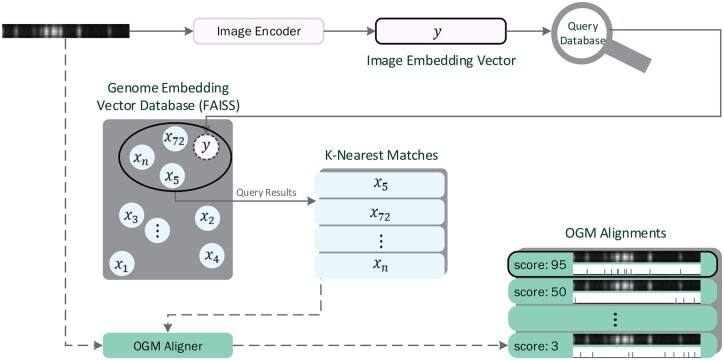
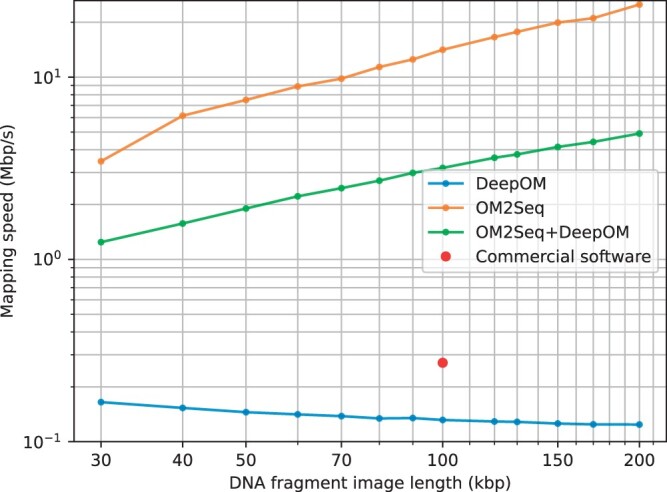
Results: This work introduces OM2Seq, a new approach for the rapid and accurate mapping of DNA fragment images to a reference genome. Based on a Transformer-encoder architecture, OM2Seq is trained on acquired OGM data to efficiently encode DNA fragment images and reference genome segments to a common embedding space, which can be indexed and efficiently queried using a vector database. We show that OM2Seq significantly outperforms the baseline methods in both computational speed (by 2 orders of magnitude) and accuracy.

Availability and implementation: https://github.com/yevgenin/om2seq.


Conflict of interest statement

None declared.

Figures

Figure 1.
Figure 1.
Training and validation data. The training data, as detailed in Section 2.3, was generated from images of DNA molecules acquired with the Bionano Saphyr instrument, labeled at a specific sequence pattern (CTTAAG, see Section 2.1). Individual molecule images were extracted using the output of the Bionano image processing pipeline. For the creation of the ground-truth set, a set of molecules with high Bionano alignment confidence score were chosen and their alignment was validated with the DeepOM algorithm (Nogin et al. 2023b). From this ground-truth set, subsets for training, validation, and test were sampled. Shown are: (a) an example of a long DNA molecule image in the ground-truth set and (b) an example of cropped fragment zero padded to a specific length (used later for training or evaluation), with its crop limits shown, alongside the corresponding reference genome segment with the labeled pattern positions shown.
Figure 2.
Figure 2.
Model architecture. The model of OM2Seq, as detailed in Section 2.4, is built upon a Transformer encoder architecture, which processes images of DNA molecules and reference genome sequence segments into a unified embedding space. This design is based on the architecture of WavLM (Chen et al. 2022), featuring a convolutional feature encoder (with outputs fi) followed by a transformer encoder (with outputs zi). The number m (mG for the Genome Encoder, mI for the Image Encoder), of extracted feature vectors fi, is dependent on the input length, and the CNN stride parameters. The first transformer output, z1, in the output sequence is taken as the output embedding vector, and the others are ignored.
Figure 3.
Figure 3.
Training the model. As detailed in Section 2.5, the model training process involves encoding images of DNA molecules and reference genome sequence segments into a unified embedding space and trained using a contrastive loss function, similar to CLIP (Radford et al. 2021). Both the Image Encoder and the Genome Encoder architectures are detailed in Fig. 2. All images are zero-padded to the same constant size during training and inference. The reference genome segments are always taken with a constant length.
Figure 4.
Figure 4.
Precomputed Genome Vector Database. As detailed in Section 2.6, the genome vector database, later queried in the inference phase, is precalculated by applying the trained Genome Encoder on 200 kb genome segments (si) extracted from a long genome reference with 30 kb offsets. The embedding vectors (xi) are then indexed into a FAISS vector database for fast retrieval (Johnson et al. 2021).
Figure 5.
Figure 5.
Inference and retrieval. As detailed in Section 2.6, the inference and retrieval process, inspired by DPR (Karpukhin et al. 2020), involves encoding an image of a DNA molecule to an embedding vector (y) and retrieving the nearest K candidate reference sequence segments from a precomputed vector database of their embeddings (xi, see Fig. 4). In a final optional step, an OGM aligner can be used to precisely align the nearest K matched reference segments (of size 200 kb) with the molecule image (which could be as short as 30 kb), and choose the highest scoring alignment. This way both high accuracy and high computation speed can be achieved (Section 3).
Figure 6.
Figure 6.
Accuracy. The accuracy of OM2Seq (number of candidates K =1), DeepOM, and their combination (K =16) is evaluated as detailed in Section 2.7, for various DNA fragment lengths. Accuracy results for the commercial software from the benchmark done in the DeepOM work are also shown for comparison [adapted from Fig. 4b, Bionano localizer + Bionano aligner, in Nogin et al. (2023b)]. Accuracy is measured as the proportion of queries where the predicted mapping overlaps with the correct genome reference positions. Error bars indicate 95% confidence intervals, calculated utilizing the Clopper–Pearson Beta Distribution method (Clopper and Pearson 1934).
Figure 7.
Figure 7.
Mapping speed. The mapping speed (computation speed, as described in Section 2.7) of OM2Seq, DeepOM, and their combination for various DNA fragment lengths. It is computed as the cumulative length of the DNA fragment queries in base pairs divided by the runtime. The mapping speed of the commercial software reported in Supplementary Information of DeepOM (Nogin et al. 2023b) is also shown.

References

    1. Bouwens A, Deen J, Vitale R. et al. Identifying microbial species by single-molecule dna optical mapping and resampling statistics. NAR Genom Bioinform 2020;2:lqz007. - PMC - PubMed
    1. Chen S, Wang C, Chen Z. et al. Wavlm: large-scale self-supervised pre-training for full stack speech processing. IEEE J Sel Top Signal Process 2022;16:1505–18.
    1. Clopper CJ, Pearson ES.. The use of confidence or fiducial limits illustrated in the case of the binomial. Biometrika 1934;26:404–13.
    1. Deen J, Sempels W, De Dier R. et al. Combing of genomic DNA from droplets containing picograms of material. ACS Nano 2015;9:809–16. - PMC - PubMed
    1. Dehkordi SR, Luebeck J, Bafna V.. Fandom: fast nested distance-based seeding of optical maps. Patterns 2021;2:100248. - PMC - PubMed