. 2024 Jul 9;18(27):17469-17482.
doi: 10.1021/acsnano.3c10889. Epub 2024 Jun 25.

α-Synuclein Oligomers Displace Monomeric α-Synuclein from Lipid Membranes

Affiliations

α-Synuclein Oligomers Displace Monomeric α-Synuclein from Lipid Membranes

Greta Šneiderienė et al. ACS Nano. .

Abstract

Parkinson's disease (PD) is an increasingly prevalent and currently incurable neurodegenerative disorder linked to the accumulation of α-synuclein (αS) protein aggregates in the nervous system. While αS binding to membranes in its monomeric state is correlated to its physiological role, αS oligomerization and subsequent aberrant interactions with lipid bilayers have emerged as key steps in PD-associated neurotoxicity. However, little is known of the mechanisms that govern the interactions of oligomeric αS (OαS) with lipid membranes and the factors that modulate such interactions. This is in large part due to experimental challenges underlying studies of OαS-membrane interactions due to their dynamic and transient nature. Here, we address this challenge by using a suite of microfluidics-based assays that enable in-solution quantification of OαS-membrane interactions. We find that OαS bind more strongly to highly curved, rather than flat, lipid membranes. By comparing the membrane-binding properties of OαS and monomeric αS (MαS), we further demonstrate that OαS bind to membranes with up to 150-fold higher affinity than their monomeric counterparts. Moreover, OαS compete with and displace bound MαS from the membrane surface, suggesting that disruption to the functional binding of MαS to membranes may provide an additional toxicity mechanism in PD. These findings present a binding mechanism of oligomers to model membranes, which can potentially be targeted to inhibit the progression of PD.

Keywords: Parkinson’s disease; aggregation; lipids; membranes; oligomers; α-synuclein.


Conflict of interest statement

The authors declare the following competing financial interest(s): Magdalena A. Czekalska, Quentin Peter, and Thomas Mueller are former employees of Fluidic Analytics Ltd., which is developing and commercializing microfluidic diffusional sizing and electrophoresis instrumentation. Sebastian Fiedler and Sean R. A. Devenish were employees of Fluidic Analytics Ltd. Tuomas P. J. Knowles was a founder and a member of the board of directors of Fluidic Analytics Ltd. Catherine K. Xu was a consultant for Fluidic Analytics Ltd. Greta Sneideriene received funding from Fluidic Analytics Ltd.

Figures

Figure 1
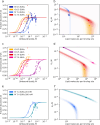
Figure 1
Probing MαS– and OαS–membrane interactions. (a) Microfluidic diffusional sizing-based approach for probing MαS– and OαS–membrane interactions. Alexa 488-labeled MαS or OαS were mixed with two different concentrations of ATTO 647-labeled DOPS or DOPC vesicles. The equilibrated mixtures were injected into an MDS chip. A conventional wide-field fluorescence microscope was used to record fluorescence intensity of the samples excited with 488 and 647 nm light simultaneously, allowing us to probe protein, protein–lipid complex, and lipid vesicle sizes in the same sample. Vesicle size measurements of (b) MαS/OαS–SUV and (c) OαS–LUV mixtures. Proteins were mixed with liposomes at different ratios, then sized by MDS. Data represent the hydrodynamic radii measured in the lipid channel. Dashed lines indicate sizes of pure liposomes. MDS data on binding of MαS (d) and OαS (e) to zwitterionic (DOPC) and negatively charged (DOPS) LUVs at pH 6.5. Two lipid concentrations were used: low subsaturating (50 μM) and high saturating (2 mM). Hydrodynamic radii (Rh, nm) measured from both the protein (MαS - blue, OαS - red) and lipid channel (gray) are represented with bars. 2 μM MαS and OαS (monomer equivalents) in 20 mM NaP pH 6.5 buffer was used. Error bars represent standard deviations of n = 3–4 measurements on individual microfluidic chips.
Figure 2
Figure 2
Binding of MαS (a, c) and OαS (b, d) to DOPS SUVs and LUVs. Two lipid concentrations were used: low, subsaturating (50 μM) and high, saturating (2 mM). Hydrodynamic radii (Rh, nm) were measured both in the protein (MαS - blue bars, OαS - red bars) and the lipid channel (gray bars and gray lines). 2 μM MαS and OαS (monomer equivalents) in 20 mM sodium phosphate buffer was used. Error bars represent standard deviations of n = 3–4 measurements on individual microfluidic chips.
Figure 3
Figure 3
Quantification of MαS/OαS binding affinities and stoichiometries to negatively charged DOPS vesicles with MDS. Data (points) and fits (lines) are shown in the left panels, alongside the corresponding marginal posterior probability distributions over affinity (KD) and stoichiometry expressed as lipid molecules per binding site in the right panels. (a, b) Binding of both MαS and OαS to SUVs at both pH 6.5 and 7.4. (c, d) Binding of OαS to SUVs and LUVs at pH 6.5 and 7.4. (e, f) Binding of MαS to SUVs at pH 7.4, with varying concentrations of sodium phosphate buffer (20 and 200 mM).
Figure 4
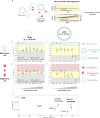
Figure 4
Electrophoretic analysis of MαS/OαS–lipid complexes by micro free flow electrophoresis (μFFE). (a) Experimental scheme of μFFE. Electrophoretic mobilities (μ, ×10–8 m2 V–1 s–1) of αS–liposome complexes: (b) MαS with SUVs, (c) MαS with LUVs, (d) OαS with SUVs, and (e) OαS with LUVs. In each plot, first the mobility of free protein (full blue/red circles) is plotted, followed by the mobility values at different molar lipid:protein ratio (25:1, 50:1, 125:1, 250:1, 500:1; empty circles) with the mobility of the free SUV/LUV plotted last (full green circles). Blue, red, yellow, and gray regions represent the mobility ranges of MαS, OαS, protein–lipid complexes, and free vesicles, respectively. ζ-Potentials (f) of MαS/OαS and MαS/OαS–liposome complexes, determined through the combination of the μFFE and MDS measurements (plotted as the function of molecular weight (Da)). The marker sizes are drawn to a relative scale of MαS, OαS, MαS/OαS–liposome complexes and pure liposome dimensions. All experiments were run in 20 mM pH 6.5 NaP buffer. Each data point represents the mean of n > 3 independent repeats, and error bars represent standard deviations. The blue, red, yellow, and gray regions are guides to the eye and represent mobilities of free MαS, OαS, MαS/OαS–liposome complexes, and pure liposomes.
Figure 5
Figure 5
OαS–MαS binding competition assay. MαS (2 μM) was mixed with 150 μM SUVs (a, Rh = 15 ± 1 nm) and LUVs (b, Rh = 49 ± 3 nm, shown in gray) and allowed to equilibrate, following which the size was measured by MDS. Following this, OαS (2 μM) were added and further left for equilibration. First, sizes of free protein are depicted for comparison (MαS: Rh = 3.4 ± 0.1 nm, OαS: Rh = 5.2 ± 0.2 nm). Then, a size measured from the MαS channel after incubation with lipid vesicles is plotted. (Rh = 14.9 ± 0.7 nm for SUVs and Rh = 7.7 ± 6.7 nm for LUVs.) Upon addition of OαS however, the size of MαS decreases (Rh = 6.2 ± 0.7 nm for SUVs and Rh = 2.6 ± 0.3 nm for LUVs), while the size measured for the OαS channel is larger (Rh = 16.3 ± 1.1 nm for SUVs and Rh = 20.2 ± 12.2 nm for LUVs) in comparison to unbound protein (Rh = 5.3 ± 0.2 nm). Error bars represent standard deviations of n = 3–4 measurements on individual microfluidic chips.

References

    1. Wakabayashi K.; Tanji K.; Mori F.; Takahashi H. The Lewy Body in Parkinson’s Disease: Molecules Implicated in the Formation and Degradation of α-Synuclein Aggregates. Neuropathology 2007, 27, 494–506. 10.1111/j.1440-1789.2007.00803.x. - DOI - PubMed
    1. Lashuel H. A. Do Lewy Bodies Contain Alpha-Synuclein Fibrils? And Does It Matter? A Brief History and Critical Analysis of Recent Reports. Neurobiol. Dis. 2020, 141, 104876. 10.1016/j.nbd.2020.104876. - DOI - PubMed
    1. Gai W. P.; Yuan H. X.; Li X. Q.; Power J. T.; Blumbergs P. C.; Jensen P. H. In Situ and in Vitro Study of Colocalization and Segregation of Alpha-Synuclein, Ubiquitin, and Lipids in Lewy Bodies. Exp. Neurol. 2000, 166, 324–333. 10.1006/exnr.2000.7527. - DOI - PubMed
    1. Froula J. M.; Castellana-Cruz M.; Anabtawi N. M.; Camino J. D.; Chen S. W.; Thrasher D. R.; Freire J.; Yazdi A. A.; Fleming S.; Dobson C. M.; Kumita J. R.; Cremades N.; Volpicelli-Daley L. A. Defining Alpha-Synuclein Species Responsible for Parkinson’s Disease Phenotypes in Mice. J. Biol. Chem. 2019, 294, 10392–10406. 10.1074/jbc.RA119.007743. - DOI - PMC - PubMed
    1. Fortuna J. T. S.; Gralle M.; Beckman D.; Neves F. S.; Diniz L. P.; Frost P. S.; Barros-Aragão F.; Santos L. E.; Gonçalves R. A.; Romão L.; Zamberlan D. C.; Soares F. A. A.; Braga C.; Foguel D.; Gomes F. C. A.; Felice F. G.; De Ferreira S. T.; Clarke J. R.; Figueiredo C. P. Brain Infusion of Alpha-Synuclein Oligomers Induces Motor and Non-Motor Parkinson’s Disease-like Symptoms in Mice. Behav. Brain Res. 2017, 333, 150–160. 10.1016/j.bbr.2017.06.047. - DOI - PubMed

Publication types

LinkOut - more resources